. 2020 Jul 29;11(1):3790.
doi: 10.1038/s41467-020-17582-x.

Molecular mechanisms underlying menthol binding and activation of TRPM8 ion channel

Affiliations

Molecular mechanisms underlying menthol binding and activation of TRPM8 ion channel

Lizhen Xu et al. Nat Commun. .

Abstract

Menthol in mints elicits coolness sensation by selectively activating TRPM8 channel. Although structures of TRPM8 were determined in the apo and liganded states, the menthol-bounded state is unresolved. To understand how menthol activates the channel, we docked menthol to the channel and systematically validated our menthol binding models with thermodynamic mutant cycle analysis. We observed that menthol uses its hydroxyl group as a hand to specifically grab with R842, and its isopropyl group as legs to stand on I846 and L843. By imaging with fluorescent unnatural amino acid, we found that menthol binding induces wide-spread conformational rearrangements within the transmembrane domains. By Φ analysis based on single-channel recordings, we observed a temporal sequence of conformational changes in the S6 bundle crossing and the selectivity filter leading to channel activation. Therefore, our study suggested a 'grab and stand' mechanism of menthol binding and how menthol activates TRPM8 at the atomic level.


Conflict of interest statement

The authors declare no competing interests.

Figures

Fig. 1
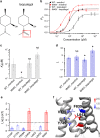
Fig. 1. Potential menthol–TRPM8 interactions revealed by docking.
a The chemical structure of (−)-menthol, where its hydroxyl and isopropyl moieties are named as hand and legs, respectively. Menthol activated TRPM8 channel in a concentration-dependent manner in whole-cell patch-clamp recordings. b The concentration–response curve of menthol activation measured from whole-cell patch-clamp recordings (n = 5). c The maximum open probability (Po max) was determined from noise analysis of menthol-induced TRPM8 current. The measured maximum current (Imax_menthol) was normalized to the predicted maximum current to derive Po max. d The putative menthol-binding pocket located within the transmembrane domains of TRPM8 channel as revealed by cryo-EM. The zoom-in view of the binding pocket illustrated that residues known to be critical for menthol activation are tightly packed in the apo state (PDB ID: 6BPQ). e Docking of menthol into the binding pocket in the WS-12-bound activated state (PDB ID: 6NR2) lead to disruption of residue packing. The hydroxyl hand of menthol is predicted to form a hydrogen bond with the sidechain of R842 (dashed line in red). f–h Breakdown of the menthol-binding energy (h). The per-residue energy contributed by hydrogen bonding (f) and VDW interactions (g) was mapped onto the structure of TRPM8, respectively. The redder in color scale indicates larger energy value in REU (Rosetta energy unit). All statistical data are given as mean ± s.e.m. Source data are provided as a Source Data file.
Fig. 2
Fig. 2. A specific interaction between menthol hydroxyl hand and the channel.
a Docking predicted that there is a hydrogen bond between the hydroxyl hand of menthol and the sidechain of R842 (dashed line in black). b Chemical structures of menthol and p-menthane. c Representative whole-cell patch-clamp recording showed that p-menthane lacking the hydroxyl hand up to 10 mM cannot activate TRPM8 channel. d Chemical structure of menthone, which was used in thermodynamic mutant cycle analysis. The concentration–response curves of wild type and mutant such as R842 with either menthol or menthone were measured with whole-cell patch-clamp recordings (n = 3–5). e, f The general gating scheme where the ligand binding is represented by Kd and the equilibrium constant between the closed and open states upon ligand binding is L. For wild type and R842 channel, Kd and L values were calculated from the concentration–response curves in d (two-sided t-test, *p < 0.05; **p < 0.01; ***p < 0.001; NS, not statistically significant). g Summary of coupling energy measurements. Coupling energy value was calculated from the Kd values. Mutants showing a coupling energy larger than 1.5 kT (dashed line) were colored in red. Those with less energy were colored in different shades of blue. At least four independent trials were performed for each chemical at each concentration. h Spatial distribution of coupling energy values within the menthol-binding pocket. Color scheme is the same as in g. Color scale is in the unit of kT. All statistical data are given as mean ± s.e.m. Source data are provided as a Source Data file.
Fig. 3
Fig. 3. Specific interactions between menthol isopropyl legs and the channel probed with 3-methylcyclohexanol.
a Docking predicted that the isopropyl legs of menthol stand on hydrophobic residues through VDW interactions (dashed lines in black: C9 atom of menthol to CD1 atom of I846: 3.53 Å; C8 atom of menthol to CB atom of L843: 3.66 Å). b Chemical structures of menthol, 3-methylcyclohexanol lacking the isopropyl legs, and cyclohexanol where both the isopropyl and methyl moieties are missing compared to menthol. c The concentration–response curves of wild type and mutant such as I846V with either menthol or 3-methylcyclohexanol were measured with whole-cell patch-clamp recordings (n = 3–5). d Representative whole-cell patch-clamp recording showed that cyclohexanol up to 5 mM cannot activate TRPM8 channel. e, f For wild type and I846V channel, Kd and L values were calculated from the concentration–response curves in c (two-sided t-test, *p < 0.05; NS not statistically significant). g Summary of coupling energy measurements. Coupling energy value was calculated from the Kd values. Mutants showing a coupling energy larger than 1.5 kT (dashed line) were colored in red. Those with less energy were colored in different shades of blue. At least four independent trials were performed for each chemical at each concentration. h Spatial distribution of coupling energy values within the menthol-binding pocket. Color scheme is the same as in g. Color scale is in the unit of kT. All statistical data are given as mean ± s.e.m. Source data are provided as a Source Data file.
Fig. 4
Fig. 4. Specific interactions between menthol isopropyl legs and the channel probed with isopulegol.
a Chemical structures of menthol and isopulegol. The isopropyl group in menthol is replaced by the methylethenyl group in isopulegol (dashed box in red). b The concentration–response curves of wild type and mutant such as I846V with either menthol or isopulegol were measured with whole-cell patch-clamp recordings (n = 3–5). c, d For wild type and I846V channel, Kd and L values were calculated from the concentration–response curves in c (two-sided t-test, *p < 0.05; NS not statistically significant). e Summary of coupling energy measurements. Coupling energy value was calculated from the Kd values. Mutants showing a coupling energy larger than 1.5 kT (dashed line) were colored in red. Those with less energy were colored in different shades of blue. At least four independent trials were performed for each chemical at each concentration. f Spatial distribution of coupling energy values within the menthol-binding pocket. Color scheme is the same as in e. Color scale is in the unit of kT. g Structural fluctuation in the menthol-bound S1–S4 domain during 378 ns molecular dynamic simulation. Root-mean-square deviation (RMSD) of protein structures was calculated as compared to our menthol docking model. h Ensemble plot of the menthol molecule (dashed box in yellow) with snapshots of the simulation from the beginning to the end (red and blue, respectively). A snapshot was saved every 10 ns during the simulation. All statistical data are given as mean ± s.e.m. Source data are provided as a Source Data file.
Fig. 5
Fig. 5. Menthol-induced conformational rearrangements revealed by ANAP imaging.
a The selectivity filer of TRPM8 was missing in its cryo-EM structure (PDB ID: 6BPQ). It is expected to locate within the dashed circle in red. b The models of selectivity filter after nine rounds of KIC loop modeling exhibited a funnel-shaped distribution of total energy calculated by Rosetta (REU, Rosetta energy unit). c Distribution of pore radii in TRPM8 with the selectivity filter modeled. The regions in red are too narrow to allow a water molecule to pass. The regions in green or blue are sites allowing single or multiple water molecules and ions to pass, respectively. Pore radii were calculated by the HOLE program. SF selectivity filter. d Chemical structure of ANAP and representative images of negative control cells where the pANAP vector was not added, and positive cells expressing ANAP-incorporated TRPM8. Pseudocolors for ANAP were used. Scale bar: 10 μm. e Representative emission spectra (black, bath solution; red, solution containing 0.5 mM menthol) of ANAP-incorporated TRPM8 mutants. f Summary of shifts in ANAP emission peak at different incorporation sites (for each ANAP-incorporation site, n = 4–6). Right and left shifts larger than 2 nm were colored in red and blue, respectively. g Shifts in ANAP emission peak mapped onto the TRPM8 model with a worm representation, where the worm radius was proportional to the amplitude of shifts. Right and left shifts were colored in red and blue, respectively. Color scale is in the unit of nanometer. All statistical data are given as mean ± s.e.m. Source data are provided as a Source Data file.
Fig. 6
Fig. 6. Φ analysis and temporal sequence of events in menthol activation of TRPM8 channel.
a The free-energy landscape of a closed-to-open transition. Point mutations, depending on its location, have asymmetrical effects on the free energies of closed and open state, which can be reflected in the kinetics of single-channel events. b Representative single-channel recordings of WT and mutants. c–f Measured opening and closing rates (circles in blue and black, respectively) for point mutations at individual sites. For each mutation at the same site, 3-to-5 independent single-channel recordings were analyzed. gj Brønsted plots to determine the Φ value as the slope of linear fitting (dashed line) for each site. All statistical data are given as mean ± s.e.m. k Φ values measured from single-channel recordings were mapped on the TRPM8 model. Residues moved early or late were colored in red or blue, respectively. Red and blue in color scale indicate relatively early and late movements, respectively. l fprogress values calculated by iENM were mapped on the TRPM8 model. Residues moved early or late were colored in red or blue, respectively. m The Φ values (black) and fprogress values (orange) matched well with each other at multiple residues. n A schematic diagram showing the temporal sequence of events upon menthol binding that lead to the full activation of TRPM8. All statistical data are given as mean ± s.e.m. Source data are provided as a Source Data file.

Similar articles

Cited by

References

    1. Liu B, et al. TRPM8 is the principal mediator of menthol-induced analgesia of acute and inflammatory pain. Pain. 2013;154:2169–2177. - PMC - PubMed
    1. Galeotti N, Di Cesare Mannelli L, Mazzanti G, Bartolini A, Ghelardini C. Menthol: a natural analgesic compound. Neurosci. Lett. 2002;322:145–148. - PubMed
    1. Stander S, et al. Novel TRPM8 agonist cooling compound against chronic itch: results from a randomized, double-blind, controlled, pilot study in dry skin. J. Eur. Acad. Dermatol. Venereol. 2017;31:1064–1068. - PubMed
    1. Peier AM, et al. A TRP channel that senses cold stimuli and menthol. Cell. 2002;108:705–715. - PubMed
    1. McKemy DD, Neuhausser WM, Julius D. Identification of a cold receptor reveals a general role for TRP channels in thermosensation. Nature. 2002;416:52–58. - PubMed

Publication types

MeSH terms

LinkOut - more resources