. 2020 Jul 28;32(4):107943.
doi: 10.1016/j.celrep.2020.107943.

Mitochondria and Peroxisome Remodeling across Cytomegalovirus Infection Time Viewed through the Lens of Inter-ViSTA

Affiliations

Mitochondria and Peroxisome Remodeling across Cytomegalovirus Infection Time Viewed through the Lens of Inter-ViSTA

Joel D Federspiel et al. Cell Rep. .

Abstract

Nearly all biological processes rely on the finely tuned coordination of protein interactions across cellular space and time. Accordingly, generating protein interactomes has become routine in biological studies, yet interpreting these datasets remains computationally challenging. Here, we introduce Inter-ViSTA (Interaction Visualization in Space and Time Analysis), a web-based platform that quickly builds animated protein interaction networks and automatically synthesizes information on protein abundances, functions, complexes, and subcellular localizations. Using Inter-ViSTA with proteomics and molecular virology, we define virus-host interactions for the human cytomegalovirus (HCMV) anti-apoptotic protein, pUL37x1. We find that spatiotemporal controlled interactions underlie pUL37x1 functions, facilitating the pro-viral remodeling of mitochondria and peroxisomes during infection. Reciprocal isolations, microscopy, and genetic manipulations further characterize these associations, revealing the interplay between pUL37x1 and the MIB complex, which is critical for mitochondrial integrity. At the peroxisome, we show that pUL37x1 activates PEX11β to regulate fission, a key aspect of virus assembly and spread.

Keywords: HCMV; IP-MS; Inter-ViSTA; MICOS; mitochondria; pUL37; peroxisome; protein interactions; vMIA; virus-host interactions.


Conflict of interest statement

Declaration of Interests The authors declare no competing interests.

Figures
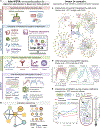
Figure 1.
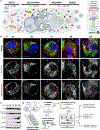
Figure 1.. Inter-ViSTA Is a Computational Platform for Real-Time Analysis and Visualization of Interactome Datasets
(A) A schematic depicting the Inter-ViSTA computational interface, from user input of experimental bait-prey pairs to data visualization and export. (B) Inter-ViSTA animated network key, with nodes and edges color coded by interaction characteristics. (C) Single-frame shots of the networks generated by Inter-ViSTA from the cyclin interactions by Pagliuca et al. (2011). The cyclins used as baits are shown adjacent to the indicated cell-cycle stage. Key interaction groups shared between baits are highlighted in blue. (D) Protein interactions of Us9 during PRV infection (Kramer et al., 2012) clustered by temporal abundance via Inter-ViSTA. Notable GO terms are indicated. (E) Inter-ViSTA identified organelle-specific abundance profiles of OPRD1 interactors during internalization and trafficking (Lobingier et al., 2017). Experiment temporality is indicated at right. See also Figures S1 and S2, Videos S1, S2, and S3, and Table S1.
Figure 2.
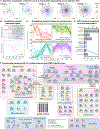
Figure 2.. Investigation of pUL37×1 Spatial and Temporal Dynamics across the Replication Cycle of HCMV
(A) Schematic representing pUL37×1 localization and HCMV biology, highlighting spatial-temporal changes to organelles. pUL37×1 is translated in the ER around6 hpi, quickly localized to mitochondria and peroxisomes, and remains expressed throughout infection. (B) Fluorescence microscopy images (z stack maximum projections) of human fibroblast cells infected with pUL37×1-GFP virus (green) and labeled for mitochondria (red, MitoTracker). Arrows indicate likely peroxisomal pUL37×1 localization (pUL37×1 puncta not colocalized with mitochondria). Scale bars are 10 μm. (C) Western blot of pUL37×1-GFP-infected cell lysates across infection time, with antibodies against viral proteins. Consistent protein loading is indicated by GAPDH. (D) Workflow schematic of the investigation performed in this study. Two biological replicates were performed for each time point. See also Table S2
Figure 3.
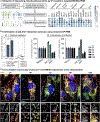
Figure 3.. pUL37×1 Protein and Protein Complex Interactions Are Temporally Controlled during HCMV Infection
(A) Single time point shots of the animated pUL37×1 interaction network generated by Inter-ViSTA, with a specificity cutoff of 0.9 (see Video S4 for animation). (B) Graphical representation of pUL37×1 prey protein interaction spells organized by organelle localization. Each line represents an interacting protein, and the line width represents the duration of interaction with pUL37×1. The percentage of specific pUL37×1 interactors localized to either the mitochondria or peroxisome is indicated at the lower right. (C) Enriched GO terms of pUL37×1 interactors across all time points, plotted as the percentage of proteins out of the total interactome (upper x axis). The corrected p value for each term is plotted on the lower x axis. A complete list of GO terms is in Table S3D. (D) pUL37×1 interactors cluster into four temporal groups by quantitative abundance profiles. Select GO terms enriched in each cluster are indicated. (E) The pUL37×1 interactome as annotated by Inter-ViSTA and assembled in Cytoscape. Proteins are clustered by function, and edges represent STRING-based protein interactions. Bar graphs depict the association abundance at each time point. Protein names indicate the duration of passing the specificity cutoff: all time points (red), 2–4 (black), or only one time point (blue). Black circles denote complex members. See also Video S4 and Table S3.
Figure 4.
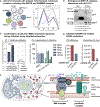
Figure 4.. Validation of Temporal pUL37×1 Mitochondrial Interactions
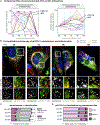
(A) Left: design of a parallel reaction monitoring (PRM) assay for the sensitive validation of pUL37×1 interactions. Right: heatmap depicting the minimum to maximum association with pUL37×1 (bait) for each prey protein, determined by PRM. White space indicates time points when the protein was not detected as interacting with pUL37×1. (B) Reciprocal isolations of endogenous pUL37×1 interactors, RMDN3 and RHOT1, followed by PRM analyses to validate temporal interactions with pUL37×1. Left: an IgG control was used for each IP, confirming the specificity of endogenous IP. Right: isolation of RMDN3 and RHOT1 was performed across infection and pUL37×1 co-isolation was monitored by PRM. Error bars denote SEM from measuring three unique peptides per protein. (C) Immunofluorescence microscopy images (z stack maximum projections) of infected human fibroblast cells co-labeled with four fluorescent probes: an antibody against endogenous RMDN3 (white), pUL37×1-GFP (green), MitoTracker (red), and DAPI (blue). Individual channels from a region of interest (white box) are shown below each merged image. Scale bars represent 10 μm. See also Table S4.
Figure 5.
Figure 5.. The Mitochondrial Intermembrane Space Bridging Complex Associates with pUL37×1 and Is Required for HCMV Infection
(A) Left: schematic of MICOS and SAMM50 complex proteins detected as specific pUL37×1 interactors. Right: relative temporal abundances of protein interactions between MIB complex members and pUL37×1, all assigned to cluster 4 by Inter-ViSTA. Protein colors correspond with the schematic at left. (B) Immunoblot of the IMMT reciprocal isolation at 96 hpi stained for GFP and IMMT, confirming pUL37×1 association. Arrowhead denotes pUL37×1 band; the asterisk denotes IgG heavy chain bands. (C) IP-PRM of the IMMT reciprocal isolation further confirmed the temporality of IMMT-pUL37×1 interactions. Left: an IgG control was used to confirm the specificity of the endogenous IP. Right: isolation of IMMT was done at five time points of infection, and the abundance of co-isolated pUL37×1 was monitored by PRM. Error bars denote SEM from three unique peptides per protein. (D) CRISPR-mediated knockout of CHCHD3 was validated by PRM (n = 6 unique peptides), leading to a mean ∼55% decrease in protein abundance (left). Viral titers from the CHCHD3 CRISPR and control cells (right: ***p ≤ 0.001, n = 3 biological replicates). Error bars represent SEM. (E) Interactions between pUL37×1 and integral mitochondrial membrane proteins are poised to regulate changes to mitochondrial structure during HCMV infection. See also Table S4.
Figure 6.
Figure 6.. pUL37×1 Preferentially Localizes to Fragmented, Rather Than Enlarged, Peroxisomes during HCMV Infection
(A) Left: relative abundances of pUL37×1 peroxisomal protein interactions, plotted across infection time. Right: protein levels of pUL37×1 peroxisomal interactors during infection, displayed as a fold change to the abundance at 24 hpi. In contrast to the changes in interaction levels, peroxisome proteins do not decrease in abundance at 120 hpi. PEX11β and MFF profiles are highlighted in darker color. (B) Immunofluorescence images (z stack maximum projections) across HCMV infection, showing pUL37×1-GFP (green), mitochondria (red, MitoTracker), peroxisomes (white, PEX14 antibody), and DAPI (blue). Channels from a region of interest (white box) are shown below each merged image with a 3D reconstruction. Purple arrows indicate peroxisomes co-localized with pUL37×1 puncta, distinct from mitochondria. Yellow arrowheads indicate enlarged peroxisomes devoid of pUL37×1. Scale bars represent 10 μm. (C) Colocalization quantification of data in (B) (n = 9 cells per time point), showing Pearson’s R values for pUL37×1 with peroxisomes (pink) or mitochondria (gray). Error bars denote SEM, and averages are indicated as text. (D) pUL37×1 localization as a function of peroxisome size, measured from data in (B) (n > 6,000 peroxisomes per time point). Mean pUL37×1 intensity perperoxisome is plotted as a fraction of the total for each time point. Error bars denote SEM. See also Videos S5 and S6.
Figure 7.
Figure 7.. Peroxisome Fragmentation during HCMV Infection Is Regulated by pUL37×1-Mediated Activation of PEX11β
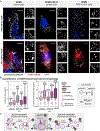
(A) Images of peroxisomes (white, antibody against PEX14) from control cells (left), PEX11β KO CRISPR cells (middle), and control cells infected with ΔUL37 virus (right), before and after infection with HCMV. Infection is confirmed with an antibody against pUL99 (red). The peroxisome channel from three regions of interest is below each merged image. Scale bars represent 10 μm. (B) For each condition in (A), peroxisome SA and SA:V was quantified (n > 20,000 peroxisomes in each condition). The SA:V schematic is shown to right, demonstrating the shift from spherical to flattened as the ratio increases. Box-and-whisker plots show whiskers at 10–90 percentiles, midline at median, and numerical value representing the mean. ***p < 0.001 compared to the wild-type mock-infected condition. (C) Proposed model for the function of pUL37×1-PEX11β and MFF interactions, whereby pUL37×1 binds and activates PEX11β to promote peroxisome fission, generating fragmented peroxisomes (1). Alternatively, pUL37×1 is excluded from peroxisome membranes, likely by a currently unidentified host or viral factor, to form the enlarged and irregular peroxisomes (2).

Similar articles

Cited by

References

    1. Alexa A, and Rahnenführer J. (2018). Gene set enrichment analysis with topGO.
    1. Alwine JC (2012). The human cytomegalovirus assembly compartment: a masterpiece of viral manipulation of cellular processes that facilitates assembly and egress. PLoS Pathog. 8, e1002878. - PMC - PubMed
    1. Bakalarski CE, Elias JE, Villén J, Haas W, Gerber SA, Everley PA, and Gygi SP (2008). The impact of peptide abundance and dynamic range on stable-isotope-based quantitative proteomic analyses. Journal of Proteome Research 7, 4756–4765. - PMC - PubMed
    1. Bekker-Jensen DB, Kelstrup CD, Batth TS, Larsen SC, Haldrup C, Bramsen JB, Sørensen KD, Høyer S, Ørntoft TF, Andersen CL, et al. (2017). An Optimized Shotgun Strategy for the Rapid Generation of Comprehensive Human Proteomes. Cell Syst. 4, 587–599. - PMC - PubMed
    1. Bender-deMoll S. (2016). Temporal network tools in statnet: networkDynamic, ndtv and tsna. https://statnet.org/Workshops/ndtv_workshop.html.

Publication types

MeSH terms

Substances