

Temporal association between particulate matter pollution and case fatality rate of COVID-19 in Wuhan
- PMID: 32678728
- PMCID: PMC7361083
- DOI: 10.1016/j.envres.2020.109941
Temporal association between particulate matter pollution and case fatality rate of COVID-19 in Wuhan
Abstract
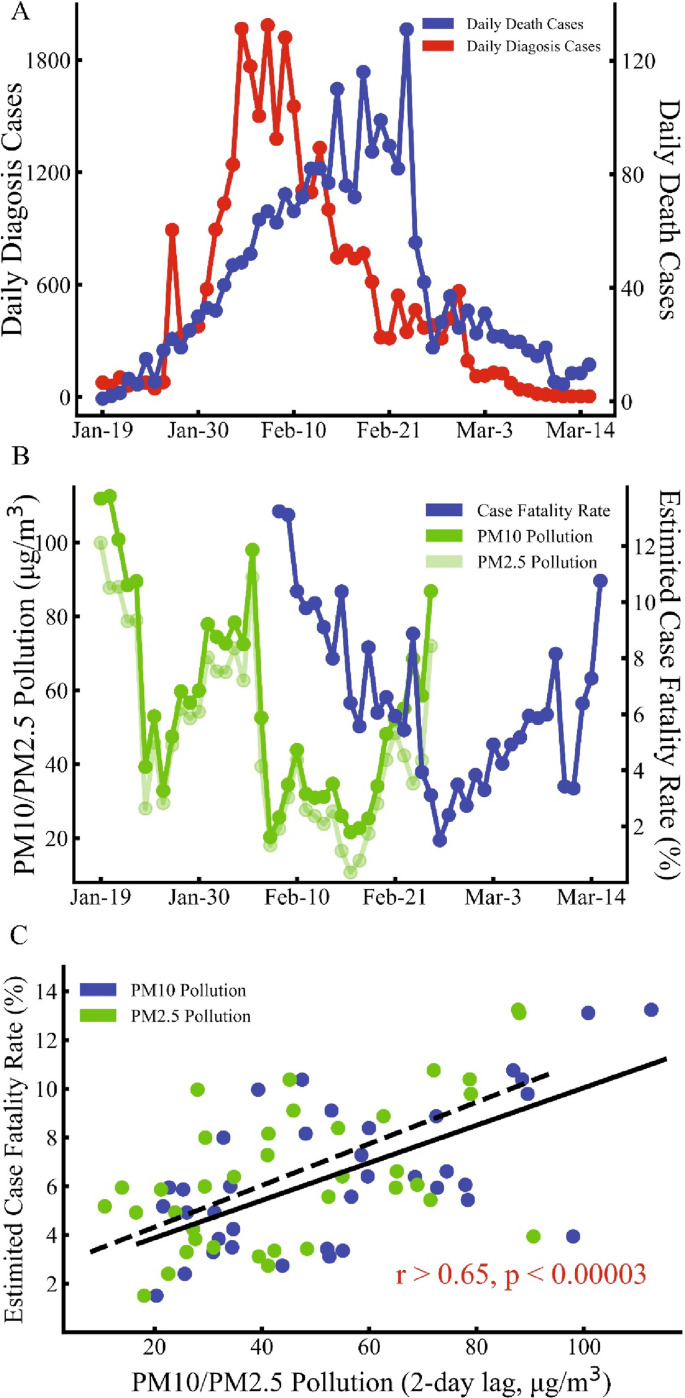
The coronavirus (COVID-19) epidemic reported for the first time in Wuhan, China at the end of 2019, which has caused 4648 deaths in China as of July 10, 2020. This study explored the temporal correlation between the case fatality rate (CFR) of COVID-19 and particulate matter (PM) in Wuhan. We conducted a time series analysis to examine the temporal day-by-day associations. We observed a higher CFR of COVID-19 with increasing concentrations of inhalable particulate matter (PM) with an aerodynamic diameter of 10 μm or less (PM10) and fine PM with an aerodynamic diameter of 2.5 μm or less (PM2.5) in the temporal scale. This association may affect patients with mild to severe disease progression and affect their prognosis.
Keywords: COVID-19; Case fatality rate; Particulate matter; Wuhan.
Copyright © 2020 Elsevier Inc. All rights reserved.
Conflict of interest statement
The authors declare no competing interests.
Figures
Similar articles
-
Association of particulate matter pollution and case fatality rate of COVID-19 in 49 Chinese cities.Sci Total Environ. 2020 Nov 1;741:140396. doi: 10.1016/j.scitotenv.2020.140396. Epub 2020 Jun 20. Sci Total Environ. 2020. PMID: 32592974 Free PMC article.
-
Assessing the relationship between surface levels of PM2.5 and PM10 particulate matter impact on COVID-19 in Milan, Italy.Sci Total Environ. 2020 Oct 10;738:139825. doi: 10.1016/j.scitotenv.2020.139825. Epub 2020 Jun 2. Sci Total Environ. 2020. PMID: 32512362 Free PMC article.
-
How Did Distribution Patterns of Particulate Matter Air Pollution (PM2.5 and PM10) Change in China during the COVID-19 Outbreak: A Spatiotemporal Investigation at Chinese City-Level.Int J Environ Res Public Health. 2020 Aug 28;17(17):6274. doi: 10.3390/ijerph17176274. Int J Environ Res Public Health. 2020. PMID: 32872261 Free PMC article.
-
Air pollution and COVID-19: Is the connect worth its weight?Indian J Public Health. 2020 Jun;64(Supplement):S132-S134. doi: 10.4103/ijph.IJPH_466_20. Indian J Public Health. 2020. PMID: 32496243 Review.
-
The role of air pollution (PM and NO2) in COVID-19 spread and lethality: A systematic review.Environ Res. 2020 Dec;191:110129. doi: 10.1016/j.envres.2020.110129. Epub 2020 Aug 24. Environ Res. 2020. PMID: 32853663 Free PMC article. Review.
Cited by
-
The Lancet Commission on lessons for the future from the COVID-19 pandemic.Lancet. 2022 Oct 8;400(10359):1224-1280. doi: 10.1016/S0140-6736(22)01585-9. Epub 2022 Sep 14. Lancet. 2022. PMID: 36115368 Free PMC article. Review. No abstract available.
-
The effect of COVID-19 pandemic on human mobility and ambient air quality around the world: A systematic review.Urban Clim. 2021 Jul;38:100888. doi: 10.1016/j.uclim.2021.100888. Epub 2021 Jun 18. Urban Clim. 2021. PMID: 36536793 Free PMC article. Review.
-
Risk Factors for Respiratory Viral Infections: A Spotlight on Climate Change and Air Pollution.J Asthma Allergy. 2023 Jan 25;16:183-194. doi: 10.2147/JAA.S364845. eCollection 2023. J Asthma Allergy. 2023. PMID: 36721739 Free PMC article. Review.
-
COVID-19 and Air Pollution: A Spatial Analysis of Particulate Matter Concentration and Pandemic-Associated Mortality in the US.Int J Environ Res Public Health. 2022 Jan 5;19(1):592. doi: 10.3390/ijerph19010592. Int J Environ Res Public Health. 2022. PMID: 35010846 Free PMC article.
-
Long-term exposure to fine particulate matter air pollution: An ecological study of its effect on COVID-19 cases and fatality in Germany.Environ Res. 2022 Mar;204(Pt A):111948. doi: 10.1016/j.envres.2021.111948. Epub 2021 Aug 28. Environ Res. 2022. PMID: 34464613 Free PMC article.
References
-
- EPA integrated science assessments (ISAs). https://www.epa.gov/isa.
Publication types
MeSH terms
Substances
LinkOut - more resources
Full Text Sources
Medical
