. 2020 Sep;21(9):1022-1033.
doi: 10.1038/s41590-020-0725-2. Epub 2020 Jul 13.

Impaired mitochondrial oxidative phosphorylation limits the self-renewal of T cells exposed to persistent antigen

Affiliations

Impaired mitochondrial oxidative phosphorylation limits the self-renewal of T cells exposed to persistent antigen

Santosha A Vardhana et al. Nat Immunol. 2020 Sep.

Abstract

The majority of tumor-infiltrating T cells exhibit a terminally exhausted phenotype, marked by a loss of self-renewal capacity. How repetitive antigenic stimulation impairs T cell self-renewal remains poorly defined. Here, we show that persistent antigenic stimulation impaired ADP-coupled oxidative phosphorylation. The resultant bioenergetic compromise blocked proliferation by limiting nucleotide triphosphate synthesis. Inhibition of mitochondrial oxidative phosphorylation in activated T cells was sufficient to suppress proliferation and upregulate genes linked to T cell exhaustion. Conversely, prevention of mitochondrial oxidative stress during chronic T cell stimulation allowed sustained T cell proliferation and induced genes associated with stem-like progenitor T cells. As a result, antioxidant treatment enhanced the anti-tumor efficacy of chronically stimulated T cells. These data reveal that loss of ATP production through oxidative phosphorylation limits T cell proliferation and effector function during chronic antigenic stimulation. Furthermore, treatments that maintain redox balance promote T cell self-renewal and enhance anti-tumor immunity.


Figures

Extended Data Fig. 1
Extended Data Fig. 1. Chronic T cell stimulation induces T cell exhaustion.
All experimental analyses were conducted eight days after initial stimulation unless otherwise specified. (a-c) Expression of inhibitory immunoreceptors (PD-1, LAG-3, PD-L1) and intracellular cytokine production (IFN-γ and TNF) in acutely and chronically stimulated T cells following re-stimulation with PMA and ionomycin. (d) Expression of Glut1 in acutely or chronically stimulated OT-I T cells with or without restimulation using bead-bound anti-CD3. Actin is used as a loading control. Experiment was repeated three times with similar results. Uncropped blot can be found within Source Data. (e) Gene set enrichment plot showing that genes associated with chronically stimulated polyclonal T cells in vitro are enriched for genes upregulated in exhausted CD8+ T cells (Texh) but not anergic T cells. (f) Killing of peptide-pulsed B16 cells. Luciferase-expressing B16 cells pulsed with Ova peptide at the indicated doses for 4 h were co-cultured with acutely or chronically stimulated T cells for 24 h. The following day, cells were lysed and luciferase expression was assessed using a luminometer. (g) Normalized isotopologue abundance of intracellular lactate in acutely and chronically stimulated T cells following 6 h of re-stimulation by plate-bound anti-CD3 in the presence of U-13C-Glucose. Abundance was normalized to cell number at the time of harvest. (h) Median lactate excreted per molecule of glucose consumed in acutely and chronically stimulated T cells following initial stimulation. P values were calculated by unpaired, two-sided Student’s t-test (f-h) relative to acutely stimulated T cells or based on 1,000 permutations by the GSEA algorithm and not adjusted for multiple comparisons (e). Data are presented as the mean ± s.d. of n=3 biologically independent samples from a representative experiment. **P<0.01.
Extended Data Fig. 2
Extended Data Fig. 2. Aerobic glycolysis is a hallmark of chronic stimulation-dependent terminal T cell dysfunction.
(a) Extracellular acidification rate of acutely and chronically stimulated polyclonal T cells in media containing or lacking glucose as indicated. (b) Extracellular acidification rate of acutely and chronically stimulated polyclonal T cells at baseline and in response to electron transport chain inhibition. (c) Population doublings of acutely and chronically stimulated polyclonal CD8+ T cells following initial stimulation. (d) Viability of acutely and chronically stimulated T cells as determined by forward scatter and DAPI exclusion. (e) Intracellular TOX expression and proliferation as measured by dilution of Cell Trace Violet fluorescence of acutely or chronically stimulated T cells. (f) Normalized expression of glycolytic genes in CD8+ T cell clusters from patients with basal and squamous cell carcinoma treated with immune checkpoint blockade. (g) Gene set enrichment plot showing that genes associated with terminally exhausted T cells isolated from murine B16 melanoma tumors are enriched for glycolytic genes. (h) Correlation of glycolysis score (left) and TCA cycle score (right) with TCF7 expression in exhausted CD8+ T cell clusters from basal and squamous cell carcinoma patients treated with immune checkpoint inhibitors. (i) Gene set enrichment plot showing that chronically stimulated OT-I T cells in vitro significantly downregulate genes upregulated in progenitor Texh as compared to terminal Texh. (j-k) Intracellular cytokine production in acutely and chronically stimulated polyclonal T cells following re-stimulation. In (j), cells were cultured in the presence or absence of anti-PD-L1 (10F.9G2) from D2-D8. In (k), “Chronic + 24h rest” cells were rested in the absence of plate-bound anti-CD3 for 24 h prior to re-stimulation. Experiment was repeated three times with similar results. P values were calculated by unpaired, two-sided Student’s t-test (a-c) relative to acutely stimulated T cells or based on 1,000 permutations by the GSEA algorithm and not adjusted for multiple comparisons (f-i). Data are presented as the mean ± s.d. of n=3 biologically independent samples from a representative experiment. ****P<0.0001.
Extended Data Fig. 3
Extended Data Fig. 3. Chronic antigen stimulation impairs mitochondrial oxidation and ATP production.
(a) Quantification of relative tricarboxylic acid cycle metabolite pool sizes in acutely and chronically stimulated T cells. Columns represent biological replicates for each condition. (b) Oxygen consumption rate (OCR) of acutely or chronically stimulated T cells at baseline or in the presence of ATP synthase inhibition (Oligo), uncoupling agents (FCCP), inhibition of glucose uptake (2-DG), and complex III/IV inhibition (Rot/AA). (c) Schematic depicting how oxidative metabolism of uniformly-labeled palmitate ([U-13C] palmitate) generates metabolites associated with the TCA cycle. Colored circles represent 13C-labeled carbons. (d) Fractional labeling by [U-13C] palmitate of citrate, glutamate, fumarate, malate and aspartate in acutely and chronically stimulated T cells following re-stimulation. (e) Proliferation of T cells acutely or chronically stimulated in the presence or absence of supplemental sodium acetate (5 mM), as measured by dilution of Cell Trace Violet fluorescence. (f) Quantification of pool sizes of metabolite intermediates in nucleotide synthesis in acutely and chronically stimulated T cells. Heatmap depicts pool size relative to row median. Columns represent biological replicates for each condition. Experiment was repeated two times with similar results. P values were calculated by unpaired, two-sided Student’s t-test (a,b,d). Data are presented as the mean ± s.d. of n=3 biologically independent samples from a representative experiment. **P<0.01. ****P<0.0001.
Extended Data Fig. 4
Extended Data Fig. 4. Oxidative stress limits T cell proliferative capacity.
(a) Western blot depicting overexpression of FLAG-tagged recombinant NADH oxidase enzymes LbNOX and MitoLbNOX in T cells. Experiment was repeated three times with similar results. Uncropped blot can be found within Source Data. (b) Fluorescence intensity of acutely and chronically stimulated T cells expressing vector control, LbNOX, or MitoLbNOX following eight days in culture after loading with CM-H2DCFDA. (c) Population doublings of acutely and chronically stimulated T cells expressing vector control, LbNOX, or MitoLbNOX. (d) Fluorescence intensity of acutely and chronically stimulated T cells after loading with BODIPY-C11 to measure lipid peroxidation. Light-grey-shaded peak represents negative control. (e) Fluorescence intensity of acutely or chronically stimulated T cells cultured with or without pharmacologic agents that impair ETC function following 2 days of initial stimulation. Cells were loaded with CM-H2DCFDA to measure ROS on D8 following initial stimulation. (f) qRT-PCR of Myb and Tcf7 in acutely or chronically stimulated T cells with or without the addition of the indicated agents for 6 days following 2 days of primary stimulation. (g-i) Expression of oxidative stress-related metabolic genes (“ROS score”) in tumor-infiltrating CD8+ T cells from basal and squamous cell carcinoma patients treated with immune checkpoint inhibitors. In (g), ROS score in independent CD8+ T cell clusters is shown. In (h), ROS score in exhausted and memory T cell populations is shown according to clone size as measured by TCR sequencing; box center line=median, box limits=upper and lower quartiles, box whiskers=1.58 x interquartile range. In (i), correlation of ROS score with TCF7 expression in exhausted CD8+ T cells is shown. Only cells with non-zero TCF7 expression were included. P values were calculated by one-way ANOVA with Sidak’s multiple comparisons post-test (g,i), or one-sided Student’s t-test relative to base mean (g-h). Data are presented as the mean ± s.d. of n=3 biologically independent samples from a representative experiment. **P<0.01. ***P<0.001. ****P<0.0001.
Extended Data Fig. 5
Extended Data Fig. 5. Endogenous antioxidant production is limiting for T cell proliferation.
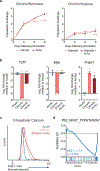
(a) Motif analysis of sites with increased accessibility in tumor-infiltrating CD8+ T cells (L7) as compared to T cells from Listeria-infected mice (E7) showing NFATc1 as among the motifs whose accessibility was most preferentially increased in L7 cells. (b) Intracellular calcium flux as measured by ratio of bound to unbound Indo-1-AM in acutely and chronically stimulated T cells, at baseline, in response to monomeric anti-CD3, and in response to receptor clustering (streptavidin). (c) Gene set enrichment plot showing that chronically stimulated OT-I T cells are enriched for NFAT target genes. (d) Expression of NFAT target genes (“nfat score”) in independent CD8+ T cell clusters. (e) Correlation of expression of NFAT target genes (“nfat score”) with expression of oxidative stress-related metabolic genes (“ROS score”) in tumor-infiltrating CD8+ T cells from melanoma patients treated with immune checkpoint inhibitors. (f) Fluorescence intensity of acutely and chronically stimulated T cells cultured with or without βME supplementation after loading with CM-H2DCFDA to measure ROS. Light-grey-shaded peak represents negative control. (g) Proliferation of T cells acutely stimulated in the presence or absence of BSO or diamide as measured by dilution of Cell Trace Violet fluorescence. (h) Expression of TCF-1 and TOX in chronically stimulated T cells cultured in the presence or absence of BSO. P values were calculated by one-sided Student’s t-test relative to base mean (d-e). ****P<0.0001
Extended Data Fig. 6
Extended Data Fig. 6. N-acetylcysteine reverses oxidative stress in chronically stimulated T cells.
(a) Quantification of relative metabolite pool sizes as measured by LC-MS in chronically stimulated T cells cultured with or without N-AC. Colored dots represent intermediates in glutathione synthesis as indicated. Dashed lines represent cutoffs of p < 0.01 and log2 fold change > 0.5. (b) ATP production by acutely or chronically stimulated T cells cultured with or without N-AC. P values were calculated by one-way ANOVA with Sidak’s multiple comparisons post-test compared to acutely stimulated T cells (b). Data are presented as the mean ± s.d. of n=4 biologically independent samples from a representative experiment (b). *P<0.05.
Extended Data Fig. 7
Extended Data Fig. 7. Antioxidants restore T cell self-renewal during chronic stimulation.
(a) Population doublings of chronically stimulated T cells with or without N-AC supplementation under normoxic (left) or hypoxic (right) conditions. Experiment was repeated two times with similar results. (b) qRT-PCR of Tcf, Myb, and Prdm1 in acutely or chronically stimulated T cells with or without the addition of N-AC as indicated. (c) Intracellular calcium flux as measured by ratio of bound to unbound Indo-1-AM in acutely and chronically stimulated T cells cultured with or without N-AC. (d) Gene set enrichment plot showing that the addition of N-AC during chronic stimulation reduces expression of NFAT target genes. P values were calculated by unpaired, two-sided Student’s t-test relative to cells cultured without N-AC (a), one-way ANOVA with Sidak’s multiple comparisons post-test (b) or based on 1,000 permutations by the GSEA algorithm and not adjusted for multiple comparisons (d). Data are presented as the mean ± s.d. of n=3 biologically independent samples from a representative experiment. *P<0.05. **P<0.01. ***P<0.0001.
Extended Data Fig. 8
Extended Data Fig. 8. Antioxidants reverse endogenous tumor-associated T cell dysfunction.
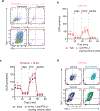
(a) Production of IFN-γ and TNF following re-stimulation with PMA and ionomycin in chronically stimulated T cells with or without N-AC supplementation under normoxic or hypoxic conditions. Experiment was repeated two times with similar results. (b-c) Oxygen consumption rate (OCR) of OT-I T cells chronically co-cultured with B16 melanoma cells with or without anti-PD-L1 antibodies and with or without N-AC supplementation at baseline or in the presence of ATP synthase inhibition (Oligo), uncoupling agents (FCCP), or complex III/IV inhibition (Rot/AA). (d) Production of IFN-γ and TNF following re-stimulation with PMA and ionomycin in chronically stimulated T cells with or without MitoTEMPO or Trolox supplementation as indicated. Experiment was repeated two times with similar results. P values were calculated by unpaired, two-sided Student’s t-test (c). Data are presented as the mean ± s.d. of n=4 biologically independent samples from a representative experiment (b-c). *P<0.05.
Extended Data Fig. 9
Extended Data Fig. 9. Gating strategy for fluorescence activated cell sorting analysis.
For both polyclonal and OT-I transgenic T cells, gating was perform as shown. First, doublet exclusion was performed on cells gated by FSC-H versus FSC-W. Then, doublet exclusion was performed on cells gated by SSC-H versus SSC-W. Viable cells were identified by FSC-A and Live/Dead Blue exclusion. Finally, CD8 positivity was assessed by fluorescence in the BV-786 channel.
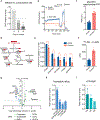
Figure 1.
Figure 1.. Aerobic glycolysis is a hallmark of terminally exhausted T cells.
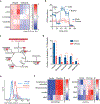
All experimental analyses were conducted eight days after initial stimulation unless otherwise specified. (a) PD-1 expression and TNF production by acutely and chronically stimulated T cells upon re-stimulation with PMA and ionomycin. Experiment was repeated three times with similar results. (b) Gene set enrichment plot showing that genes associated with chronically stimulated OT-I T cells in vitro are enriched for genes upregulated in exhausted CD8+ T cells but not anergic T cells. (c) Growth of B16-OVA xenografts. Tumor-bearing mice received no T cells or 1 million acutely or chronically stimulated OT-I T cells by adoptive transfer five days after tumor implantation. Tumor size at 14 days post-implantation is shown. (d-e) Median glucose consumed (d) and lactate excreted (e) in acutely and chronically stimulated T cells following initial stimulation. (f) Extracellular acidification rate (ECAR) of acutely and chronically stimulated polyclonal T cells at baseline, in response to re-stimulation (anti-CD3), or in the presence of ATP synthase inhibition (Oligo) or uncoupling agents (FCCP). (g) Population doublings of acutely and chronically stimulated OT-I T cells following initial stimulation. (h) Normalized expression of glycolytic genes in CD8+ T cell clusters from patients with melanoma treated with immune checkpoint blockade. (i) Gene set enrichment plot showing that chronically stimulated OT-I T cells in vitro are enriched for genes upregulated in terminal Texh as compared to progenitor Texh. (j) Flow cytometry plots of acutely and chronically stimulated T cells in vitro demonstrating suppression of TCF-1 and upregulation of TOX in chronically stimulated T cells. P values were calculated by unpaired, two-sided Student’s t-test (c-g) relative to acutely stimulated T cells, based on 1,000 permutations by the GSEA algorithm and not adjusted for multiple comparisons (b,i), or Wilcoxon two-sided rank sum test with Benjamini-Hochberg False Discovery Rate (FDR) correction (h). Data are presented as the mean ± s.d. of n=5 (c), n-4 (f) or n=3 (d,e,g) biologically independent samples from a representative experiment. **P<0.01, ****P<0.0001.
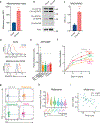
Figure 2.
Figure 2.. Chronic antigen stimulation induces mitochondrial dysfunction and limits nucleotide biosynthesis.
(a,b) Oxygen consumption rate (OCR) of acutely and chronically stimulated T cells after the indicated days in culture (a) and after 8 days of culture (b) at baseline, in response to re-stimulation (anti-CD3), or in the presence of ATP synthase inhibition (Oligo), uncoupling agents (FCCP), or complex III/IV inhibition (Rot/AA). (c) Ratio of glycolytic to mitochondrial ATP produced by acutely or chronically stimulated cells following re-stimulation with anti-CD3. (d) Schematic depicting how oxidative metabolism of [U-13C] glucose generates metabolites associated with the TCA cycle. Colored circles represent 13C-labeled carbons. (e) Fractional labeling by [U-13C] glucose of citrate, glutamate, fumarate, malate and aspartate in acutely and chronically stimulated T cells following re-stimulation. (f) Labeling of lipids by [U-14C] after 24 h of culture in acutely and chronically stimulated T cells beginning four days after initial stimulation. (g) Quantification of relative metabolite pool sizes in chronically stimulated T cells compared to acutely stimulated T cells. Colored dots represent nucleotides, nucleosides, and nucleoside catabolites as indicated. Dashed lines represent cutoffs of p < 0.01 and log2 fold change > 0.5. (h-i) Quantification of relative nucleotide ratios of chronically stimulated T cells. Dashed line indicates median ratio in acutely stimulated cells. P values were calculated by unpaired, two-sided Student’s t-test (a-c,e-f) or unpaired, two-sided Student’s t-test test with Benjamini-Hochberg False Discovery Rate (FDR) correction (g-i). Data are presented as the mean ± s.d. of n=5 (a), n=8 (a,c), n=4 (b), or n=3 (e,f,h,i) biologically independent samples from a representative experiment. *P<0.05, **P<0.01, ****P<0.0001.
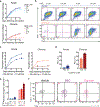
Figure 3.
Figure 3.. Inhibition of mitochondrial electron transport limits T cell proliferation.
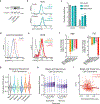
(a) Fluorescence intensity of acutely and chronically stimulated T cells after loading with MitoTracker Green to measure mitochondrial mass. (b) Western blot depicting electron transport chain complex expression in acutely and chronically stimulated T cells. Actin is used as a loading control. Western blot was performed two independent times. Uncropped blot can be found within Source Data. (c) NADH/ NAD+ ratio in acutely and chronically stimulated T cells. Cells were re-stimulated for 30 minutes with anti-CD3 and anti-CD28-coated magnetic beads prior to harvest. Levels were normalized to cell number from duplicate wells. (d) Fluorescence intensity of acutely and chronically stimulated T cells after loading with CM-H2DCFDA (above) or MitoSox Red (below). Light-grey-shaded peak represents negative control. (e) ATP/AMP ratios in acutely stimulated T cells cultured with or without the indicated agents following two days of initial stimulation. Dashed line represents median nucleotide ratios in vehicle-treated T cells. (f-g) Population doublings (f) and expression of TCF-1 and TOX (g) of acutely stimulated T cells with or without the addition of the indicated agents following two days of initial stimulation. (h,i) Expression of oxidative stress-related metabolic genes (“ROS score”) in tumor-infiltrating CD8+ T cell clusters (h) and correlation of ROS score with Tcf7 expression in terminally exhausted CD8+ T cell clusters (i) from melanoma patients treated with immune checkpoint inhibitors. P values were calculated by unpaired, two-sided Student’s t-test (a,c), Wilcoxon two-sided rank sum test with Benjamini-Hochberg False Discovery Rate (FDR) correction (h), one-way ANOVA with Sidak’s multiple comparisons post-test (e-f), or based on 1,000 permutations by the GSEA algorithm and not adjusted for multiple comparisons (i). Data are presented as the mean ± s.d. of n=3 (a,e,f) or n=5 (c) biologically independent samples from a representative experiment. **P<0.01, ****P<0.0001.
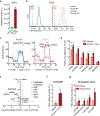
Figure 4.
Figure 4.. Endogenous antioxidants are required for T cell proliferation.
(a) Effects of β-mercaptoethanol (βME) supplementation on T cell proliferation during acute (upper panel) and chronic (lower panel) stimulation. (b) Effects of βME supplementation on intracellular accumulation of IFN-γ and TNF following re-stimulation with PMA and ionomycin of acutely and chronically stimulated T cells. (c) Effects of extracellular cysteine availability on T cell proliferation during acute (left) and chronic (right) stimulation. (d) Effects of extracellular cysteine availability on PD-1 expression as measured by flow cytometry following re-stimulation with PMA and ionomycin of acutely and chronically stimulated T cells. (e) Quantification of clonogenic B16 cells following 24 h of co-culture with acutely or chronically stimulated OT-I T cells in media containing nutrients at the indicated concentrations. (f) Expression of TCF-1 and TOX of acutely stimulated T cells with or without the addition of BSO or diamide following two days of initial stimulation. P values were calculated by or one-way ANOVA with Sidak’s multiple comparisons post-test (a,e) or unpaired, two-sided Student’s t-test (c-d). Data are presented as the mean ± s.d. of n=3 biologically independent samples from a representative experiment. *P<0.05, **P<0.01, ****P<0.0001.
Figure 5.
Figure 5.. Antioxidants reverse metabolic T cell dysfunction.
(a) Quantification of reduced glutathione pool sizes in chronically stimulated T cells with or without N-AC supplementation as measured by LC-MS. (b) Fluorescence intensity of acutely and chronically stimulated T cells cultured with or without N-AC after loading with CM-H2DCFDA to measure ROS. Light-grey-shaded peak represents negative control. Geometric mean fluorescence intensity of peaks shown in upper right corner. (c) Oxygen consumption rate (OCR) of T cells cultured with or without N-AC during acute (left) or chronic (right) stimulation at baseline or in the presence of ATP synthase inhibition (Oligo), uncoupling agents (FCCP), or complex III/IV inhibition (Rot/AA). (d) Fractional labeling by [U-13C] glucose of citrate, aconitate, α-KG, glutamate, malate and aspartate in T cells cultured with or without N-AC during chronic stimulation. (e) Quantification of relative metabolite pool sizes in chronically stimulated T cells with or without N-AC supplementation. Colored dots represent nucleotides, nucleosides, and nucleoside catabolites as indicated. Dashed lines represent cutoffs of p < 0.01 and log2 fold change > 0.5. (f,g) Quantification of relative nucleotide ratios in chronically stimulated T cells with or without N-AC supplementation. Dashed line indicates median ratio in acutely stimulated cells. P values were calculated by unpaired, two-sided Student’s t-test (a,d), unpaired, two-sided Student’s t-test test with Benjamini-Hochberg False Discovery Rate (FDR) correction (e-g) or one-way ANOVA with Sidak’s multiple comparisons post-test relative to acutely stimulated cells (c) or chronically stimulated cells without N-AC (a,c-g). Data are presented as the mean ± s.d. of n=3 (a,d,f,g) or n=4 (c) biologically independent samples from a representative experiment. *P<0.05, ****P<0.0001.
Figure 6.
Figure 6.. Antioxidants restore the proliferation and self-renewal of chronically stimulated T cells.
(a) Population doublings of acutely (above) and chronically (below) stimulated T cells in media with or without the addition of N-AC as indicated. (b) Principal component analysis of RNA-sequencing of T cells acutely or chronically stimulated with or without N-AC during chronic stimulation. Bar graphs depict genes significantly contributing to variance. (c) Expression of TCF-1 and TOX in acutely or chronically stimulated T cells with or without N-AC during chronic stimulation as indicated. (d) Gene set enrichment plot showing that chronically stimulated T cells cultured in the presence of N-AC are significantly enriched for genes associated with progenitor Texh (left) and significantly depleted of genes associated with terminal Texh (right). P values were calculated by unpaired, two-sided Student’s t-test (a) or based on 1,000 permutations by the GSEA algorithm and not adjusted for multiple comparisons (d). Data are presented as the mean ± s.d. of n=3 biologically independent samples from a representative experiment. ****P<0.0001.
Figure 7.
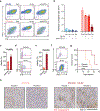
Figure 7.. Antioxidants reverse chronic stimulation-driven loss of T cell effector function.
(a) Intracellular accumulation of IFN-γ and TNF following re-stimulation with PMA and ionomycin of T cells following acute or chronic stimulation in the presence or absence of N-AC or anti-PD-L1 as indicated. (b) Quantification of clonogenic B16 cells following 24 h of co-culture with acutely or chronically stimulated OT-I T cells that had been treated with N-AC or anti-PD-L1 throughout the co-culture period. (c-d) Viability (c) and intracellular production of IFN-γ and TNF (d) of CD8+ T cells isolated from EL4 tumors 3 days after re-stimulation in the presence or absence of N-AC. (e-f) Viability (e) and production of IFN-γ and TNF (f) by CAR-T cells 3 days after re-stimulation in the presence or absence of N-AC. (g) Kaplan-Meier curve showing survival of B16-ova-bearing recipient mice following adoptive transfer of OT-I T cells that had been chronically stimulated in the presence or absence of N-AC. All mice received anti-PD-L1 therapy twice weekly. (h) Immunohistochemistry showing enhanced Granzyme B expression in tumor-infiltrating T cells treated with N-AC. Staining of tumors extracted from two individual mice are shown. P values were calculated by one-way ANOVA with Sidak’s multiple comparisons post-test (b), unpaired, two-sided Student’s t-test (c,e) or log-rank (Mantel-Cox) test (g) relative to vehicle-treated cells. Data are presented as the mean ± s.d. of n=3 biologically independent samples or n=5 independent mice (g) from a representative experiment. *P<0.05, ****P<0.0001.

Comment in

Similar articles

Cited by

References

    1. Hanahan D & Weinberg RA Hallmarks of cancer: the next generation. Cell 144, 646–674 (2011). - PubMed
    1. Wherry EJ & Kurachi M Molecular and cellular insights into T cell exhaustion. Nat Rev Immunol 15, 486–499 (2015). - PMC - PubMed
    1. Ribas A & Wolchok JD Cancer immunotherapy using checkpoint blockade. Science 359, 1350–1355 (2018). - PMC - PubMed
    1. Siddiqui I et al. Intratumoral Tcf1(+)PD-1(+)CD8(+) T Cells with Stem-like Properties Promote Tumor Control in Response to Vaccination and Checkpoint Blockade Immunotherapy. Immunity 50, 195–211 e110 (2019). - PubMed
    1. Kurtulus S et al. Checkpoint Blockade Immunotherapy Induces Dynamic Changes in PD-1(−)CD8(+) Tumor-Infiltrating T Cells. Immunity 50, 181–194 e186 (2019). - PMC - PubMed

Methods-only references

    1. Naviaux RK, Costanzi E, Haas M & Verma IM The pCL vector system: rapid production of helper-free, high-titer, recombinant retroviruses. J Virol 70, 5701–5705 (1996). - PMC - PubMed
    1. Anders S et al. Count-based differential expression analysis of RNA sequencing data using R and Bioconductor. Nature protocols 8, 1765–1786 (2013). - PubMed
    1. Subramanian A et al. Gene set enrichment analysis: a knowledge-based approach for interpreting genome-wide expression profiles. Proceedings of the National Academy of Sciences of the United States of America 102, 15545–15550 (2005). - PMC - PubMed
    1. Butler A, Hoffman P, Smibert P, Papalexi E & Satija R Integrating single-cell transcriptomic data across different conditions, technologies, and species. Nat Biotechnol 36, 411–420 (2018). - PMC - PubMed
    1. Liberzon A et al. The Molecular Signatures Database (MSigDB) hallmark gene set collection. Cell Syst 1, 417–425 (2015). - PMC - PubMed

Publication types