Immunophenotyping of COVID-19 and influenza highlights the role of type I interferons in development of severe COVID-19
- PMID: 32651212
- PMCID: PMC7402635
- DOI: 10.1126/sciimmunol.abd1554
Immunophenotyping of COVID-19 and influenza highlights the role of type I interferons in development of severe COVID-19
Abstract
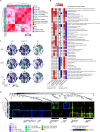
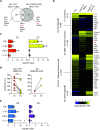
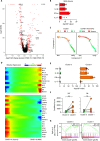
Although most SARS-CoV-2-infected individuals experience mild coronavirus disease 2019 (COVID-19), some patients suffer from severe COVID-19, which is accompanied by acute respiratory distress syndrome and systemic inflammation. To identify factors driving severe progression of COVID-19, we performed single-cell RNA-seq using peripheral blood mononuclear cells (PBMCs) obtained from healthy donors, patients with mild or severe COVID-19, and patients with severe influenza. Patients with COVID-19 exhibited hyper-inflammatory signatures across all types of cells among PBMCs, particularly up-regulation of the TNF/IL-1β-driven inflammatory response as compared to severe influenza. In classical monocytes from patients with severe COVID-19, type I IFN response co-existed with the TNF/IL-1β-driven inflammation, and this was not seen in patients with milder COVID-19. Interestingly, we documented type I IFN-driven inflammatory features in patients with severe influenza as well. Based on this, we propose that the type I IFN response plays a pivotal role in exacerbating inflammation in severe COVID-19.
Copyright © , American Association for the Advancement of Science.
Figures


Similar articles
-
Single-cell landscape of immunological responses in patients with COVID-19.Nat Immunol. 2020 Sep;21(9):1107-1118. doi: 10.1038/s41590-020-0762-x. Epub 2020 Aug 12. Nat Immunol. 2020. PMID: 32788748
-
Influenza immunization and COVID-19.Vaccine. 2020 Sep 3;38(39):6078-6079. doi: 10.1016/j.vaccine.2020.07.058. Epub 2020 Jul 29. Vaccine. 2020. PMID: 32773245 Free PMC article. No abstract available.
-
Re-analysis of Single Cell Transcriptome Reveals That the NR3C1-CXCL8-Neutrophil Axis Determines the Severity of COVID-19.Front Immunol. 2020 Aug 28;11:2145. doi: 10.3389/fimmu.2020.02145. eCollection 2020. Front Immunol. 2020. PMID: 32983174 Free PMC article.
-
From Influenza Virus to Novel Corona Virus (SARS-CoV-2)-The Contribution of Obesity.Front Endocrinol (Lausanne). 2020 Oct 6;11:556962. doi: 10.3389/fendo.2020.556962. eCollection 2020. Front Endocrinol (Lausanne). 2020. PMID: 33123087 Free PMC article. Review.
-
SARS-CoV-2 and influenza: a comparative overview and treatment implications.Bol Med Hosp Infant Mex. 2020;77(5):262-273. doi: 10.24875/BMHIM.20000183. Bol Med Hosp Infant Mex. 2020. PMID: 33064680 Review. English.
Cited by
-
Immune profiling of COVID-19: preliminary findings and implications for the pandemic.J Immunother Cancer. 2021 May;9(5):e002550. doi: 10.1136/jitc-2021-002550. J Immunother Cancer. 2021. PMID: 33963016 Free PMC article. Review.
-
A differential regulatory T cell signature distinguishes the immune landscape of COVID-19 hospitalized patients from those hospitalized with other respiratory viral infections.medRxiv [Preprint]. 2021 Mar 26:2021.03.25.21254376. doi: 10.1101/2021.03.25.21254376. medRxiv. 2021. Update in: Sci Adv. 2021 Nov 12;7(46):eabj0274. doi: 10.1126/sciadv.abj0274. PMID: 33791720 Free PMC article. Updated. Preprint.
-
Integrating longitudinal clinical laboratory tests with targeted proteomic and transcriptomic analyses reveal the landscape of host responses in COVID-19.Cell Discov. 2021 Jun 8;7(1):42. doi: 10.1038/s41421-021-00274-1. Cell Discov. 2021. PMID: 34103487 Free PMC article.
-
Comparable bidirectional neutrophil immune dysregulation between Kawasaki disease and severe COVID-19.Front Immunol. 2022 Sep 8;13:995886. doi: 10.3389/fimmu.2022.995886. eCollection 2022. Front Immunol. 2022. PMID: 36159873 Free PMC article.
-
COVID-19 and the potential of Janus family kinase (JAK) pathway inhibition: A novel treatment strategy.Front Med (Lausanne). 2022 Aug 30;9:961027. doi: 10.3389/fmed.2022.961027. eCollection 2022. Front Med (Lausanne). 2022. PMID: 36111104 Free PMC article. Review.
References
-
- Wu F., Zhao S., Yu B., Chen Y. M., Wang W., Song Z. G., Hu Y., Tao Z. W., Tian J. H., Pei Y. Y., Yuan M. L., Zhang Y. L., Dai F. H., Liu Y., Wang Q. M., Zheng J. J., Xu L., Holmes E. C., Zhang Y. Z., A new coronavirus associated with human respiratory disease in China. Nature 579, 265–269 (2020). 10.1038/s41586-020-2008-3 - DOI - PMC - PubMed
-
- Zhu N., Zhang D., Wang W., Li X., Yang B., Song J., Zhao X., Huang B., Shi W., Lu R., Niu P., Zhan F., Ma X., Wang D., Xu W., Wu G., Gao G. F., Tan W.; China Novel Coronavirus Investigating and Research Team , A Novel Coronavirus from Patients with Pneumonia in China, 2019. N. Engl. J. Med. 382, 727–733 (2020). 10.1056/NEJMoa2001017 - DOI - PMC - PubMed
-
- World Health Organization, Coronavirus disease 2019 (COVID-19) Situation Report –134, June 2, 2020; https://www.who.int/docs/default-source/coronaviruse/situation-reports/2... (2020).
-
- Guan W. J., Ni Z. Y., Hu Y., Liang W. H., Ou C. Q., He J. X., Liu L., Shan H., Lei C. L., Hui D. S. C., Du B., Li L. J., Zeng G., Yuen K. Y., Chen R. C., Tang C. L., Wang T., Chen P. Y., Xiang J., Li S. Y., Wang J. L., Liang Z. J., Peng Y. X., Wei L., Liu Y., Hu Y. H., Peng P., Wang J. M., Liu J. Y., Chen Z., Li G., Zheng Z. J., Qiu S. Q., Luo J., Ye C. J., Zhu S. Y., Zhong N. S.; China Medical Treatment Expert Group for Covid-19 , Clinical Characteristics of Coronavirus Disease 2019 in China. N. Engl. J. Med. 382, 1708–1720 (2020). 10.1056/NEJMoa2002032 - DOI - PMC - PubMed
MeSH terms
Substances
LinkOut - more resources
Full Text Sources
Other Literature Sources
Medical
Molecular Biology Databases
Miscellaneous

