Longitudinal Cytokine Profiling Identifies GRO-α and EGF as Potential Biomarkers of Disease Progression in Essential Thrombocythemia
- PMID: 32647796
- PMCID: PMC7306314
- DOI: 10.1097/HS9.0000000000000371
Longitudinal Cytokine Profiling Identifies GRO-α and EGF as Potential Biomarkers of Disease Progression in Essential Thrombocythemia
Abstract
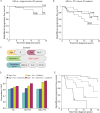
Myeloproliferative neoplasms (MPNs) are characterized by deregulation of mature blood cell production and increased risk of myelofibrosis (MF) and leukemic transformation. Numerous driver mutations have been identified but substantial disease heterogeneity remains unexplained, implying the involvement of additional as yet unidentified factors. The inflammatory microenvironment has recently attracted attention as a crucial factor in MPN biology, in particular whether inflammatory cytokines and chemokines contribute to disease establishment or progression. Here we present a large-scale study of serum cytokine profiles in more than 400 MPN patients and identify an essential thrombocythemia (ET)-specific inflammatory cytokine signature consisting of Eotaxin, GRO-α, and EGF. Levels of 2 of these markers (GRO-α and EGF) in ET patients were associated with disease transformation in initial sample collection (GRO-α) or longitudinal sampling (EGF). In ET patients with extensive genomic profiling data (n = 183) cytokine levels added significant prognostic value for predicting transformation from ET to MF. Furthermore, CD56+CD14+ pro-inflammatory monocytes were identified as a novel source of increased GRO-α levels. These data implicate the immune cell microenvironment as a significant player in ET disease evolution and illustrate the utility of cytokines as potential biomarkers for reaching beyond genomic classification for disease stratification and monitoring.
Copyright © 2020 the Author(s). Published by Wolters Kluwer Health, Inc. on behalf of the European Hematology Association.
Figures


Similar articles
-
Cytokine Consistency Between Bone Marrow and Peripheral Blood in Patients With Philadelphia-Negative Myeloproliferative Neoplasms.Front Med (Lausanne). 2021 Jun 24;8:598182. doi: 10.3389/fmed.2021.598182. eCollection 2021. Front Med (Lausanne). 2021. PMID: 34249954 Free PMC article.
-
Recent advances in understanding myelofibrosis and essential thrombocythemia.F1000Res. 2016 Apr 19;5:F1000 Faculty Rev-700. doi: 10.12688/f1000research.8081.1. eCollection 2016. F1000Res. 2016. PMID: 27134742 Free PMC article. Review.
-
Mutational landscape of blast phase myeloproliferative neoplasms (MPN-BP) and antecedent MPN.Int Rev Cell Mol Biol. 2022;366:83-124. doi: 10.1016/bs.ircmb.2021.02.008. Epub 2021 Dec 14. Int Rev Cell Mol Biol. 2022. PMID: 35153007
-
Inflammatory Pathophysiology as a Contributor to Myeloproliferative Neoplasms.Front Immunol. 2021 Jun 1;12:683401. doi: 10.3389/fimmu.2021.683401. eCollection 2021. Front Immunol. 2021. PMID: 34140953 Free PMC article. Review.
-
Molecular Genetic Profile of Myelofibrosis: Implications in the Diagnosis, Prognosis, and Treatment Advancements.Cancers (Basel). 2024 Jan 25;16(3):514. doi: 10.3390/cancers16030514. Cancers (Basel). 2024. PMID: 38339265 Free PMC article. Review.
Cited by
-
CXCR4-enriched T regulatory cells preferentially home to bone marrow and resolve inflammation.iScience. 2024 Aug 27;27(9):110830. doi: 10.1016/j.isci.2024.110830. eCollection 2024 Sep 20. iScience. 2024. PMID: 39314243 Free PMC article.
-
Cardiovascular Risk in Philadelphia-Negative Myeloproliferative Neoplasms: Mechanisms and Implications-A Narrative Review.Curr Issues Mol Biol. 2024 Aug 2;46(8):8407-8423. doi: 10.3390/cimb46080496. Curr Issues Mol Biol. 2024. PMID: 39194713 Free PMC article. Review.
-
C-Mannosyl tryptophan is a novel biomarker for thrombocytosis of myeloproliferative neoplasms.Sci Rep. 2024 Aug 14;14(1):18858. doi: 10.1038/s41598-024-69496-z. Sci Rep. 2024. PMID: 39143127 Free PMC article.
-
Interleukin-1β, JAK2V617F mutation and inflammation in MPNs.Blood Adv. 2024 Aug 27;8(16):4344-4347. doi: 10.1182/bloodadvances.2024013528. Blood Adv. 2024. PMID: 38985205 Free PMC article. No abstract available.
-
Associations of the circulating levels of cytokines with the risk of myeloproliferative neoplasms: a bidirectional mendelian-randomization study.BMC Cancer. 2024 Apr 26;24(1):531. doi: 10.1186/s12885-024-12301-x. BMC Cancer. 2024. PMID: 38671390 Free PMC article.
References
-
- Arranz L, Sánchez-Aguilera A, Martín-Pérez D, et al. Neuropathy of haematopoietic stem cell niche is essential for myeloproliferative neoplasms. Nature. 2014;512:78–81. - PubMed
Grants and funding
LinkOut - more resources
Full Text Sources
Research Materials
