. 2020 Jul 8;12(551):eaax2220.
doi: 10.1126/scitranslmed.aax2220.

Gut microbiota dysbiosis and altered tryptophan catabolism contribute to autoimmunity in lupus-susceptible mice

Affiliations

Gut microbiota dysbiosis and altered tryptophan catabolism contribute to autoimmunity in lupus-susceptible mice

Seung-Chul Choi et al. Sci Transl Med. .

Abstract

The autoimmune disease systemic lupus erythematosus (SLE) is characterized by the production of pathogenic autoantibodies. It has been postulated that gut microbial dysbiosis may be one of the mechanisms involved in SLE pathogenesis. Here, we demonstrate that the dysbiotic gut microbiota of triple congenic (TC) lupus-prone mice (B6.Sle1.Sle2.Sle3) stimulated the production of autoantibodies and activated immune cells when transferred into germfree congenic C57BL/6 (B6) mice. Fecal transfer to B6 mice induced autoimmune phenotypes only when the TC donor mice exhibited autoimmunity. Autoimmune pathogenesis was mitigated by horizontal transfer of the gut microbiota between co-housed lupus-prone TC mice and control congenic B6 mice. Metabolomic screening identified an altered distribution of tryptophan metabolites in the feces of TC mice including an increase in kynurenine, which was alleviated after antibiotic treatment. Low dietary tryptophan prevented autoimmune pathology in TC mice, whereas high dietary tryptophan exacerbated disease. Reducing dietary tryptophan altered gut microbial taxa in both lupus-prone TC mice and control B6 mice. Consequently, fecal transfer from TC mice fed a high tryptophan diet, but not a low tryptophan diet, induced autoimmune phenotypes in germfree B6 mice. The interplay of gut microbial dysbiosis, tryptophan metabolism and host genetic susceptibility in lupus-prone mice suggest that aberrant tryptophan metabolism may contribute to autoimmune activation in this disease.


Conflict of interest statement

Competing interests: All authors have no competing interests.

Figures

Fig. 1.
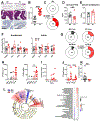
Fig. 1.. TC mice show gut inflammation but limited bacterial translocation from the gut to the periphery.
(A) Shown are representative whole colon sections (top panels, scale bars, 7 mm) and proximal colon sections () stained with H&E (middle panels, scale bars 300 μm) and with anti-CD45 antibody (bottom panels, scale bars 300 μm) from) from B6 and TC mice. (B) Colon pathology scores, ranked from 1 for the mice with the lowest inflammation to 29 for the mice the highest inflammation, with medians are shown. (C) Shown is the frequency of fecal blood in B6 and TC feces (sample size is indicated in center). (D) Shown is serum FITC-dextran in B6 and TC mice after gavage of animals with FITC-dextran to detect gut barrier integrity. (E) Shown are serum endotoxin concentrations in TC and B6 mice. (F) Expression of tight junction genes (Cldn2, Zo-1, Ocln, Jam) in the duodenum and colon of TC and B6 mice are shown. (G) The frequency of TC and B6 mouse liver and mesenteric lymph node (MLN) cultures that were positive for bacteria are presented. (H) CFU counts in liver and mesenteric lymph node cultures from B6 and TC mice, either at 2-5 months (young, Y) or 6-8 (older, O) months of age are shown. The sample size for each column is indicated. (I) Shown is a Pearson’s correlation between the frequency of splenic Tfh cells and the sum of liver and mesenteric lymph node CFUs (Pearson’s correlation R2 = 0.02, p = 0.58). (J) CFU numbers in TC liver and mesenteric lymph node cultures that were negative or positive for Staphylococcus xylosus (Sx − or Sx +, respectively) are shown. (K) S. xylosus operational taxonomic unit (OTU) counts in 16S rDNA sequences in B6 and TC mouse feces. (L) Bacterial 16S rDNA sequences in B6 and TC mouse feces are depicted. On the left, the taxonomic cladogram shows the phylogenetic distribution of differentially enriched taxa between the two mouse strains. Fecal mouse B6-enriched taxa are shown in blue and fecal mouse TC-enriched taxa are shown in red. On the right, a bubble plot of linear discriminant analysis (LDA) scores reveals the most differentially abundant taxa between the two mouse strains. Only taxa meeting the criteria (LDA score > 2 and p < 0.05) are shown. Fecal B6-enriched taxa are represented with positive LDA scores and fecal TC-enriched taxa with negative LDA scores. Data analyzed were from 2 independent experiments. Mice were 6 - 12-months old, except in (H). Statistical analysis for panels B-K: Each symbol represents a mouse; bars show means and standard error of the mean (SEM). Statistical tests used were Mann-Whitney tests in panels B,D,E and J, Fisher’s exact test in panels C and G, and t test in panel F. * P < 0.05, ** P < 0.01, *** P < 0.001.
Fig. 2.
Fig. 2.. Fecal microbiota contributes to autoimmune activation in TC mice.
GF B6 mice were gavaged with feces from anti-dsDNA IgG-positive TC mice, age-matched B6 mice, or were gavaged with PBS (Ctrl). Immune phenotypes were evaluated 4 weeks later. Serum anti-dsDNA IgG (A) and IgM (B), total IgG (C) and anti-nuclear autoantibodies (ANA) were quantified by anti-IgG by FITC staining (mean fluorescence intensity, MFI) with representative images (20X magnification) of cells stained with B6 or TC sera shown on the left (D). (E) Fecal and serum IgA was measured in GF mice gavaged with feces from B6 or TC mice (left axes) or in the B6 and TC mice used as fecal donors (right axes). (F) Representative B220 and CD3 staining in sections of colonic lymphoid tissue from B6 and TC mice are shown (scale bars, 200 μm). Number of lymphoid foci per colon is shown for6 mice for the B6 and TCTC strain from two separate cohorts; surface area of individual foci (min-max boxes with median) is presented (n = 20 B6, n=57 TC). Numbers of germinal center B cells (G) and plasma cells (H) are shown in mesenteric lymph nodes of B6 and TC mice. (I) Numbers and frequencies of mesenteric lymph node Tfh cells, as well as ratio of Tfr / Tfh cells is shown for B6 and TC mice. Data are presented as means and SEM of data pooled from three cohorts undergoing fecal transfer, with each symbol representing one mouse, except in (F). Comparisons were done using t tests, except for panel F where a Mann-Whitney test was used. * P < 0.05, ** P < 0.01, *** P < 0.001.
Fig. 3.
Fig. 3.. Horizontal transmission reveals interactions between lupus susceptibility genes and the gut microbiota of TC mice.
B6 and TC mice were housed from weaning either with littermates (shown as B6 and TC on the graphs) or with age-matched mice from the other strain (cohoused, shown as CoH on the graphs). Immune phenotypes were analyzed in 7-month-old B6 or TC mice. (A) Shown is the concentration in arbitrary units of serums anti-dsDNA IgG in control or cohoused B6 and TC mice. (B) Frequency of nuclear localization of anti-nuclear autoantibody staining in the sera of cohoused and control TC mice is shown; the sample size is shown in the middle. Representative images (20X magnification) of nuclear and cytoplasmic staining by a control TC and a cohouse TC serum are on the right. Shown are renal (D) and colon (E) pathology ranks, as well as correlation between the two (F), for control and cohoused B6 and TC mice. (G) Numbers of splenic plasma cells for control and cohoused B6 and TC mice are shown. Frequencies of splenic CD69+CD4+ T cells (H), and CD62LCD44+ Tem cells (I) are shown for control and cohoused B6 and TC mice. (J) Splenic Tfr/Tfh ratio is shown for control and cohoused B6 and TC mice. Data are means and SEM pooled from three cohorts, with each symbol representing one mouse (D-F). For simplicity, comparisons between control B6 and TC mouse results are not shown (all p < 0.05). Comparisons between cohoused B6 and TC mouse groups were done with t tests (* P < 0.05, ** P < 0.01, *** P < 0.001), Fisher exact test (B), Pearson r correlation test (F); and analysis of variance, vvv P < 0.001 (G). (K) Heatmap of differentially expressed fecal metabolites between cohoused B6 and TC mice was analyzed comparing strains regardless of housing conditions. Each column represents one mouse. (L) Enriched KEGG pathways in fecal metabolites between TC and B6 mice are shown with the p values and the number of metabolites represented in each pathway. The size of each bubble represents the number of metabolites differentially expressed for each pathway with a scale on the lower right (set size).
Fig. 4.
Fig. 4.. Tryptophan metabolism modulates autoimmune phenotypes in TC mice.
(A) Concentrations of tryptophan (Trp), kynurenine (Kyn) and serotonin (5HT) in feces and serum of 6-month-old B6 and TC mice are shown. (B) Shown is the quantitation of (F) fecal tryptophan, (S) serum kynurenine and the kynurenine/serotonin ratio in B6 and TC mice treated with antibiotic combination therapy (ampicillin, metronidazole, neomycin and vancomycin, AMNV) for 5 months or untreated. (C) Body weight loss of B6 and TC mice fed with tryptophan-deficient chow is shown (n = 5 per group). Shown are serum anti-dsDNA IgG concentrations in arbitrary units in TC mice fed chow with the indicated amount of tryptophan (%) after 4 months of treatment (D) and as a time-course during the treatment (E). (F) Correlation between serum kynurenine and anti-dsDNA IgG concentration in TC and B6 mice fed with chow containing 0.08 to 1.19 % tryptophan (n = 3 -- 5/group). (G) Renal pathology indicated as glomerulonephritis (GN) ranked scores from the lowest at 1 to the most severe at 24 in TC mice fed with variable amounts of tryptophan in their chow is shown. Frequencies of CD69+CD4+ cells (H), Ki67+ TAct cells (I), Tfh cells (J) and Ki67+ Tfh cells (K) in spleen are shown. (L) Shown is proliferation of effector T cells in vitro in the presence of Treg cells isolated from TC mice fed chow with different amounts of tryptophan (0.08%, low, or1.19% high) n = 6/group). (M) Shown is the frequency of splenic germinal center B cells of TC mice fed chow with the indicated amounts of tryptophan (n = 5-10/group). Data are presented as means and SEM and are compared with Dunnetťs multiple comparison tests (panels A, B, D G-K), 2-way ANOVA (C and E), Pearson’s correlation (F and L), or Fisher Exact test (G). In panel D, medians are compared with the Mann-Whitney Test. * P < 0.05, ** P < 0.01, *** P < 0.001.
Fig. 5.
Fig. 5.. Dietary tryptophan impacts TC gut microbiota composition and diversity.
16S rDNA sequence analyses of fecal bacteria from B6 and TC mice fed tryptophan high (Trp plus) or tryptophan low (Trp minus) chows are presented. Taxonomic cladograms and bubble plots of enriched taxa in feces of B6 mice fed tryptophan-low compared to tryptophan-high chow (A) and TC mice fed tryptophan-high compared to tryptophan-low chow (B) are shown. Only taxa meeting the criteria (LDA score > 2 and p < 0.05) are shown. Data are from three independent experiments (n = 5/group). (C-I) GF B6 mice were gavaged with feces of TC mice maintained on a low or high tryptophan chow for 4 months, or were gavaged with PBS as a control and were analyzed 3 weeks later. Shown are mesenteric lymph node cell numbers (C),),serum anti-dsDNA IgM concentrations (D), number of Tfh cells in mesenteric lymph nodes (E), number of Th17 cells in mesenteric lymph nodes (F), number of germinal center B cells (G), and plasma cells (H). CD25 expression (MFI) on Treg cells in mesenteric lymph nodes are shown (I). Data are presented as means and SEM and are compared with t tests. * P < 0.05, ** P < 0.01 (n= 5-10/group).
Figure 6.
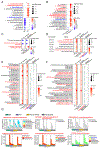
Figure 6.. Alterations in the gut microbiota potentially modify TC mouse metabolism.
Shown is shotgun sequencing for rDNA sequences in the feces of B6 and TC mice fed a control diet (n = 4/group), and TC mice fed a low tryptophan diet (TC.Trp minus) or high tryptophan diet (TC.Trp plus, n = 5/group). (A) LEfSe analyses of fecal taxa comparisons between B6 and TC groups are shown. (B) Enrichment analyses of fecal taxa comparisons of low and high tryptophan diet- TC mice are shown. (C-G) Linear discriminant analysis effect size (LEfSe) analyses of metabolic pathways and sub-level gene families in fecal samples from lupus-prone mice (either TC or TC.Trp plus) compared to those from control groups (either B6 or TC.Trp minus) are shown. (C) BioCyc metabolic pathway analysis of fecal samples are shown comparing either the B6 and TC mouse strain on control diet or the TC mice on high and low tryptophan diet. ?? (D-F) The two columns of the left show linear discriminant analysis scores of annotated gene families recategorized by EC number (D), Pfam (E) and KEGG pathways (F), comparing B6 to TC microbiota, and low to high tryptophan TC microbiota. The columns on the right indicate the dominant bacterial species to which the majority of the sequencing reads mapped to the gene families found in the microbiota of TC mice fed low or high tryptophan. (*) indicates annotations in either the Prevotella or Alloprevotella genus. (G) Shown are selected bar plots indicating genus-stratified profiles of metabolic pathways and gene families. The top of each set of stacked bars indicates the total stratified abundance of the pathway within a single fecal sample. Species and “unclassified” stratifications are linearly scaled within the total bar height.

Comment in

Similar articles

Cited by

References

    1. Clemente JC, Manasson J, Scher JU, The role of the gut microbiome in systemic inflammatory disease. BMJ 360, j5145 (2018). - PMC - PubMed
    1. Hevia A et al., Intestinal dysbiosis associated with systemic lupus erythematosus. mBio 5, (2014). - PMC - PubMed
    1. Luo XM et al., Gut microbiota in human systemic lupus erythematosus and a mouse model of lupus. Appl Environ Microbiol 84, e02288–02217 (2018). - PMC - PubMed
    1. Azzouz D et al., Lupus nephritis is linked to disease-activity associated expansions and immunity to a gut commensal. Ann Rheum Dis 78, 947–956 (2019). - PMC - PubMed
    1. Zhang H, Liao X, Sparks JB, Luo XM, Dynamics of gut microbiota in autoimmune lupus. Appl Environ Microbiol 80, 7551–7560 (2014). - PMC - PubMed

Publication types