. 2020 Jul 3;3(1):346.
doi: 10.1038/s42003-020-1075-1.

Cell-to-cell expression dispersion of B-cell surface proteins is linked to genetic variants in humans

Affiliations

Cell-to-cell expression dispersion of B-cell surface proteins is linked to genetic variants in humans

Gérard Triqueneaux et al. Commun Biol. .

Abstract

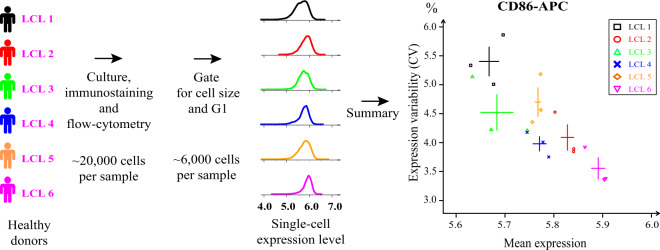
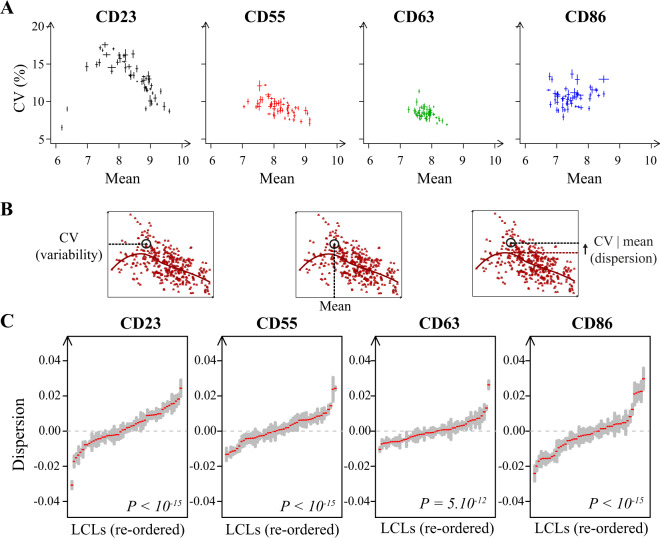
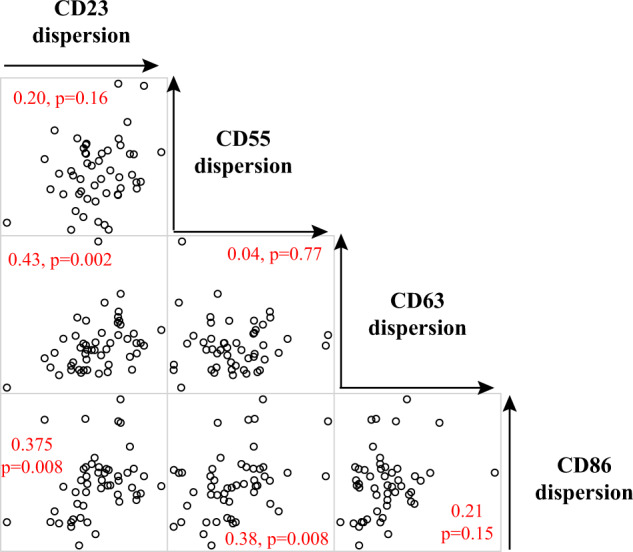
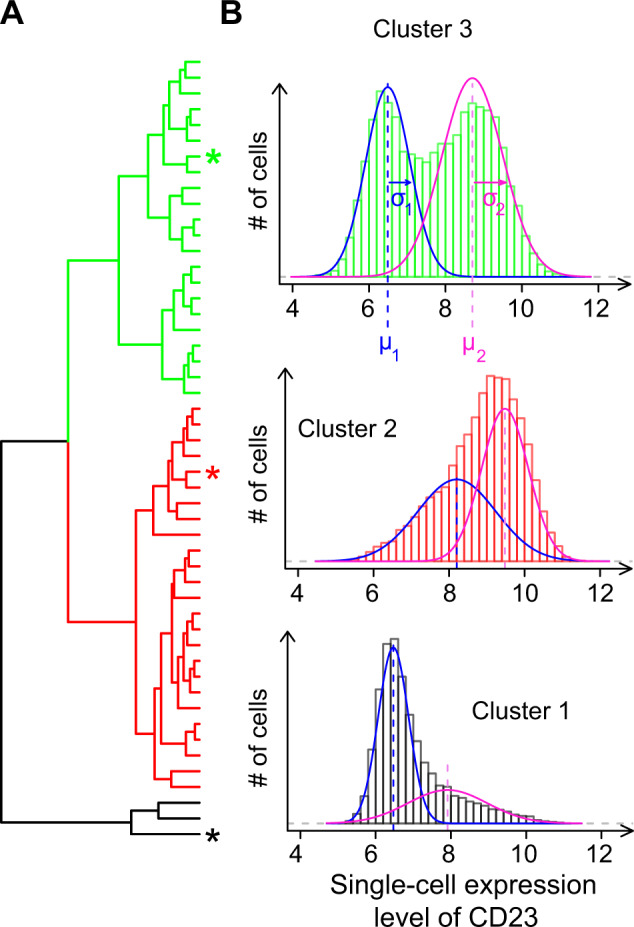
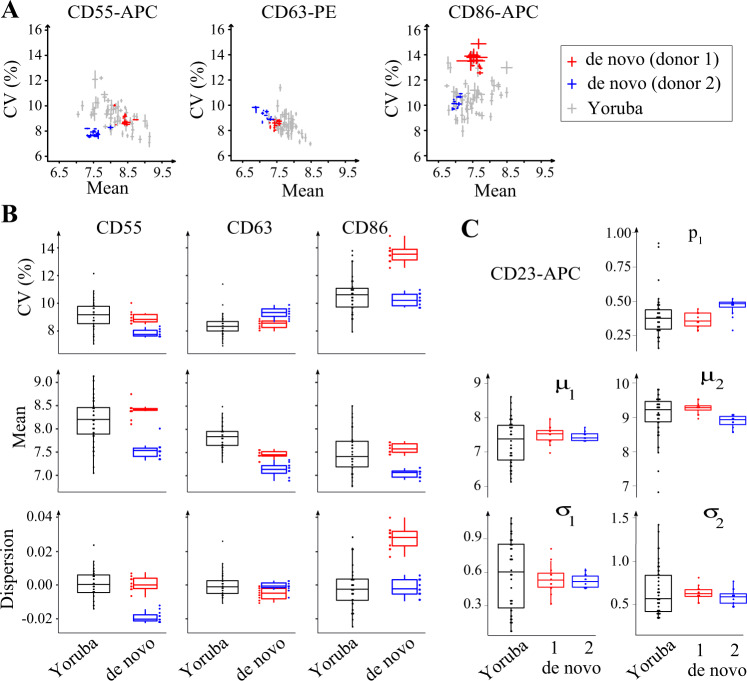
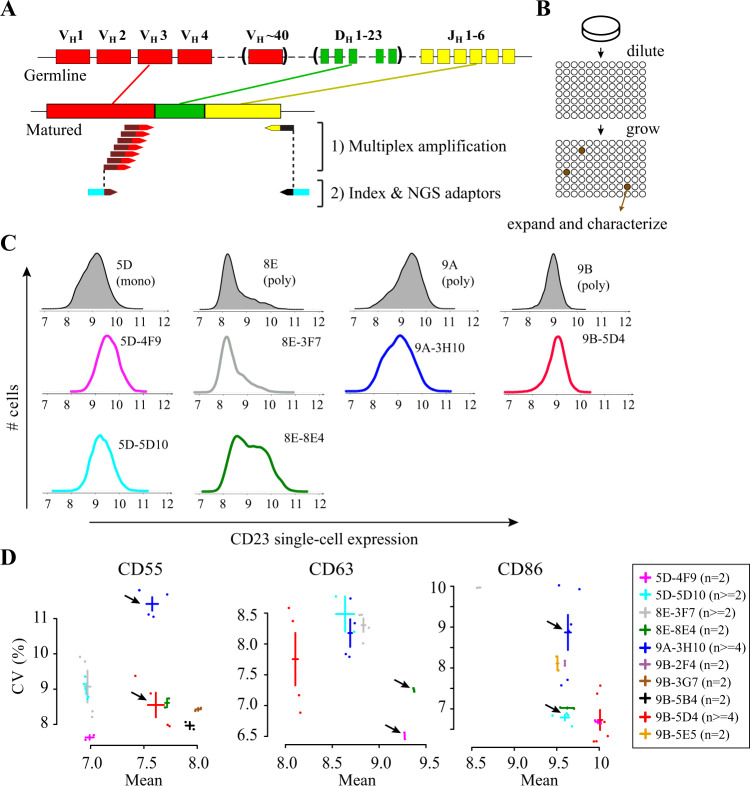
Variability in gene expression across a population of homogeneous cells is known to influence various biological processes. In model organisms, natural genetic variants were found that modify expression dispersion (variability at a fixed mean) but very few studies have detected such effects in humans. Here, we analyzed single-cell expression of four proteins (CD23, CD55, CD63 and CD86) across cell lines derived from individuals of the Yoruba population. Using data from over 30 million cells, we found substantial inter-individual variation of dispersion. We demonstrate, via de novo cell line generation and subcloning experiments, that this variation exceeds the variation associated with cellular immortalization. We detected a genetic association between the expression dispersion of CD63 and the rs971 SNP. Our results show that human DNA variants can have inherently-probabilistic effects on gene expression. Such subtle genetic effects may participate to phenotypic variation and disease outcome.


Conflict of interest statement

The authors declare no competing interests.

Figures

Fig. 1
Fig. 1. Experimental single-cell gene expression quantification in LCL lines.
Cell lines from different healthy donors were cultured, fixed, immunostained with a fluorescent antibody, and analyzed by flow cytometry. A computational pipeline (see methods) automatically gated cells with similar size and in the G1 phase of the cell cycle, yielding distributions of expression values (log of fluorescence intensity) of the antigen protein of interest (here CD86). Summary statistics of the expression distributions were computed, such as the mean and coefficient of variation (CV = sd/mean). The experiment (culture, staining and acquisitions) was repeated several times independently to estimate intra-line variability (error bars: s.e.m., here n = 3 samples). Differences in CV between lines displaying similar mean levels of expression reflects different levels of cell-to-cell variability in expression (visible here for LCL4 versus LCL5). Icons of persons were modified from an icon created by Muhammad Haq and provided by https://www.freeicons.io under the Creative Commons (Attribution 3.0 Unported) licence.
Fig. 2
Fig. 2. Single-cell expression of surface proteins in cell lines from unrelated individuals.
a Six cell lines from unrelated individuals (one per color) were immunostained for the indicated protein and analyzed by flow-cytometry to estimate CV and mean expression in cell populations. Each dot represents mean ± s.e.m. between biological replicates of the same cell line; n >= 3 except for CD38 where n = 1 (dot instead of bars) for one cell line and n = 2 for 4 cell lines. Arrow: the CV of CD23 was significantly different between GM18519B and GM18489A (t-test P = 0.003). b Distributions of single-cell expression values for 5 of the proteins shown in the boxed panels of a. Each distribution corresponds to one randomly-chosen sample of the indicated protein and cell line (same color as in a).
Fig. 3
Fig. 3. Patterns of variation in mean expression and CV across 50 individuals.
a For each sample (at least 6 per antibody and cell line), the CV and mean expression were computed. Each dot represents mean ± s.e.m. computed for each cell line and antibody combination. b Lowess regression applied to the data (here for CD55 expression). The model was fitted to the entire dataset and for each sample, residuals were extracted (CV|mean = difference between the observed CV and the CV predicted by the model given the observed mean expression). c Distributions of expression dispersion of the indicated proteins in 50 Yoruba cell lines. Each red tick corresponds to the average value of dispersion across biological replicates. Gray shaded bar = +/− s.e.m. (n > = 6). P: Kruskal–Wallis rank sum test.
Fig. 4
Fig. 4. Correlation between expression dispersions of different proteins.
Each dot plot represents expression dispersion values (CV|mean) of two proteins (which names appear on the diagonal) across 50 Yoruba LCLs (one per dot). The Spearman rank correlation coefficient is indicated on each plot with the corresponding p-value.
Fig. 5
Fig. 5. Variation in the bimodality of CD23 expression.
a Hierarchical clustering of LCLs based on GMM parameters. Clusters 1 to 3 contained 3, 25, and 22 LCLs, respectively. LCL labels are provided in Supplementary Fig. 5. b One sample was randomly chosen from each cluster to plot the observed data (histogram) and fitted model components (lines). These samples correspond to LCLs labeled as asterisk (*) in a (same color).
Fig. 6
Fig. 6. Intra-individual versus inter-individual variation of expression dispersion.
Multiple LCLs were generated de novo using blood samples from two unrelated donors (blue and red), and expression mean and variability was compared to those observed in Yoruba LCLs. a Dot plots of CV versus mean expression of the indicated proteins. Each dot represents one cell line, as mean ± s.e.m. (n = 2 independent cultures of each de novo LCL). b Boxplot of CV, mean, and dispersion. Dispersion values correspond to CV|mean residuals computed from a lowess regression fitted to all samples. c Boxplot of GMM parameter values fitted to distributions of single-cell CD23 expression (as in Fig. 5). Each dot represents one cell line. Values of replicate cultures were averaged.
Fig. 7
Fig. 7. Subclones of LCLs also display variation in expression dispersion.
a Scheme of the clonality test applied to cell lines and subclones (see main Text and Supplementary Table 1 for results). b Subcloning procedure. c Single-cell expression distributions of CD23 in cell lines (shaded gray) and subclones (colored lines). 5D = GM18505D; 9A = GM18489A; 8E = GM19238E; 9B = GM18519B. d Expression mean and CV of three proteins in ten monoclonal subclones. Crosses: mean +/− s.e.m. n, number of independent samples. Arrows point to examples of subclones with statistically significant differences in dispersion (see text). In cd, subclones nomenclature indicates their origin (e.g., 5D-4F9 derived from 5D).
Fig. 8
Fig. 8. Genetic mapping of CD63 expression variability.
a Dot plot of CV versus mean expression of CD63 in 48 LCLs, colored according to their genotype at SNP rs971. b Boxplot of CD63 mean expression and dispersion according to rs971 genotype. Uncorrected linkage p-values were 0.1269 for mean expression and 0.0004 for dispersion and corresponded to FDR = 0.998 and 0.1, respectively. c Genomic view of the locus. Blue dots, nominal linkage scores for association with CD63 expression variability (CV). Bottom track: genomic coordinates and genes positions. Middle track: transcripts of CD63 and SMUG1. Retrieved from Ensembl on 2019-06-11 using GenomeGraphs.

Similar articles

References

    1. Oates AC. What’s all the noise about developmental stochasticity? Development. 2011;138:601–607. - PubMed
    1. Yvert G. ‘Particle genetics’: treating every cell as unique. Trends Genet. 2014;30:49–56. - PMC - PubMed
    1. Richard M, Yvert G. How does evolution tune biological noise? Syst. Biol. 2014;5:374. - PMC - PubMed
    1. Jolly, M. K., Kulkarni, P., Weninger, K., Orban, J. & Levine, H. Phenotypic plasticity, bet-hedging, and androgen independence in prostate cancer: role of non-genetic heterogeneity. Front. Oncol. 8, 50 (2018). - PMC - PubMed
    1. Ansel J, et al. Cell-to-cell stochastic variation in gene expression is a complex genetic trait. PLoS Genet. 2008;4:e1000049. - PMC - PubMed

Publication types

MeSH terms

Substances