. 2020 Jun 29;16(6):e1008511.
doi: 10.1371/journal.pgen.1008511. eCollection 2020 Jun.

JMJD6 participates in the maintenance of ribosomal DNA integrity in response to DNA damage

Affiliations

JMJD6 participates in the maintenance of ribosomal DNA integrity in response to DNA damage

Jérémie Fages et al. PLoS Genet. .

Abstract

Ribosomal DNA (rDNA) is the most transcribed genomic region and contains hundreds of tandem repeats. Maintaining these rDNA repeats as well as the level of rDNA transcription is essential for cellular homeostasis. DNA damages generated in rDNA need to be efficiently and accurately repaired and rDNA repeats instability has been reported in cancer, aging and neurological diseases. Here, we describe that the histone demethylase JMJD6 is rapidly recruited to nucleolar DNA damage and is crucial for the relocalisation of rDNA in nucleolar caps. Yet, JMJD6 is dispensable for rDNA transcription inhibition. Mass spectrometry analysis revealed that JMJD6 interacts with the nucleolar protein Treacle and modulates its interaction with NBS1. Moreover, cells deficient for JMJD6 show increased sensitivity to nucleolar DNA damage as well as loss and rearrangements of rDNA repeats upon irradiation. Altogether our data reveal that rDNA transcription inhibition is uncoupled from rDNA relocalisation into nucleolar caps and that JMJD6 is required for rDNA stability through its role in nucleolar caps formation.


Conflict of interest statement

The authors have declared that no competing interests exist

Figures

Fig 1
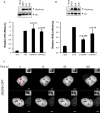
Fig 1. JMJD6 expression is required for the normal DNA damage response to ionizing radiation exposure.
(A). Images of U2OS cells transfected with the indicated siRNA, exposed to ionizing radiations (8 Gy) and subjected to DAPI and gH2AX staining one hour or six hours following irradiation, as indicated. Scale bar 50 μm. (B). Quantification of gH2AX staining by high throughput microscopy in cells from A. A minimum of 200 cells were quantified for each conditions. A representative experiment from 3 is shown. The p values of the difference between the indicated samples are shown (Wilcoxon test). (C). siRNA efficacy tested through Western blot analysis on whole cell extracts.
Fig 2
Fig 2. DSB repair using NHEJ is affected by JMJD6 depletion.
(A) Relative frequency of Homology-Driven Repair of DSB in JMJD6 depleted cells. the percentage of GFP positive cells was measured by flow cytometry and calculated relative to 1 in cells transfected by the control siRNA. The mean and standard deviation from four entirely independent experiments are shown. The right panel shows a Western blot monitoring I-SceI expression in the different transfected cells. (B) Same as in A except that GCS5 human fibroblasts containing a reporter system for NHEJ were used. The p values of the difference to the control siRNA are indicated (Student t test). (C) U2OS cells transfected by a plasmid expressing JMJD6-GFP fusion protein and subjected to local laser irradiation 24h later. Images of cells before and after the indicated time following nucleus laser irradiation are shown. The red dashed lines represent the laser irradiated region in the nucleus. insert: magnification of the nucleolus irradiated regions. Scale bar 5 μm.
Fig 3
Fig 3. JMJD6-depleted cells are more sensitive to DSBs induced in rDNA.
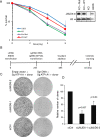
(A) Clonogenic cell survival assay performed on U2OS cells, JMJD6-KO and JMJD6-KO- complemented cell lines with WT (KO+WT) and catalytic inactive forms of JMJD6 (KO+Mut) and exposed to increased doses of irradiation. The mean and standard deviation from three independent experiments are plotted. A similar experiment with another clone is shown in S3 Fig. Expression of JMJD6 in the different cell lines examined by Western blot. The bar indicates that the original image was cut to remove unnecessary lanes. (B) Scheme of the CRISPR experiment designed to test the sensitivity of JMJD6 depleted cells subjected to targeted rDNA breaks. U2OS cells were transfected with a vector expressing a guide RNA targeting the rDNA (sgrDNA) together with a guide RNA targeting the ATP1A1 gene (sgRNA ATP1A1) and a donor DNA rendering ATP1A1 resistant to ouabain. As a control an empty vector not coding for guide RNA targeting rDNA but with a guide RNA targeting the ATP1A1 gene (sgRNA ATP1A1) and a donor DNA rendering ATP1A1 resistant to ouabain was used. 10 days later, clones were stained with crystal violet. (C) Example of a typical experiment. (D) Quantification of the experiment, the number of clones was calculated relative to 100, with 100 corresponding to cells transfected by the control siRNA. The mean and standard deviation from three independent experiments are plotted. The p values of the difference between the siJMJD6 samples and the Ctrl siRNA sample are indicated (Student t test).
Fig 4
Fig 4. JMJD6 expression is required for rDNA repeat integrity following DNA damage
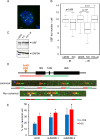
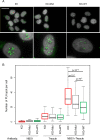
(A) Representative image showing individual NORs in a U2OS cell in metaphase stained using an anti UBF antibody. Scale bar 5 μm. (B) Ionizing radiation (2 Gy) exposure of U2OS cells, U2OS cells inactivated for JMJD6 expression (KO) and a clone from the latter cell line in which wild type JMJD6 was reintroduced (KO + wt). The number of UBF foci in cells was then counted and the results represented as box plot. For each point a minimum of 50 metaphases were scored. Results from one representative experiment from 2 independent experiments is shown. The p values of the difference between the indicated samples are shown (Wilcoxon test). (C) Western blot analysis of UBF expression in the different cell lines. (D) Evaluation of rDNA rearrangements by FISH combing. Representation of a rDNA repeat with the position of the DSB induced by AsiSI after OHTam treatment. The green and red lines represent the FISH probes used in DNA FISH combing experiments and targeting two adjacent sequences in the rDNA. An example of a canonical array (without rDNA rearrangement) is shown. Note that the green and red probes are in the same order throughout the array. An example of a non-canonical (with rDNA rearrangement indicated by a star) rDNA repeat is also shown. E. Quantification of non-canonical rearrangements measured before and after DSB induction in siRNA control and siRNA JMJD6-depleted cells. Quantification was performed on duplicate samples with more than 400 units examined on each samples. Results are the mean +/- s.e.m. of three independent experiments. * p<0.1 was considered as significant. p values of the difference in non induced DSB were calculated using Student t test and are p = 0.04 and p = 0.08 for siJMJD6-1 and siJMJD6-2, respectively. p values of the difference after DSB are p = 0.076 and p = 0.073 for siJMJD6-1 and siJMJD6-2, respectively.
Fig 5
Fig 5. JMJD6 interacts with TCOF1 (Treacle).
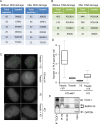
(A) List of JMJD6 interactors identified after mass spectrometry (total spectral counts) after tandem affinity purification of endogenous JMJD6 isolated from K562 cells before and after DNA damage induced with etoposide (20μM 1h). See S1 Table for complete results. (B) Selected list of interaction partners associated with TCOF1 detected by BioID with and without etoposide treatment. See S2 Table for complete results. (C) Images of JMJD6-V5/Treacle (TCOF1) interaction revealed by Proximity Ligation Assay (PLA) in cells exposed to IR (5 Gy, 1h post IR). Scale bar 5 μm. (D). Quantification of PLA-induced spot for the different conditions of antibodies was performed on at least 200 cells for each conditions. (E) Co immunoprecipitation of TCOF1 with JMJD6. Total cell extracts from U2OS cells were immunoprecipitated with TCOF1 or V5 antiboby or no antibody as a control and revealed by Western blot for Treacle and JMJD6-V5 presence. The bars indicate that the original image was cut to remove unnecessary lanes. Note that the ECL substrate was exhausted in the V5 Western blot in the V5 and TCOF1 IP because of the very strong signal given by V5-tagged JMJD6 in the V5 IP or the immunoglobulin in the TCOF1 IP.
Fig 6
Fig 6. JMJD6 controls the interaction between Treacle and NBS1.
(A) Images of NBS1/Treacle interaction revealed by Proximity Ligation Assay (PLA) in cells exposed to IR (5 Gy, 1 h post IR). Scale bar 50 μm. The bottom panels show magnifications from selected regions from these images.(B) Quantification of PLA-induced spot for the different conditions of antibodies was performed on at least 200 cells for each conditions. One representative experiment from four independent experiments is shown. Two other experiments are shown in S7 Fig. The p value of the difference between KO and KO+Mut to KO+WT are shown.
Fig 7
Fig 7. JMJD6 expression favours rDNA transcription following DNA damage.
(A) Level of rDNA transcription assessed through 5FUrd incorporation following 4 hours of endonuclease-mediated DSBs (AsiSI) in U2OS DIVA cells transfected with the indicated siRNA, insert: a magnified region of the image. Scale bar 5 μm. (B) Quantification of 5FUrd staining by high throughput microscopy in cells from A. A representative experiment from 2 independent experiments is shown. The p values of the difference between the indicated samples are shown (Wilcoxon test). (C) Same as in A, except that cells were exposed to ionizing radiation (IR) (8 Gy) or not and stained 1 hour or 6 hours following irradiation. Scale bar 5 μm. (D) Quantification of 5FUrd staining by high throughput microscopy in cells from C. A representative experiment from 2 independent experiments is shown. For each data point a minimum of 200 cells were quantified. The p values of the difference between the indicated samples are indicated (Wilcoxon test).
Fig 8
Fig 8. Nucleolar caps formation in response to DNA damage.
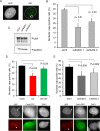
(A) Images from endonuclease-induced DSB (4 hours of OHTam treatment) in DIVA cells showing nucleolar caps revealed by UBF foci formation at the nucleolus periphery. The arrows point towards nucleolar caps. Scale bar 5 μm. (B) Quantification of nucleolar caps positive cells after JMJD6 depletion using siRNA. (C) Western blot analysis of UBF expression after siRNA-induced JMJD6 depletion. (D) Quantification of nucleolar caps positive cells in parental U2OS and JMJD6 KO and complemented (KO+WT) cell lines after generation of rDNA DSB using CRISPR-Cas9. Images of nucleolar caps revealed by UBF staining in Cas9-GFP transfected cells. The arrows point towards nucleolar caps. (E) Quantification of nucleolar caps positive cells after JMJD6 depletion using siRNA in the MRC5 cell line and generation of rDNA DSB using CRISPR-Cas9. Images of nucleolar caps revealed by UBF staining in Cas9-GFP transfected cells. The arrows point towards nucleolar caps. The mean and standard deviation from three independent experiments are shown. For each conditions a minimum of 100 cells were counted. The p values of the difference between the indicated samples are indicated (Student t test).
Fig 9
Fig 9. ATM activation in JMJD6 defective cells.
(A) Western blot analysis of ATM activation in response to IR (20 Gy 1h post IR) performed by the detection of the phosphorylated form of ATM. The smaller bands induced upon irradiation are probably shorter forms of P-ATM. (B) Dependence on ATM activity for the formation of nucleolar caps in response to IR. Cells were treated or not with the ATM inhibitor. A minimum of 100 cells were counted for each condition in each independent experiment. Results are the mean +/- standard deviation from three independent experiments. The p values of the difference between the indicated samples are indicated (Student t test).
Fig 10
Fig 10. NBS1 localization in nucleoli after DNA damage is dependent on JMJD6.
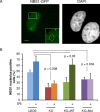
(A) Representative images of U2OS cells expressing NBS1-GFP after IR exposure (5 Gy). Insert showing the presence of NBS1 foci in nucleolus. Scale bar 5 μm. (B) Quantification of the percentage of U2OS, JMJD6-KO and JMJD6-KO-complemented with wild type JMJD6 (KO+WT) and JMJD6-KO-complemented with an inactive form of JMJD6 (KO+Mut) cell lines expressing NBS1-GFP that exhibit NBS1 nucleolar foci without and after IR exposure. Results are the mean +/- standard deviation from three independent experiments. In each independent experiment more than 100 transfected cells were counted for each point. The p values of the difference to the U2OS cell line after IR are indicated (Student t test).
Fig 11
Fig 11. Working model on the role of JMJD6 in rDNA breaks management.
Upon induction of rDNA breaks in wild type cells (left), JMJD6 in association with TCOF1 restricts the NBS1-TCOF1 interaction, allowing NBS1 to be available to initiate resection within the MRN complex and therefore leading to nucleolar caps formation and faithful homologous recombination. In JMJD6-depleted cells (right), the NBS1/TCOF1 complex still forms, allowing transcriptional repression, but nucleolar caps formation is defective, resulting in a genetic instability of rDNA arrays.

Similar articles

Cited by

References

    1. Iyama T, Wilson DM 3rd (2013) DNA repair mechanisms in dividing and non-dividing cells. DNA Repair (Amst) 12: 620–636. - PMC - PubMed
    1. McStay B (2016) Nucleolar organizer regions: genomic 'dark matter' requiring illumination. Genes Dev 30: 1598–1610. 10.1101/gad.283838.116 - DOI - PMC - PubMed
    1. Grummt I (2013) The nucleolus-guardian of cellular homeostasis and genome integrity. Chromosoma 122: 487–497. 10.1007/s00412-013-0430-0 - DOI - PubMed
    1. Udugama M, Sanij E, Voon HPJ, Son J, Hii L, et al. (2018) Ribosomal DNA copy loss and repeat instability in ATRX-mutated cancers. Proc Natl Acad Sci U S A 115: 4737–4742. 10.1073/pnas.1720391115 - DOI - PMC - PubMed
    1. Killen MW, Stults DM, Adachi N, Hanakahi L, Pierce AJ (2009) Loss of Bloom syndrome protein destabilizes human gene cluster architecture. Hum Mol Genet 18: 3417–3428. 10.1093/hmg/ddp282 - DOI - PubMed

Publication types

MeSH terms

Grants and funding