

Distribution of Transmission Potential During Nonsevere COVID-19 Illness
- PMID: 32594116
- PMCID: PMC7337652
- DOI: 10.1093/cid/ciaa886
Distribution of Transmission Potential During Nonsevere COVID-19 Illness
Abstract
Background: Patients recovering from coronavirus disease 2019 (COVID-19) often continue to test positive for the causative virus by polymerase chain reaction (PCR) even after clinical recovery, thereby complicating return-to-work plans. The purpose of this study was to evaluate transmission potential of COVID-19 by examining viral load with respect to time.
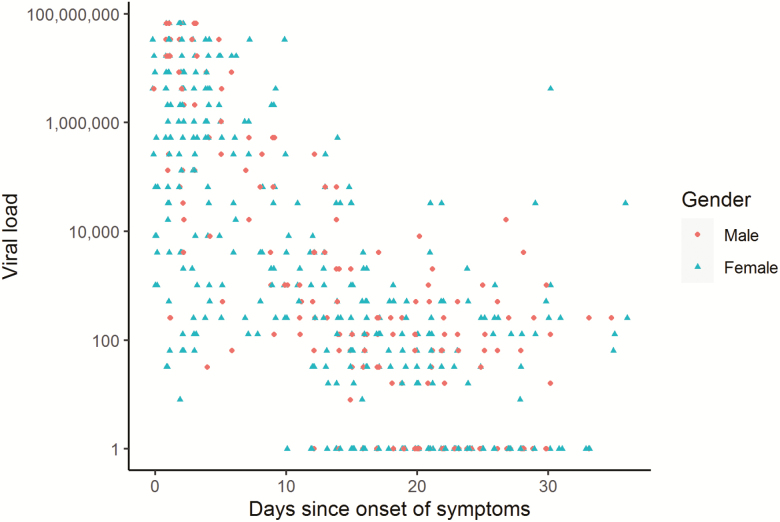
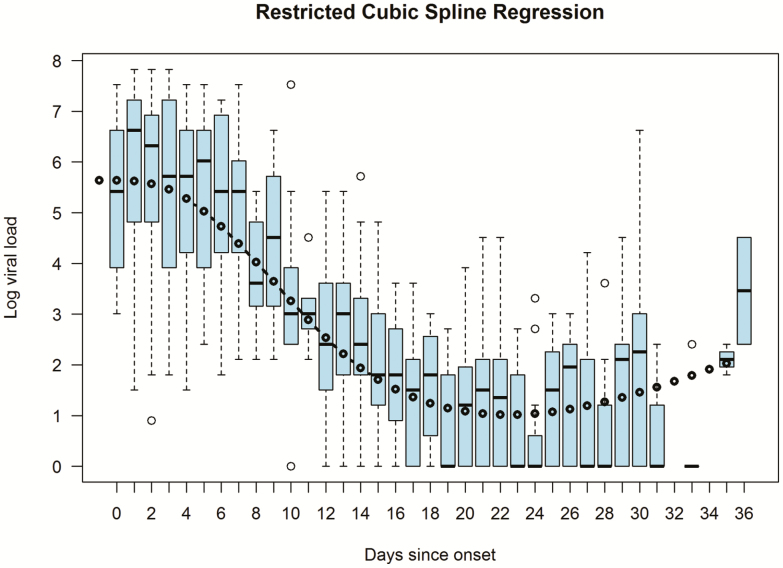
Methods: Health care personnel (HCP) at Cleveland Clinic diagnosed with COVID-19, who recovered without needing hospitalization, were identified. Threshold cycles (Ct) for positive PCR tests were obtained and viral loads calculated. The association of viral load with days since symptom onset was examined in a multivariable regression model, which was reduced by stepwise backward selection to only keep variables significant at a level of .05. Viral loads by day since symptom onset were predicted using the model and transmission potential evaluated by examination of a viral load-time curve.
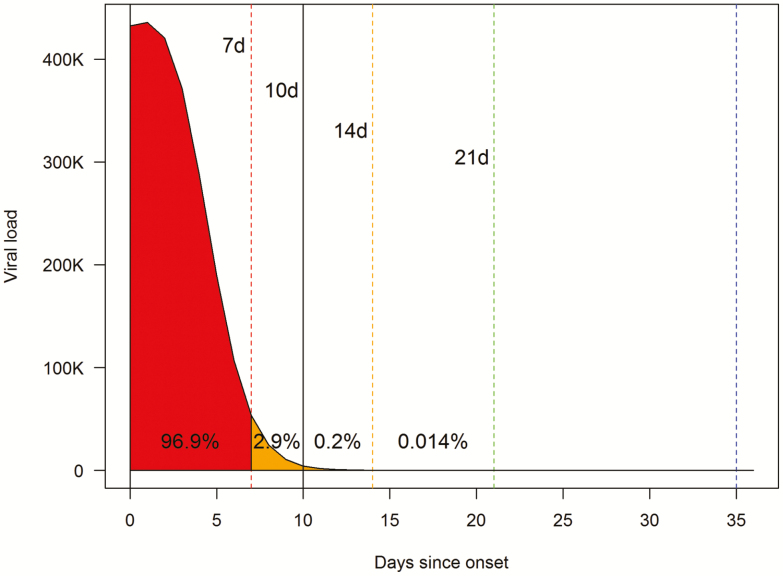
Results: Over 6 weeks, 230 HCP had 528 tests performed. Viral loads declined by orders of magnitude within a few days of symptom onset. The only variable significantly associated with viral load was time since onset of symptoms. Of the area under the curve (AUC) spanning symptom onset to 30 days, 96.9% lay within the first 7 days, and 99.7% within 10 days. Findings were very similar when validated using split-sample and 10-fold cross-validation.
Conclusions: Among patients with nonsevere COVID-19, viral loads in upper respiratory specimens peak by 2 or 3 days from symptom onset and decrease rapidly thereafter. The vast majority of the viral load-time AUC lies within 10 days of symptom onset.
Keywords: SARS virus; area under curve; disease transmission; infectious; viral load.
© The Author(s) 2020. Published by Oxford University Press for the Infectious Diseases Society of America. All rights reserved. For permissions, e-mail: journals.permissions@oup.com.
Figures
Similar articles
-
Presymptomatic SARS-CoV-2 Infections and Transmission in a Skilled Nursing Facility.N Engl J Med. 2020 May 28;382(22):2081-2090. doi: 10.1056/NEJMoa2008457. Epub 2020 Apr 24. N Engl J Med. 2020. PMID: 32329971 Free PMC article.
-
[SARS-CoV-2 and Microbiological Diagnostic Dynamics in COVID-19 Pandemic].Mikrobiyol Bul. 2020 Jul;54(3):497-509. doi: 10.5578/mb.69839. Mikrobiyol Bul. 2020. PMID: 32755524 Review. Turkish.
-
Kinetics of viral load and antibody response in relation to COVID-19 severity.J Clin Invest. 2020 Oct 1;130(10):5235-5244. doi: 10.1172/JCI138759. J Clin Invest. 2020. PMID: 32634129 Free PMC article. Clinical Trial.
-
Potential False-Negative Nucleic Acid Testing Results for Severe Acute Respiratory Syndrome Coronavirus 2 from Thermal Inactivation of Samples with Low Viral Loads.Clin Chem. 2020 Jun 1;66(6):794-801. doi: 10.1093/clinchem/hvaa091. Clin Chem. 2020. PMID: 32246822 Free PMC article.
-
Chronological Changes of Viral Shedding in Adult Inpatients With COVID-19 in Wuhan, China.Clin Infect Dis. 2020 Nov 19;71(16):2158-2166. doi: 10.1093/cid/ciaa631. Clin Infect Dis. 2020. PMID: 32445580 Free PMC article.
Cited by
-
Developing effective siRNAs to reduce the expression of key viral genes of COVID-19.Int J Biol Sci. 2021 Apr 10;17(6):1521-1529. doi: 10.7150/ijbs.59151. eCollection 2021. Int J Biol Sci. 2021. PMID: 33907515 Free PMC article.
-
Carrageenan-containing over-the-counter nasal and oral sprays inhibit SARS-CoV-2 infection of airway epithelial cultures.Am J Physiol Lung Cell Mol Physiol. 2021 May 1;320(5):L750-L756. doi: 10.1152/ajplung.00552.2020. Epub 2021 Feb 9. Am J Physiol Lung Cell Mol Physiol. 2021. PMID: 33561380 Free PMC article.
-
Merits and Demerits of Selective Isolation of Superspreaders: A Mathematical Modeling Study Based upon West Bengal (India) SARS-COV 2 Data.Indian J Community Med. 2021 Jul-Sep;46(3):515-519. doi: 10.4103/ijcm.IJCM_817_20. Epub 2021 Oct 13. Indian J Community Med. 2021. PMID: 34759500 Free PMC article.
-
Comprehensive Analysis of COVID-19 Symptomatology among Healthcare Workers: Insights from a Tertiary Hospital.Maedica (Bucur). 2024 Sep;19(3):600-606. doi: 10.26574/maedica.2024.19.3.600. Maedica (Bucur). 2024. PMID: 39553360 Free PMC article.
-
In vivo kinetics of SARS-CoV-2 infection and its relationship with a person's infectiousness.medRxiv [Preprint]. 2021 Jun 30:2021.06.26.21259581. doi: 10.1101/2021.06.26.21259581. medRxiv. 2021. Update in: Proc Natl Acad Sci U S A. 2021 Dec 7;118(49):e2111477118. doi: 10.1073/pnas.2111477118. PMID: 34230935 Free PMC article. Updated. Preprint.
References
-
- Centers for Disease Control and Prevention. Return-to-work criteria for healthcare workers 2020. Available at: https://www.cdc.gov/coronavirus/2019-ncov/hcp/return-to-work.html?CDC_AA.... Accessed 1 May 2020.
-
- R Core Team. R: a language and environment for statistical computing. Vienna, Austria: R Foundation for Statistical Computing, 2020.
-
- Kowarik A, Templ M. Imputation with the {R} Package {VIM}. J Stat Softw 2016; 74:1–16.
-
- van Buuren S, Groothuis-Oudshoorn K. {mice}: multivariate imputation by chained equations in R. J Stat Softw 2011; 45:1–67.
MeSH terms
LinkOut - more resources
Full Text Sources
Medical
Miscellaneous
