High Concentrations of Uric Acid and Angiotensin II Act Additively to Produce Endothelial Injury
- PMID: 32565731
- PMCID: PMC7261330
- DOI: 10.1155/2020/8387654
High Concentrations of Uric Acid and Angiotensin II Act Additively to Produce Endothelial Injury
Abstract
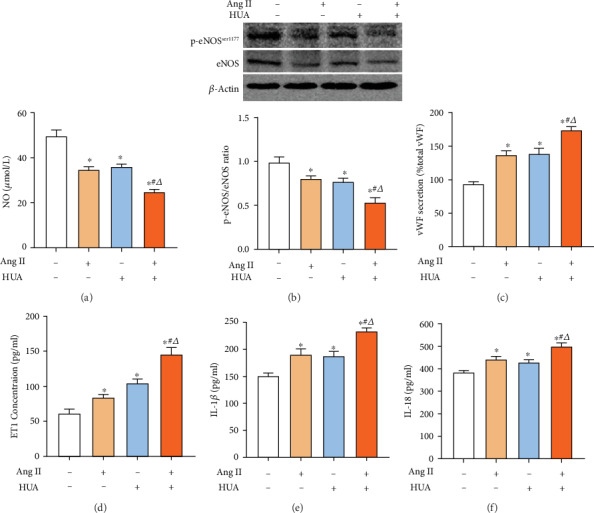
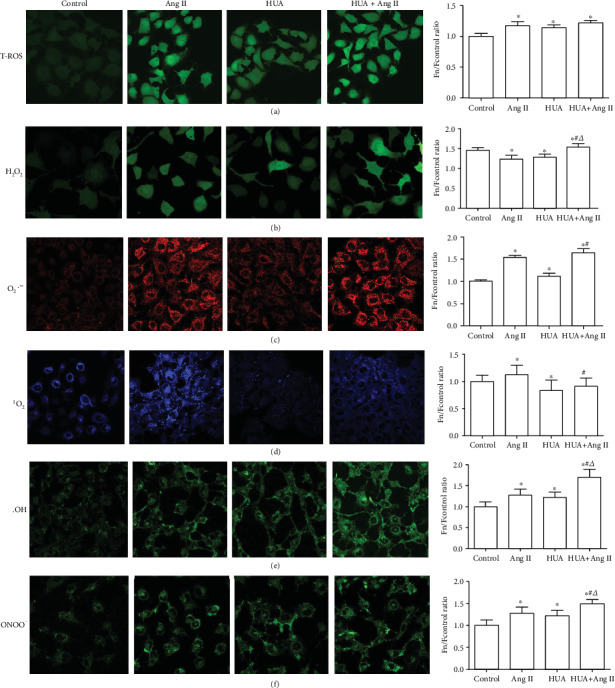
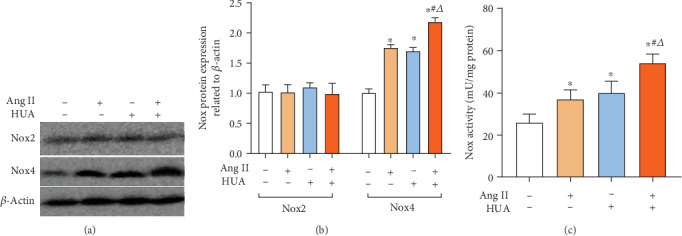
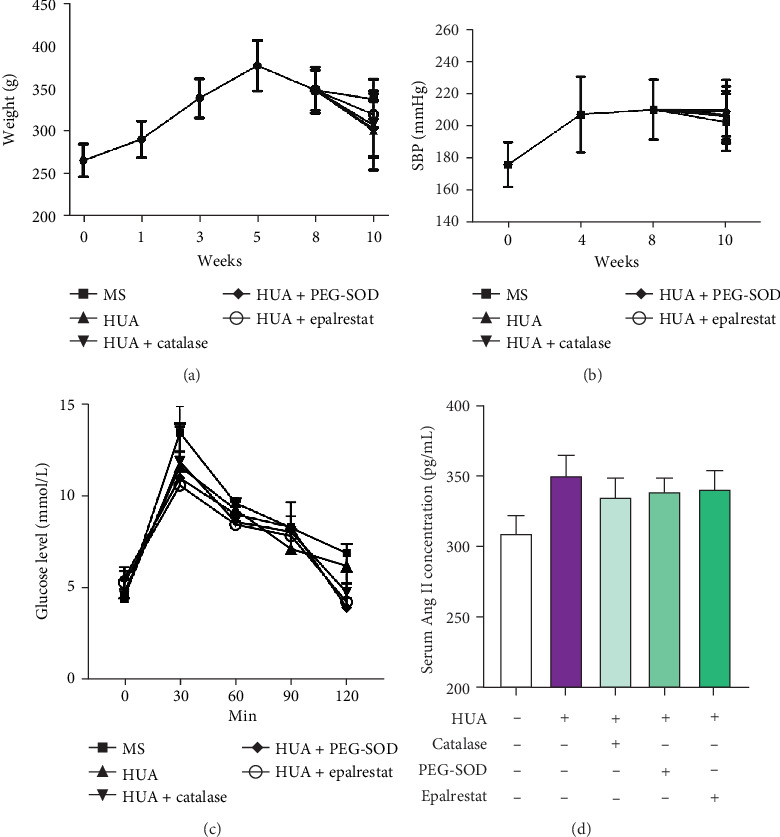
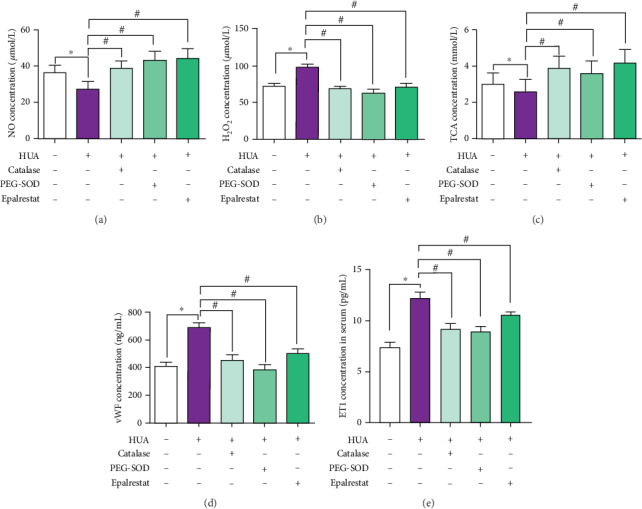
Renin angiotensin (Ang) system (RAS) activation in metabolic syndrome (MS) patients is associated with elevated uric acid (UA) levels, resulting in endothelial system dysfunction. Our previous study demonstrated that excessive UA could cause endothelial injury through the aldose reductase (AR) pathway. This study is the first to show that a high concentration of Ang II in human umbilical vein endothelial cells (HUVECs) increases reactive oxygen species (ROS) components, including O2 ·- and H2O2, and further aggravates endothelial system injury induced by high UA (HUA). In a MS/hyperuricemia model, nitric oxide (NO) production was decreased, followed by a decrease in total antioxidant capacity (TAC), and the concentration of the endothelial injury marker von Willebrand factor (vWF) in the serum was increased. Treatment with catalase and polyethylene glycol covalently linked to superoxide dismutase (PEG-SOD) to individually remove H2O2 and O2 ·- or treatment with the AR inhibitor epalrestat decreased ROS and H2O2, increased NO levels and TAC, and reduced vWF release. Taken together, these data indicate that HUA and Ang II act additively to cause endothelial dysfunction via oxidative stress, and specific elimination of O2 ·- and H2O2 improves endothelial function. We provide theoretical evidence to prevent or delay endothelial injury caused by metabolic diseases.
Copyright © 2020 Quan Hong et al.
Conflict of interest statement
The authors declare that they have no competing financial interests.
Figures
Similar articles
-
Aldose reductase mediates endothelial cell dysfunction induced by high uric acid concentrations.Cell Commun Signal. 2017 Jan 5;15(1):3. doi: 10.1186/s12964-016-0158-6. Cell Commun Signal. 2017. PMID: 28057038 Free PMC article.
-
Uric acid enhances PKC-dependent eNOS phosphorylation and mediates cellular ER stress: A mechanism for uric acid-induced endothelial dysfunction.Int J Mol Med. 2016 Apr;37(4):989-97. doi: 10.3892/ijmm.2016.2491. Epub 2016 Feb 18. Int J Mol Med. 2016. PMID: 26935704 Free PMC article.
-
Vascular peroxidase 1 up regulation by angiotensin II attenuates nitric oxide production through increasing asymmetrical dimethylarginine in HUVECs.J Am Soc Hypertens. 2016 Sep;10(9):741-751.e3. doi: 10.1016/j.jash.2016.06.036. Epub 2016 Jul 1. J Am Soc Hypertens. 2016. PMID: 27475679
-
Hyperuricemia-induced endothelial insulin resistance: the nitric oxide connection.Pflugers Arch. 2022 Jan;474(1):83-98. doi: 10.1007/s00424-021-02606-2. Epub 2021 Jul 27. Pflugers Arch. 2022. PMID: 34313822 Review.
-
New insights into the non-hemostatic role of von Willebrand factor in endothelial protection.Can J Physiol Pharmacol. 2017 Oct;95(10):1183-1189. doi: 10.1139/cjpp-2017-0126. Epub 2017 Jul 17. Can J Physiol Pharmacol. 2017. PMID: 28715643 Review.
Cited by
-
Simvastatin reduces high uric acid-induced oxidative stress and inflammatory response in vascular endothelial cells via nuclear factor E2-related factor 2 (Nrf2) signaling.Iran J Basic Med Sci. 2023;26(8):927-933. doi: 10.22038/IJBMS.2023.69187.15074. Iran J Basic Med Sci. 2023. PMID: 37427319 Free PMC article.
-
Meta-analysis of the correlation between serum uric acid level and carotid intima-media thickness.PLoS One. 2021 Feb 11;16(2):e0246416. doi: 10.1371/journal.pone.0246416. eCollection 2021. PLoS One. 2021. PMID: 33571245 Free PMC article.
-
A Nomogram for Predicting the Possibility of Peripheral Neuropathy in Patients with Type 2 Diabetes Mellitus.Brain Sci. 2022 Sep 30;12(10):1328. doi: 10.3390/brainsci12101328. Brain Sci. 2022. PMID: 36291262 Free PMC article.
-
Association of Elevated Serum Uric Acid with Nerve Conduction Function and Peripheral Neuropathy Stratified by Gender and Age in Type 2 Diabetes Patients.Brain Sci. 2022 Dec 12;12(12):1704. doi: 10.3390/brainsci12121704. Brain Sci. 2022. PMID: 36552164 Free PMC article.
-
The Rho kinase signaling pathway participates in tubular mitochondrial oxidative injury and apoptosis in uric acid nephropathy.J Int Med Res. 2021 Jun;49(6):3000605211021752. doi: 10.1177/03000605211021752. J Int Med Res. 2021. PMID: 34167354 Free PMC article.
References
-
- Haffner S., Taegtmeyer H. Epidemic obesity and the metabolic syndrome. Circulation. 2003;108(13):1541–1545. doi: 10.1161/01.CIR.0000088845.17586.EC. - DOI - PubMed
-
- Rajagopalan S., Kurz S., Munzel T., et al. Angiotensin II-mediated hypertension in the rat increases vascular superoxide production via membrane NADH/NADPH oxidase activation. Contribution to alterations of vasomotor tone. The Journal of Clinical Investigation. 1996;97(8):1916–1923. doi: 10.1172/JCI118623. - DOI - PMC - PubMed
MeSH terms
Substances
LinkOut - more resources
Full Text Sources
Research Materials
Miscellaneous