. 2020 Jun 17;12(6):654.
doi: 10.3390/v12060654.

Cyclin-Dependent Kinases 8 and 19 Regulate Host Cell Metabolism during Dengue Virus Serotype 2 Infection

Affiliations

Cyclin-Dependent Kinases 8 and 19 Regulate Host Cell Metabolism during Dengue Virus Serotype 2 Infection

Molly Butler et al. Viruses. .

Abstract

Dengue virus infection is associated with the upregulation of metabolic pathways within infected cells. This effect is common to infection by a broad array of viruses. These metabolic changes, including increased glucose metabolism, oxidative phosphorylation and autophagy, support the demands of viral genome replication and infectious particle formation. The mechanisms by which these changes occur are known to be, in part, directed by viral nonstructural proteins that contact and control cellular structures and metabolic enzymes. We investigated the roles of host proteins with overarching control of metabolic processes, the transcriptional regulators, cyclin-dependent kinase 8 (CDK8) and its paralog, CDK19, as mediators of virally induced metabolic changes. Here, we show that expression of CDK8, but not CDK19, is increased during dengue virus infection in Huh7 human hepatocellular carcinoma cells, although both are required for efficient viral replication. Chemical inhibition of CDK8 and CDK19 with Senexin A during infection blocks virus-induced expression of select metabolic and autophagic genes, hexokinase 2 (HK2) and microtubule-associated protein 1 light chain 3 (LC3), and reduces viral genome replication and infectious particle production. The results further define the dependence of virus replication on increased metabolic capacity in target cells and identify CDK8 and CDK19 as master regulators of key metabolic genes. The common inhibition of CDK8 and CDK19 offers a host-directed therapeutic intervention that is unlikely to be overcome by viral evolution.

Keywords: CDK19; CDK8; LC3; Senexin; dengue virus; hexokinase; transcription; viral replication.


Conflict of interest statement

The authors declare no conflict of interest. The funders had no role in the design of the study; in the collection, analyses, or interpretation of data; in the writing of the manuscript, or in the decision to publish the results.

Figures

Figure 1
Figure 1
CDK8 is upregulated during DENV infection. (A,B) Huh7 cells were either mock-infected, infected with DENV at MOI 10, or treated with equivalent UV-inactivated DENV2 (UV-DENV) over a time course of 48 h. Total cellular RNA was collected at indicated time points after infection and analyzed by qRT-PCR for DENV RNA (A), and CDK8 mRNA expression (B), relative to the time of infection and normalized to the housekeeping gene, SDHA. Results are representative of two independent experiments. (C,D) CDK8 (C) and CDK19 (D) mRNA expression in mock or DENV-infected Huh7 cells after 36 h of infection at MOI 10 (n = 6 biological replicates; **** p < 0.0001 unpaired, two-tailed t test). Error bars represent mean +/− SEM). (E) Western blot analyses of 10 µg of total protein from nuclear extracts (Soluble Nuclear Extracts) and from the remaining, salt-extracted chromatin fraction (Chromatin-Bound Proteins) from cells collected every three hours for 24 h after infection. Antibody specificities are indicated as are the relative band densities of CDK8 versus Cyclin C and histone H3 phosphorylated at serine in position 10 (H3S10-P) versus total histone H3 (H3). Infection was confirmed by presence of nuclear DENV2 NS5. The results are representative of three separate time-course infections.
Figure 2
Figure 2
Knockdowns of CDK8 and CDK19 reduce DENV2 replication. (A) Western blot analysis of 10 µg of total protein from nuclear extracts of Huh7 cells transduced at an MOI of 1 with lentivirus-mediated non-target control or CDK8-targeted shRNA, CDK19-targeted shRNA, or cyclin C-targeted shRNA. (B) Lentivirus-transduced Huh7 cells were infected with DENV2 at MOI 1 for 24 h, and total cellular RNA analyzed by qRT-PCR for DENV RNA quantification relative to in vitro transcribed DENV genome equivalent (GE) standard curve (n = 3 biological replicates per group; ** p < 0.01; one-way ANOVA with Tukey’s multiple comparisons test. Error bars represent mean +/ SEM). (C) Relative optical density read in lentivirus-transduced Huh7 cells after four days of selection, then treated with CellTiter 96 Aqueous One Solution. (n = 4 biological replicates. * p < 0.05, **** p < 0.0001; one-way ANOVA with Dunnett’s test. Error bars represent mean +/ SEM). (D) Lentivirus-transduced Huh7 cells were infected with DENV2 at MOI 1 for 24 h, and total cellular RNA analyzed by qRT-PCR for DENV RNA quantification normalized to the housekeeping gene, SDHA, and relative to expression in non-target controls (n = 3 biological replicates per group; * p < 0.05, one-way ANOVA with Tukey’s multiple comparisons test. Error bars represent mean +/ SEM).
Figure 3
Figure 3
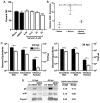
CDK8/19 Chemical inhibition reduces DENV2 replication. (A) Relative optical density of Huh7 cells after 72 h treatment with DMSO or Senexin A at indicated doses and addition of CellTiter 96 Aqueous One Solution. (n = 9 biological replicates. **** p < 0.0001 one-way ANOVA with Dunnett’s test. Error bars represent mean +/ SEM). (B) EGR1 mRNA levels in serum-starved and serum-stimulated Huh7 cells in the presence of DMSO or 12 μM Senexin A (n = 3 biological replicates; * p < 0.05, **** p < 0.0001 one-way ANOVA with Dunnett’s test; error bars represent mean +/− SEM). (C) DENV2 RNAs in total cellular RNA preparations (Intracellular RNA, GE) and in culture supernatants (Extracellular RNA, GE) were determined by qRT-PCR, and supernatant virus measured by plaque assay (Infectious Particles). Huh7 cells were infected with DENV2 (MOI = 1) for 24 or 36 hpi with DMSO or 12 or 25 μM Senexin A, respectively (n = 3 biological replicates; * p < 0.05, ** p < 0.01, *** p < 0.001, **** p < 0.0001; unpaired two-tailed t test; Error bars represent mean +/ SEM). (D) Western blot assays of supernatant virus pellets from cells infected with 10 MOI UV-treated DENV2 (UV), or with DENV2 without (DENV) or with 25 µM Senexin A (DENV/Sen) at 24 and 48 hpi. Antibody specificities are indicated. Relative band densities of DENV2 gE, prM, and capsid proteins in DENV2-infected, Senexin A-treated versus DENV2-infected virus preparations are indicated to the right of the indicated panels. Results are representative of three biological replicates for each time point.
Figure 4
Figure 4
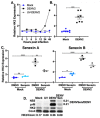
Senexin A reduces DENV2 induction of Hexokinase 2 expression. (A) Huh7 cells were either mock-infected or infected with DENV at MOI 10, and HK2 mRNA expression analyzed by qRT-PCR at indicated time points. Results are representative of two independent experiments. Expression is relative to time of infection and normalized to SDHA. (B) HK2 expression in mock vs. infected cells at 48 hpi (n = 7 biological replicates; *** p < 0.001 unpaired, two-tailed t test with Welch’s correction). Error bars represent mean +/− SEM. (C) HK2 mRNA expression in mock-infected and infected Huh7 cells treated with DMSO or 25 μM Senexin A or 12 μM Senexin B added at start of infection (MOI 10; 36 hpi). Expression relative to mock-infected, DMSO-treated cells and normalized to SDHA (n = 3 biological replicates; ** p < 0.01, **** p < 0.0001; one-way ANOVA with Tukey’s multiple comparisons test). Error bars represent mean +/− SEM. (D) Western blot analysis of cellular and viral protein abundance in 2 µg mitochondrial-enriched fractions from mock-infected cells (Mock), or cells with 10 MOI UV-treated DENV2 (UV) or DENV2 without (DENV) or with or 25 µM Senexin A (DENV/Sen). Antibody specificities are indicated as are the relative band densities of HK2 versus Cox4. Relative band densities of DENV2 NS5 and prM proteins in Senexin A-treated versus DMSO-treated, DENV2-infected cell preparations are indicated to the right of the indicated panels. Results are representative of six biological replicates.
Figure 5
Figure 5
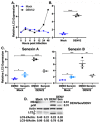
Senexin A reduces DENV2 induction of lipophagic gene expression. (A) Huh7 cells were either mock-infected or infected with DENV at MOI 10, and LC3 mRNA expression analyzed by qRT-PCR at indicated time points. Expression relative to time of infection, normalized to SDHA and representative of two independent time course experiments. (B) LC3 expression in mock vs. infected cells at 48 hpi (n = 3 biological replicates; *** p < 0.001 unpaired, two-tailed t test with Welch’s correction). Error bars represent mean +/− SEM. (C) LC3 mRNA expression in Huh7 cells mock-infected or infected with DENV2 at MOI 10 for 36 h with DMSO or 25 μM Senexin A or 12 μM Senexin B added at time of infection (relative to mock-infected, DMSO-treated cells and normalized to SDHA; n = 3 biological replicates. * p < 0.05, ** p < 0.01, *** p < 0.001, **** p < 0.0001; one-way ANOVA with Tukey’s multiple comparisons test). Error bars represent mean +/− SEM. (D) Western blot analysis of cellular and viral protein abundance in 2 µg cytoplasmic extracts from mock-infected cells (Mock), or cells with 10 MOI UV-treated DENV2 (UV) or DENV2 without (DENV) or with or 25 µM Senexin A (DENV/Sen). Antibody specificities are indicated as are the relative band densities of LC3-I and LC3-II versus Cox4. Relative band densities of DENV2 NS3 and prM proteins in Senexin A-treated versus DMSO-treated, DENV2-infected cell preparations are indicated to the right of the indicated panels. Results are representative of six biological replicates.
Figure 6
Figure 6
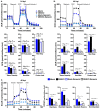
Senexin A inhibits mitochondrial respiration. Huh7 cells were either mock-infected or infected with DENV2 at an MOI of 10 with or without DMSO or 12.5 µM Senexin A for 24 or 48 h. (A,B) Normalized oxygen consumption rate (OCR) was measured over time during mitochondrial stress tests. Specific values determined by the mitochondrial stress test (Basal rate, ATP production, Maximum Respiration, Spare Capacity, Proton Leak, and Non-Mitochondrial Respiration) are presented. (C) Normalized extracellular acidification rate (ECAR) was measured over time during a glucose stress test at 48 hpi. Specific values determined in the glucose stress test (Glycolysis levels, Glycolytic Capacity, Glycolytic Reserve, and Non-Glycolytic Capacity) are presented. Results were normalized to viable cell numbers after metabolic measurements. Parameters for individual measurements are presented in the methods (* p < 0.05, ** p < 0.01, *** p < 0.001, **** p < 0.0001 one-way ANOVA with Tukey’s multiple comparisons test. n = 3 biological replicates). Error bars represent mean +/ SEM.

Similar articles

Cited by

References

    1. World Health Organization Dengue and Severe Dengue. [(accessed on 20 January 2020)]; Available online: https://www.who.int/news-room/fact-sheets/detail/dengue-and-severe-dengue.
    1. World Health Organization. Pan American Health Organization Epidemiological Update: Dengue. [(accessed on 13 November 2019)]; Available online: http://www.paho.org.
    1. Mayer K.A., Stockl J., Zlabinger G.J., Gualdoni G.A. Hijacking the supplies: Metabolism as a novel facet of virus-host interaction. Front. Immunol. 2019;10:1533. doi: 10.3389/fimmu.2019.01533. - DOI - PMC - PubMed
    1. Moreno-Altamirano M.M.B., Kolstoe S.E., Sanchez-Garcia F.J. Virus control of cell metabolism for replication and evasion of host immune responses. Front. Cell. Infect. Microbiol. 2019;9:95. doi: 10.3389/fcimb.2019.00095. - DOI - PMC - PubMed
    1. Thaker S.K., Ch’ng J., Christofk H.R. Viral hijacking of cellular metabolism. BMC Biol. 2019;17:59. doi: 10.1186/s12915-019-0678-9. - DOI - PMC - PubMed

Publication types

MeSH terms