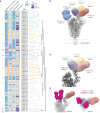
Potent neutralizing antibodies from COVID-19 patients define multiple targets of vulnerability
- PMID: 32540902
- PMCID: PMC7299281
- DOI: 10.1126/science.abc5902
Potent neutralizing antibodies from COVID-19 patients define multiple targets of vulnerability
Abstract
The rapid spread of severe acute respiratory syndrome coronavirus 2 (SARS-CoV-2) has had a large impact on global health, travel, and economy. Therefore, preventative and therapeutic measures are urgently needed. Here, we isolated monoclonal antibodies from three convalescent coronavirus disease 2019 (COVID-19) patients using a SARS-CoV-2 stabilized prefusion spike protein. These antibodies had low levels of somatic hypermutation and showed a strong enrichment in VH1-69, VH3-30-3, and VH1-24 gene usage. A subset of the antibodies was able to potently inhibit authentic SARS-CoV-2 infection at a concentration as low as 0.007 micrograms per milliliter. Competition and electron microscopy studies illustrate that the SARS-CoV-2 spike protein contains multiple distinct antigenic sites, including several receptor-binding domain (RBD) epitopes as well as non-RBD epitopes. In addition to providing guidance for vaccine design, the antibodies described here are promising candidates for COVID-19 treatment and prevention.
Copyright © 2020 The Authors, some rights reserved; exclusive licensee American Association for the Advancement of Science. No claim to original U.S. Government Works.
Figures


Similar articles
-
A neutralizing human antibody binds to the N-terminal domain of the Spike protein of SARS-CoV-2.Science. 2020 Aug 7;369(6504):650-655. doi: 10.1126/science.abc6952. Epub 2020 Jun 22. Science. 2020. PMID: 32571838 Free PMC article.
-
Potent neutralizing antibodies against multiple epitopes on SARS-CoV-2 spike.Nature. 2020 Aug;584(7821):450-456. doi: 10.1038/s41586-020-2571-7. Epub 2020 Jul 22. Nature. 2020. PMID: 32698192
-
Isolation of potent SARS-CoV-2 neutralizing antibodies and protection from disease in a small animal model.Science. 2020 Aug 21;369(6506):956-963. doi: 10.1126/science.abc7520. Epub 2020 Jun 15. Science. 2020. PMID: 32540903 Free PMC article.
-
Targeting SARS-CoV2 Spike Protein Receptor Binding Domain by Therapeutic Antibodies.Biomed Pharmacother. 2020 Oct;130:110559. doi: 10.1016/j.biopha.2020.110559. Epub 2020 Aug 1. Biomed Pharmacother. 2020. PMID: 32768882 Free PMC article. Review.
-
Receptor-binding domain-specific human neutralizing monoclonal antibodies against SARS-CoV and SARS-CoV-2.Signal Transduct Target Ther. 2020 Sep 22;5(1):212. doi: 10.1038/s41392-020-00318-0. Signal Transduct Target Ther. 2020. PMID: 32963228 Free PMC article. Review.
Cited by
-
Engineering a SARS-CoV-2 Vaccine Targeting the Receptor-Binding Domain Cryptic-Face via Immunofocusing.ACS Cent Sci. 2024 Sep 17;10(10):1871-1884. doi: 10.1021/acscentsci.4c00722. eCollection 2024 Oct 23. ACS Cent Sci. 2024. PMID: 39463836 Free PMC article.
-
Broad cross neutralizing antibodies against sarbecoviruses generated by SARS-CoV-2 infection and vaccination in humans.NPJ Vaccines. 2024 Oct 22;9(1):195. doi: 10.1038/s41541-024-00997-8. NPJ Vaccines. 2024. PMID: 39438493 Free PMC article.
-
Developing a workflow for the isolation of hybridoma cells producing fully human antigen-specific antibodies using a surface IgG detection method.Sci Rep. 2024 Oct 4;14(1):23138. doi: 10.1038/s41598-024-73770-5. Sci Rep. 2024. PMID: 39366976 Free PMC article.
-
Clonal landscape of autoantibody-secreting plasmablasts in COVID-19 patients.Life Sci Alliance. 2024 Sep 17;7(12):e202402774. doi: 10.26508/lsa.202402774. Print 2024 Dec. Life Sci Alliance. 2024. PMID: 39288992 Free PMC article.
-
A quadri-fluorescence SARS-CoV-2 pseudovirus system for efficient antigenic characterization of multiple circulating variants.Cell Rep Methods. 2024 Sep 16;4(9):100856. doi: 10.1016/j.crmeth.2024.100856. Epub 2024 Sep 6. Cell Rep Methods. 2024. PMID: 39243752 Free PMC article.
References
-
- Chen N., Zhou M., Dong X., Qu J., Gong F., Han Y., Qiu Y., Wang J., Liu Y., Wei Y., Xia J., Yu T., Zhang X., Zhang L., Epidemiological and clinical characteristics of 99 cases of 2019 novel coronavirus pneumonia in Wuhan, China: A descriptive study. Lancet 395, 507–513 (2020). 10.1016/S0140-6736(20)30211-7 - DOI - PMC - PubMed
-
- Mair-Jenkins J., Saavedra-Campos M., Baillie J. K., Cleary P., Khaw F.-M., Lim W. S., Makki S., Rooney K. D., Nguyen-Van-Tam J. S., Beck C. R.; Convalescent Plasma Study Group , The effectiveness of convalescent plasma and hyperimmune immunoglobulin for the treatment of severe acute respiratory infections of viral etiology: A systematic review and exploratory meta-analysis. J. Infect. Dis. 211, 80–90 (2015). 10.1093/infdis/jiu396 - DOI - PMC - PubMed
-
- Ko J. H., Seok H., Cho S. Y., Ha Y. E., Baek J. Y., Kim S. H., Kim Y. J., Park J. K., Chung C. R., Kang E.-S., Cho D., Müller M. A., Drosten C., Kang C.-I., Chung D. R., Song J.-H., Peck K. R., Challenges of convalescent plasma infusion therapy in Middle East respiratory coronavirus infection: A single centre experience. Antivir. Ther. 23, 617–622 (2018). 10.3851/IMP3243 - DOI - PubMed
-
- Shen C., Wang Z., Zhao F., Yang Y., Li J., Yuan J., Wang F., Li D., Yang M., Xing L., Wei J., Xiao H., Yang Y., Qu J., Qing L., Chen L., Xu Z., Peng L., Li Y., Zheng H., Chen F., Huang K., Jiang Y., Liu D., Zhang Z., Liu Y., Liu L., Treatment of 5 critically ill patients with COVID-19 with convalescent plasma. JAMA 323, 1582 (2020). 10.1001/jama.2020.4783 - DOI - PMC - PubMed
Publication types
MeSH terms
Substances
Grants and funding
LinkOut - more resources
Full Text Sources
Other Literature Sources
Miscellaneous

