Metabolic characteristics of CD8+ T cell subsets in young and aged individuals are not predictive of functionality
- PMID: 32504069
- PMCID: PMC7275080
- DOI: 10.1038/s41467-020-16633-7
Metabolic characteristics of CD8+ T cell subsets in young and aged individuals are not predictive of functionality
Erratum in
-
Publisher Correction: Metabolic characteristics of CD8+ T cell subsets in young and aged individuals are not predictive of functionality.Nat Commun. 2020 Jul 9;11(1):3517. doi: 10.1038/s41467-020-17441-9. Nat Commun. 2020. PMID: 32647122 Free PMC article.
Abstract
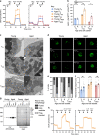
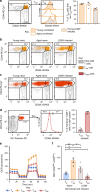
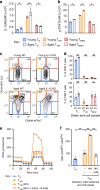
Virtual memory T (TVM) cells are antigen-naïve CD8+ T cells that exist in a semi-differentiated state and exhibit marked proliferative dysfunction in advanced age. High spare respiratory capacity (SRC) has been proposed as a defining metabolic characteristic of antigen-experienced memory T (TMEM) cells, facilitating rapid functionality and survival. Given the semi-differentiated state of TVM cells and their altered functionality with age, here we investigate TVM cell metabolism and its association with longevity and functionality. Elevated SRC is a feature of TVM, but not TMEM, cells and it increases with age in both subsets. The elevated SRC observed in aged mouse TVM cells and human CD8+ T cells from older individuals is associated with a heightened sensitivity to IL-15. We conclude that elevated SRC is a feature of TVM, but not TMEM, cells, is driven by physiological levels of IL-15, and is not indicative of enhanced functionality in CD8+ T cells.
Conflict of interest statement
The authors declare no competing interests.
Figures


Similar articles
-
Age-Related Decline in Primary CD8+ T Cell Responses Is Associated with the Development of Senescence in Virtual Memory CD8+ T Cells.Cell Rep. 2018 Jun 19;23(12):3512-3524. doi: 10.1016/j.celrep.2018.05.057. Cell Rep. 2018. PMID: 29924995
-
Perturbed CD8+ T cell immunity across universal influenza epitopes in the elderly.J Leukoc Biol. 2018 Feb;103(2):321-339. doi: 10.1189/jlb.5MA0517-207R. Epub 2017 Dec 29. J Leukoc Biol. 2018. PMID: 28928269
-
Hiding in Plain Sight: Virtually Unrecognizable Memory Phenotype CD8+ T cells.Int J Mol Sci. 2020 Nov 16;21(22):8626. doi: 10.3390/ijms21228626. Int J Mol Sci. 2020. PMID: 33207648 Free PMC article. Review.
-
Helminth Infection-Induced Increase in Virtual Memory CD8 T Cells Is Transient, Driven by IL-15, and Absent in Aged Mice.J Immunol. 2023 Feb 1;210(3):297-309. doi: 10.4049/jimmunol.2200316. J Immunol. 2023. PMID: 36524995
-
Stem cell-like plasticity of naïve and distinct memory CD8+ T cell subsets.Semin Immunol. 2009 Apr;21(2):62-8. doi: 10.1016/j.smim.2009.02.004. Epub 2009 Mar 9. Semin Immunol. 2009. PMID: 19269852 Review.
Cited by
-
Signals for antigen-independent differentiation of memory CD8+ T cells.Cell Mol Life Sci. 2021 Oct;78(19-20):6395-6408. doi: 10.1007/s00018-021-03912-9. Epub 2021 Aug 16. Cell Mol Life Sci. 2021. PMID: 34398252 Free PMC article. Review.
-
Exploring the immunomodulatory role of virtual memory CD8+ T cells: Role of IFN gamma in tumor growth control.Front Immunol. 2022 Oct 18;13:971001. doi: 10.3389/fimmu.2022.971001. eCollection 2022. Front Immunol. 2022. PMID: 36330506 Free PMC article.
-
Allotransplantation Is Associated With Exacerbation of CD8 T-Cell Senescence: The Particular Place of the Innate CD8 T-Cell Component.Front Immunol. 2021 Jul 21;12:674016. doi: 10.3389/fimmu.2021.674016. eCollection 2021. Front Immunol. 2021. PMID: 34367138 Free PMC article.
-
The effects of age and systemic metabolism on anti-tumor T cell responses.Elife. 2020 Nov 10;9:e62420. doi: 10.7554/eLife.62420. Elife. 2020. PMID: 33170123 Free PMC article. Review.
-
Virtual Memory CD8+ T Cells: Origin and Beyond.J Interferon Cytokine Res. 2022 Dec;42(12):624-642. doi: 10.1089/jir.2022.0053. Epub 2022 Sep 9. J Interferon Cytokine Res. 2022. PMID: 36083273 Free PMC article. Review.
References
-
- Almeida L, Lochner M, Berod L, Sparwasser T. Metabolic pathways in T cell activation and lineage differentiation. Semin. Immunol. 2016;28:514–524. - PubMed
Publication types
MeSH terms
LinkOut - more resources
Full Text Sources
Other Literature Sources
Medical
Molecular Biology Databases
Research Materials
Miscellaneous

