. 2020 Jun 25;181(7):1489-1501.e15.
doi: 10.1016/j.cell.2020.05.015. Epub 2020 May 20.

Targets of T Cell Responses to SARS-CoV-2 Coronavirus in Humans with COVID-19 Disease and Unexposed Individuals

Affiliations

Targets of T Cell Responses to SARS-CoV-2 Coronavirus in Humans with COVID-19 Disease and Unexposed Individuals

Alba Grifoni et al. Cell. .

Abstract

Understanding adaptive immunity to SARS-CoV-2 is important for vaccine development, interpreting coronavirus disease 2019 (COVID-19) pathogenesis, and calibration of pandemic control measures. Using HLA class I and II predicted peptide "megapools," circulating SARS-CoV-2-specific CD8+ and CD4+ T cells were identified in ∼70% and 100% of COVID-19 convalescent patients, respectively. CD4+ T cell responses to spike, the main target of most vaccine efforts, were robust and correlated with the magnitude of the anti-SARS-CoV-2 IgG and IgA titers. The M, spike, and N proteins each accounted for 11%-27% of the total CD4+ response, with additional responses commonly targeting nsp3, nsp4, ORF3a, and ORF8, among others. For CD8+ T cells, spike and M were recognized, with at least eight SARS-CoV-2 ORFs targeted. Importantly, we detected SARS-CoV-2-reactive CD4+ T cells in ∼40%-60% of unexposed individuals, suggesting cross-reactive T cell recognition between circulating "common cold" coronaviruses and SARS-CoV-2.

Keywords: CD4; CD8; COVID-19; SARS-CoV-2; T cells; coronavirus; cross-reactivity; epitopes.


Conflict of interest statement

Declaration of Interests The authors declare no competing interests.

Figures

None
Graphical abstract
Figure 1
Figure 1
SARS-CoV-2 IgM, IgA, and IgG Responses of Recovered COVID-19 Patients (A–C) Plasma ELISA titers to SARS-CoV-2 spike RBD. (A) IgG. (B) IgM. (C) IgA. Neg, unexposed donors from 2015–2018 (n = 20); COVID, convalescing COVID-19 patients (n = 20). All data are shown as ELISA titers based on a standard. The dotted line indicates limit of detection. Geometric mean titers with geometric SDs are indicated. (D–I) Immunophenotyping of mononuclear leukocytes. Frequency of (D) CD3+ total T cells, (E) CD4+ T cells (CD4+CD3+), (F) CD8+ T cells (CD8+CD3+), (G) CD19+ B cells (CD19+CD3), (H) CD3CD19 cells, and (I) CD14+CD16 monocytes (CD3CD19CD56) from the PBMCs of unexposed donors (Neg, n = 13) or convalescing COVID-19 patients (COVID, n = 14). Data were analyzed using the Mann-Whitney test with mean and standard deviation shown. p < 0.05, ∗∗∗∗p < 0.0001. See also Figures S1 and S2.
Figure S1
Figure S1
SARS-CoV-2 Spike Protein RBD Serology, Related to Figure 1 (A-C) ELISA curves for (A) IgG, (B) IgM, and (C) IgA from 10 representative donors. Five COVID-19 cases and (D-F) Area under the curve (AUC) SARS-CoV-2 spike protein RBD (D) IgG (E) IgM, and (F) IgA, ELISA quantitation, from the same donors and experiments shown in Figure 1. Geometric mean titers with geometric SDs are indicated. P values are two-tailed Mann-Whitney tests.
Figure S2
Figure S2
Phenotyping Flow Cytometry, Related to Figure 1 Representative gating of CD3+ T cells, CD19+ B cells, CD3-CD19- cells, CD4+ T cells, CD8+ T cells and CD14+ monocytes from donor PBMCs is shown. Briefly, mononuclear cells were gated out of all events followed by subsequent singlet gating. Live cells are gated as Zombie UV-. Cells were then gated as CD19-PE-Cy5+, CD3-buv395+ or CD19-CD3- cells. T cells were further subdivided into either CD8-buv805+ or CD4-PerCPefluor710+ populations. CD3-CD19- cells were defined as CD56-PE-Dazzlebright NK cells, CD56dimCD-16buv737+ NK cells or CD56- monocytes. Monocytes were further classified on differential expression of CD14-bv510 and CD16.
Figure 2
Figure 2
SARS-CoV-2-Specific CD4+ T Cell Responses of Recovered COVID-19 Patients (A) SARS-CoV-2-specific CD4+ T cells measured as percentage of AIM+ (OX40+CD137+) CD4+ T cells after stimulation of PBMCs with peptide pools encompassing spike only (Spike) MP or the CD4_R MP representing all the proteome without spike (Non-spike). Data were background subtracted against DMSO negative control and are shown with geometric mean and geometric standard deviation. Samples were from unexposed donors (Unexposed, n = 11) and recovered COVID-19 patients (COVID-19, n = 10). (B) Fluorescence-activated cell sorting (FACS) plot examples, gated on total CD4+ T cells. (C) AIM+ CD4+ T cell reactivity in COVID-19 cases between the negative control (DMSO) and antigen-specific stimulations. (D and E) Cytokine levels in the supernatant of PBMCs from COVID-19 donors after stimulation with peptide pools (Spike and Non-spike) or the negative control (DMSO). (D) IL-2. (E) IFN-γ. Statistical comparisons across cohorts were performed with the Mann-Whitney test. Pairwise comparisons (C–E) were performed with the Wilcoxon test. ∗∗p < 0.01; ∗∗∗p < 0.001. See also Figure S3 and Table S6.
Figure S3
Figure S3
SARS-CoV-2-Specific CD4+ T Cell Responses of Recovered COVID-19 Patients, Related to Figure 2 (A) Example flow cytometry gating strategy. (B) FACS plot examples for controls. DMSO negative control, CMV positive control, PHA positive control. (C) CMV-specific CD4+ T cells as percentage of AIM+ (OX40+CD137+) CD4+ T cells after stimulation of PBMCs with CMV peptide pool. Data were background subtracted against DMSO negative control and are shown with geometric mean and geometric standard deviation. Samples were from unexposed donors (“Unexposed,” n = 11) and recovered COVID-19 patients (“COVID-19,” n = 10). (D) Spearman correlation of SARS-CoV-2 spike−specific CD4+ T cells (AIM+ (OX40+CD137+) CD4+ T cells, background subtracted) after stimulation with spike pool run on the same donors in two independent experiment series run on different dates. COVID-19 patient samples shown in blue. Unexposed donor samples shown in black. (E-F) Stimulation index quantitation of AIM+ (OX40+CD137+) CD4+ T cells; the same samples as in Figure 2 and Figure S3C were analyzed. (G-H) Cytokine levels in the supernatants of AIM assays after stimulation with (G) Spike MP (MP_S), or (H) CD4-R (“Non-spike”). Data are shown in comparison to the negative control (DMSO), per donor. (I-J) Cytokine production by CD4+ T cells in response to Non-spike (CD4-R MP) or Spike (MP_S) peptide pools (“CoV antigen (Ag)”) was confirmed by analyzing cytokine secretion from the subset of COVID-19 donors determined to have low or negative CD8+ T cell responses (< 0.1% by AIM) to the same peptide pool determined positive for SARS-CoV-2−specific CD4+ T cells by AIM. (I) IL-2. (J) IFNγ. Statistical comparisons across cohorts were performed with the Mann-Whitney test, while paired sample comparisons were performed with the Wilcoxon test. ∗∗p < 0.01; ∗∗∗p < 0.001. ns not significant.
Figure 3
Figure 3
SARS-CoV-2-Specific CD8+ T Cell Responses by Recovered COVID-19 Patients (A) SARS-CoV-2-specific CD8+ T cells measured as percentage of AIM+ (CD69+CD137+) CD8+ T cells after stimulation of PBMCs with class I MPs (CD8-A, CD8-B, and the combined data [Total]). Data were background subtracted against DMSO negative control and are shown with geometric mean and geometric standard deviation. Samples were from unexposed donors (Unexposed, n = 11) and recovered COVID-19 patients (COVID-19, n = 10). (B) FACS plot examples. (C) Percentage of CD8+ T cells producing IFN-γ in response to SARS-CoV-2 MPs, or CMV MP, in PBMCs from COVID-19 and unexposed donors after background subtraction. Data are shown with geometric mean and geometric standard deviation. (D) Functional profile of IFN-γ+CD8+ T cells producing granzyme B (GzB), TNF-α (TNF), or IL-10 in response to SARS-CoV-2 MPs. Mean and SD are shown. (E) FACS plot examples of IFN-γ and granzyme B co-expression. Statistical comparisons across cohorts were performed with the Mann-Whitney test. p < 0.05; ∗∗p < 0.01.; ns not significant. See also Figure S4 and Table S6.
Figure S4
Figure S4
SARS-CoV-2-Specific CD8+ T Cell Responses of Recovered COVID-19 Patients, Related to Figure 3 (A) Flow cytometry gating strategy. (B) SARS-CoV-2−specific CD8+ T cells as determined by AIM+ (CD69+CD137+) CD8+ T cells. Response of PBMCs from COVID-19 cases between the negative control (DMSO) and antigen specific stimulation. (C) CMV-specific CD8+ T cells as percentage of AIM+ (CD69+CD137+) CD8+ T cells after stimulation of PBMCs with CMV peptide pool. Data were background subtracted against DMSO negative control and are shown with geometric mean and geometric standard deviation. Samples were from unexposed donors (“Unexposed,” n = 11) and recovered COVID-19 patients (“COVID-19,” n = 10). (D-E) Stimulation index quantitation of AIM+ (CD69+CD137+) CD8+ T cells; the same samples as in Figure 2 and Figure S4C were analyzed. Statistical comparisons across cohorts were performed with the Mann-Whitney test, while paired sample comparisons were performed with the Wilcoxon test. ∗∗p < 0.01; ∗∗∗p < 0.001. ns not significant.
Figure 4
Figure 4
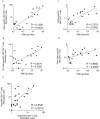
Correlations between SARS-CoV-2-Specific CD4+ T Cells, Antibodies, and CD8+ T Cells (A) Correlation between SARS-CoV-2 spike-specific CD4+ T cells (%) and anti-spike RBD IgG. (B) Correlation between SARS-CoV-2 non-spike-specific CD4+ T cells (%) and anti-spike RBD IgG. (C) Correlation between SARS-CoV-2-specific CD4+ T cells and SARS-CoV-2-specific CD8+ T cells. Total MP responses per donor were used in each case (“Non-spike” + “spike” (CD4_R + MP_S) for CD4+ T cells, CD8_A + CD8_B for CD8+ T cells). Statistical comparisons were performed using Spearman correlation. See also Figure S5.
Figure S5
Figure S5
Correlations between SARS-CoV-2-Specific CD4+ T Cells, Antibodies, and CD8+ T Cells, Related to Figure 4 (A) Correlation between SARS-CoV-2 spike−specific CD4+ T cells and anti-spike RBD IgG, using CD4+ T cell stimulation index. (B) Correlation between SARS-CoV-2 non-spike−specific CD4+ T cells and anti-spike RBD IgG, using CD4+ T cell stimulation index. (C) Correlation between SARS-CoV-2 spike−specific CD4+ T cells (%) and anti-spike RBD IgA. (D) Correlation between SARS-CoV-2 spike−specific CD4+ T cells (%) and anti-spike RBD IgA. (E) Correlation between SARS-CoV-2−specific CD4+ T cells and SARS-CoV-2−specific CD8+ T cells, using stimulation index. Total MP responses per donor were used in each case (“Non-spike” + “spike” (CD4_R + MP_S) for CD4+ T cells, CD8-A + CD8-B for CD8+ T cells). Statistical comparisons were performed using Spearman correlation.
Figure 5
Figure 5
SARS-CoV-2 Epitope Reactivity in Unexposed Individuals (A) SARS-CoV-2-reactive CD4+ T cells measured as percentage of AIM+ (OX40+CD137+) CD4+ T cells in unexposed (n = 11) donors. (B) FACS plot examples, gated on total CD4+ T cells. (C) Plasma IgG ELISAs for seroreactivity to RBD of HCoV-OC43 or HCoV-NL63. Data are expressed as geometric mean and geometric SD. Pairwise statistical comparisons (A) were performed with the Wilcoxon test. p < 0.05; ns, not significant.
Figure 6
Figure 6
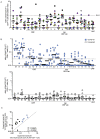
Protein Immunodominance of SARS-CoV-2-Specific CD4+ and CD8+ T Cells in COVID-19 Cases and Unexposed Donors (A) SARS-CoV-2 genome organization and predicted viral protein abundance in infected cells. (B) SARS-CoV-2 antigen-specific CD4+ T cells (AIM+, OX40+CD137+) quantified by stimulation index, using a peptide pool for each viral protein (with two exceptions, see Table S1). COVID-19 cases (top, in blue. n = 10) and unexposed donors (bottom, in white. n = 10). Data are expressed as geometric mean and geometric SD. (C) Fraction of SARS-CoV-2 proteins recognized by CD4+ T cells in COVID-19 cases (top) and unexposed donors (bottom). (D) SARS-CoV-2 antigen-specific CD4+ T cells (AIM+, OX40+CD137+) quantified by stimulation index, using a peptide pool for each viral protein (with two exceptions, see Table S1). COVID-19 cases (top, in red. n = 10) and unexposed donors (bottom, in gray. n = 10). Data are expressed as geometric mean and geometric SD. (E) Fraction of SARS-CoV-2 proteins recognized by CD8+ T cells in COVID-19 cases (top) and unexposed donors (bottom). See also Figures S6 and S7 and Table S6.
Figure S6
Figure S6
Protein Immunodominance of SARS-CoV-2 Specific CD4+ T Cells in Recovered COVID-19 Patients and Unexposed Donors, Related to Figure 6 (A) The same data as Figure 6B, but with each unexposed donor color coded. (B) The same experiment as Figure 6B, but with SARS-CoV-2−specific CD4+ T cells measured as percentage of AIM+ (OX40+CD137+) CD4+ T cells, after background subtraction. COVID-19 cases (top, in blue. n = 10) and unexposed donors (bottom, in white. n = 10). (C) Correlation of SARS-CoV-2−specific CD4+ T cells detected using the epitope prediction approach (CD4_R MP) compared against the sum total of all antigen pools of overlapping peptides (excluding spike), run with samples from the same donors in two different experiment series. Dotted line indicates 1:1 concordance. Statistical comparison was performed using Spearman correlation.
Figure S7
Figure S7
Protein Immunodominance of SARS-CoV-2-Specific CD8+ T Cells in Recovered COVID-19 Patients and Unexposed Donors, Related to Figure 6 (A) The same data as Figure 6D, but with each unexposed donor color coded. (B) The same experiment as Figure 6D, but with SARS-CoV-2−specific CD8+ T cells measured as percentage of AIM+ (CD69+CD137+) CD8+ T cells, after background subtraction. COVID-19 cases (top, in red. n = 10) and unexposed donors (bottom, in gray. n = 10).

Comment in

Similar articles

Cited by

References

    1. Alshukairi A.N., Zheng J., Zhao J., Nehdi A., Baharoon S.A., Layqah L., Bokhari A., Al Johani S.M., Samman N., Boudjelal M. High Prevalence of MERS-CoV Infection in Camel Workers in Saudi Arabia. MBio. 2018;9 e01985–e01918. - PMC - PubMed
    1. Amanat F., Krammer F. SARS-CoV-2 Vaccines: Status Report. Immunity. 2020;52:583–589. - PMC - PubMed
    1. Andrews S.F., Huang Y., Kaur K., Popova L.I., Ho I.Y., Pauli N.T., Henry Dunand C.J., Taylor W.M., Lim S., Huang M. Immune history profoundly affects broadly protective B cell responses to influenza. Sci. Transl. Med. 2015;7:316ra192. - PMC - PubMed
    1. Bancroft T., Dillon M.B., da Silva Antunes R., Paul S., Peters B., Crotty S., Lindestam Arlehamn C.S., Sette A. Th1 versus Th2 T cell polarization by whole-cell and acellular childhood pertussis vaccines persists upon re-immunization in adolescence and adulthood. Cell. Immunol. 2016;304-305:35–43. - PMC - PubMed
    1. Blanco-Melo D., Nilsson-Payant B.E., Liu W.-C., Møller R., Panis M., Sachs D., Albrecht R.A., tenOever B.R. SARS-CoV-2 launches a unique transcriptional signature from in vitro, ex vivo, and in vivo systems. bioRxiv. 2020 doi: 10.1101/2020.03.24.004655. - DOI

MeSH terms