. 2020 Jul 1;205(1):223-236.
doi: 10.4049/jimmunol.1800933. Epub 2020 May 29.

Triggering of the cGAS-STING Pathway in Human Plasmacytoid Dendritic Cells Inhibits TLR9-Mediated IFN Production

Affiliations

Triggering of the cGAS-STING Pathway in Human Plasmacytoid Dendritic Cells Inhibits TLR9-Mediated IFN Production

Pratik Deb et al. J Immunol. .

Abstract

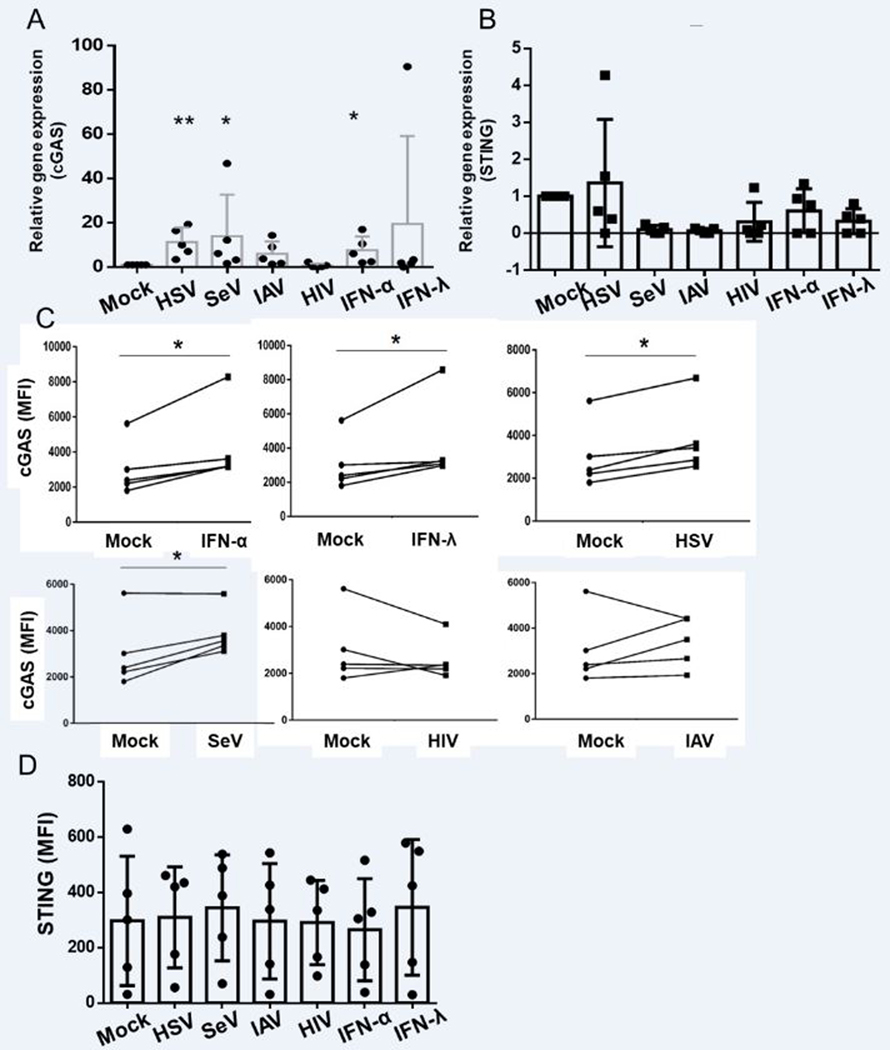
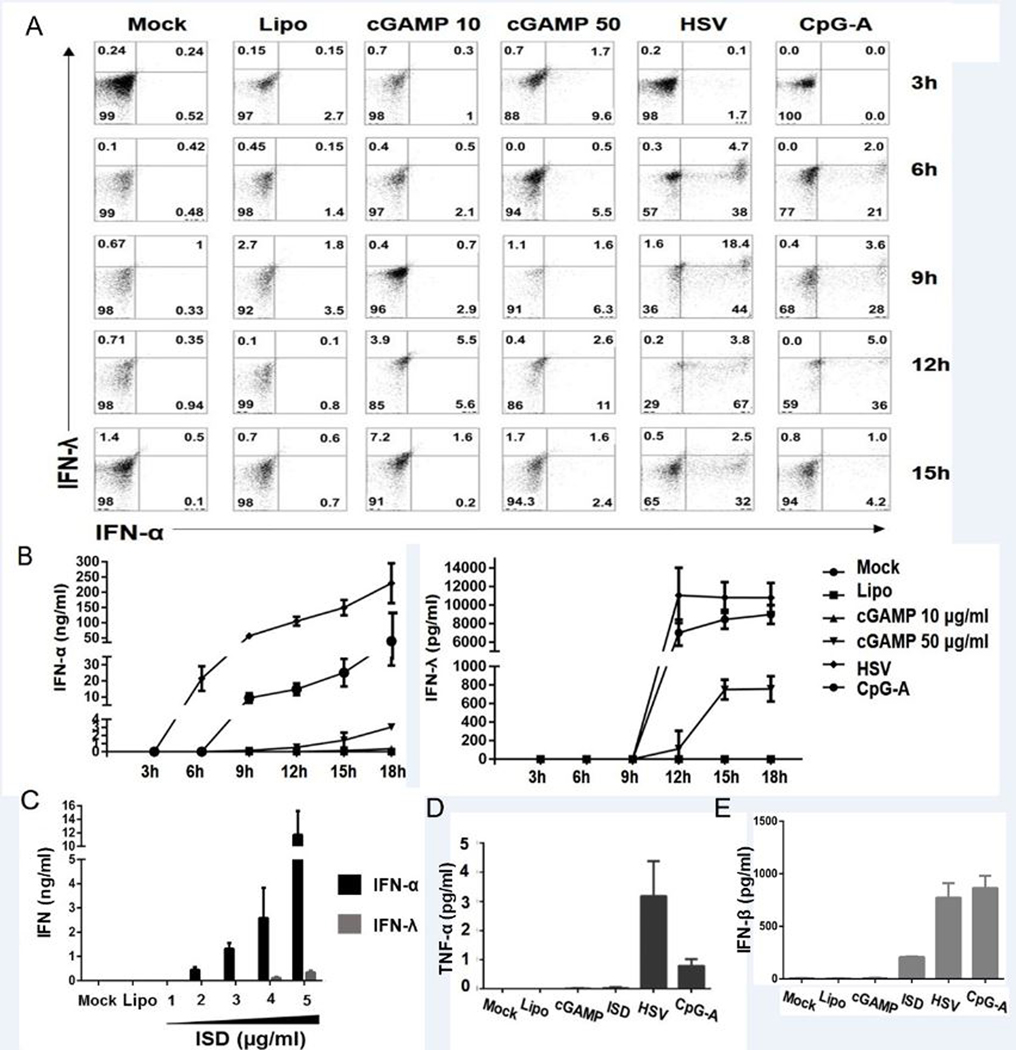
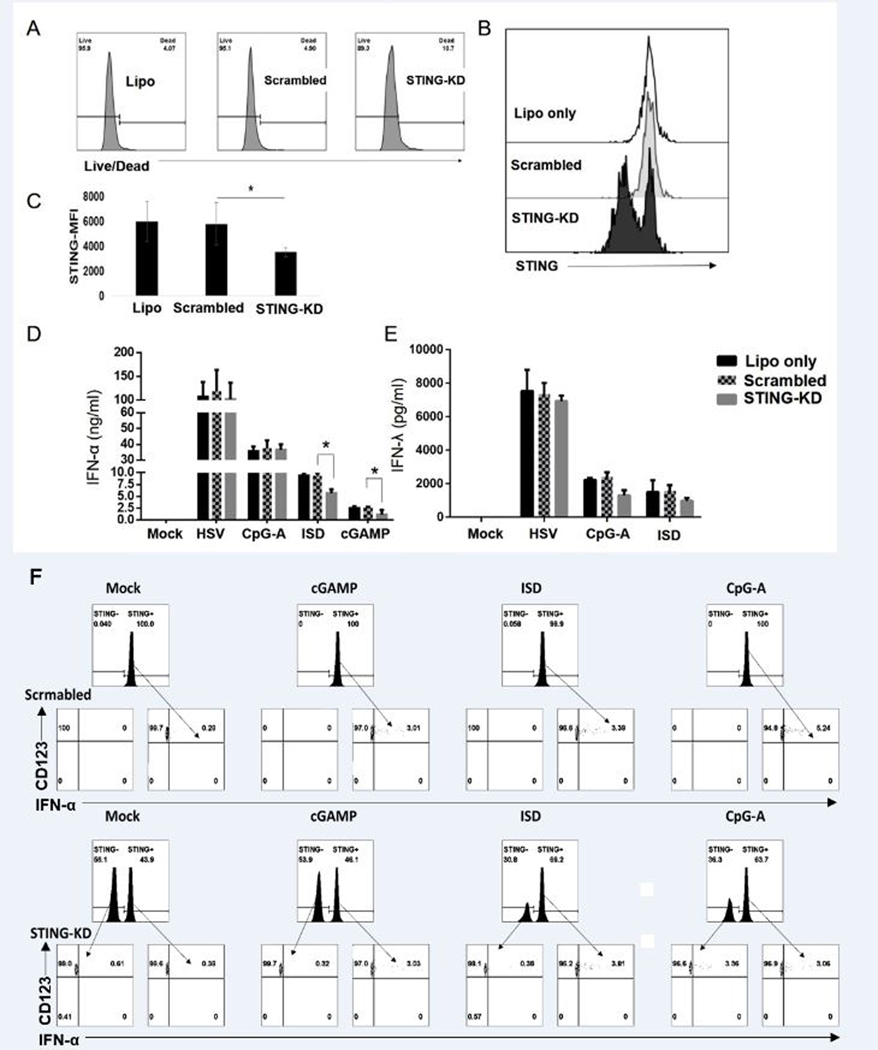
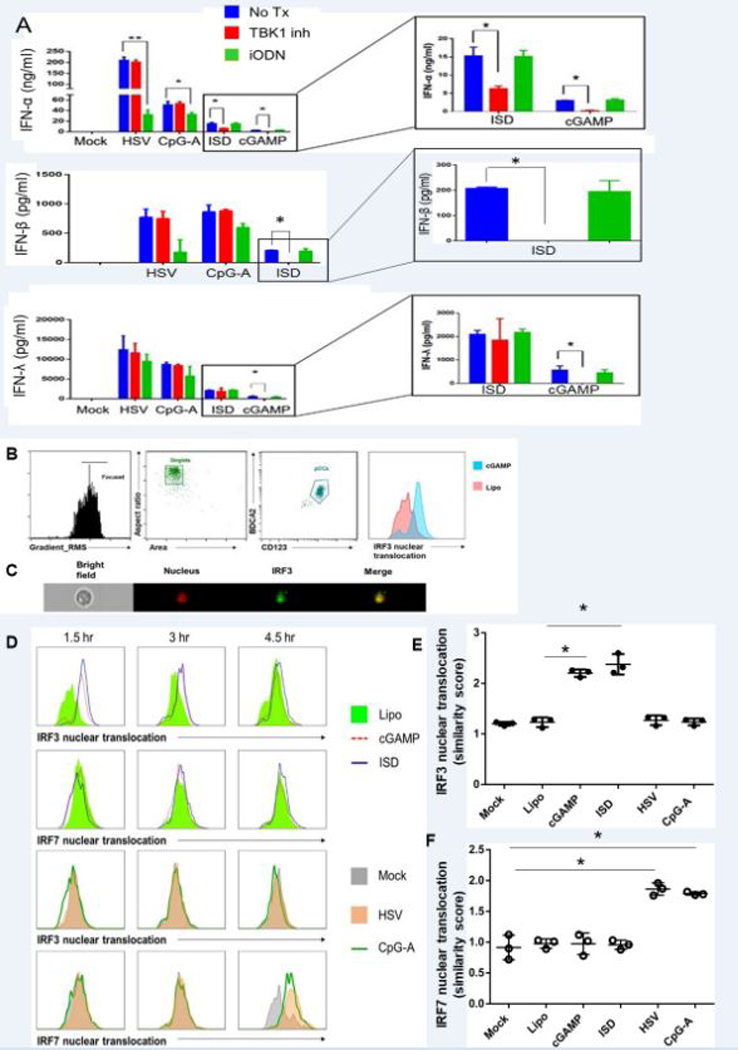
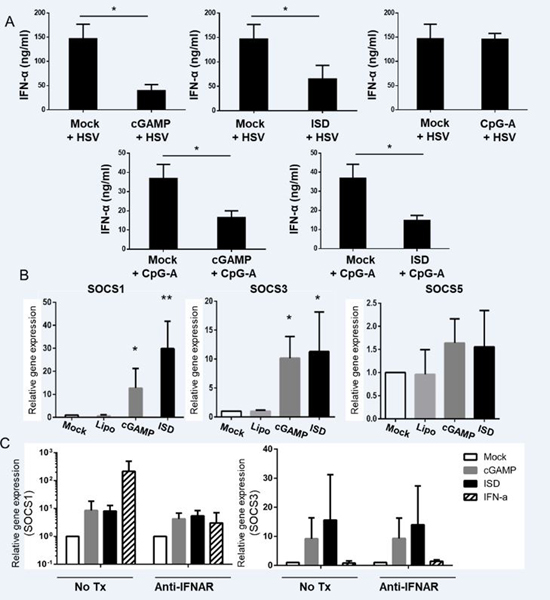
Plasmacytoid dendritic cells (pDCs) are potent producers of type I and type III IFNs and play a major role in antiviral immunity and autoimmune disorders. The innate sensing of nucleic acids remains the major initiating factor for IFN production by pDCs. TLR-mediated sensing of nucleic acids via endosomal pathways has been studied and documented in detail, whereas the sensing of DNA in cytosolic compartment in human pDCs remains relatively unexplored. We now demonstrate the existence and functionality of the components of cytosolic DNA-sensing pathway comprising cyclic GMP-AMP (cGAMP) synthase (cGAS) and stimulator of IFN gene (STING) in human pDCs. cGAS was initially located in the cytosolic compartment of pDCs and time-dependently colocalized with non-CpG double-stranded immunostimulatory DNA (ISD). Following the colocalization of ISD with cGAS, the downstream pathway was triggered as STING disassociated from its location at the endoplasmic reticulum. Upon direct stimulation of pDCs by STING agonist 2'3' cGAMP or dsDNA, pDC-s produced type I, and type III IFN. Moreover, we documented that cGAS-STING-mediated IFN production is mediated by nuclear translocation of IRF3 whereas TLR9-mediated activation occurs through IRF7. Our data also indicate that pDC prestimulation of cGAS-STING dampened the TLR9-mediated IFN production. Furthermore, triggering of cGAS-STING induced expression of SOCS1 and SOCS3 in pDCs, indicating a possible autoinhibitory loop that impedes IFN production by pDCs. Thus, our study indicates that the cGAS-STING pathway exists in parallel to the TLR9-mediated DNA recognition in human pDCs with cross-talk between these two pathways.


Figures

FIGURE 1.
FIGURE 1.
Human pDCs constitutively express cGAS and STING. (A) cGAS and STING transcript level in human pDCs with respect to THP1 cells ( positive control) and HEK293T cells (negative control): Total RNA was extracted from purified pDC, THP1 and HEK293T cells, mRNA was reverse transcribed to cDNA and expression level of cGAS and STING was measured by qRT-PCR Data represent mean ± 1 SD, (n = 3 independent experiments). (B) Protein expression of cGAS and STING in human pDCs. pDCs were distinguished among PBMCs as CD123+BDCA2+ cells. Singlet pDCs were gated from the double-positive population and cGAS and STING expression was measured via intracellular staining. STING expression was measured against the background of specific isotype and cGAS expression was measured against the secondary antibody (Goat anti-rabbit FITC) without the primary anti-cGAS antibody. Spade analysis showing relative expression of (C) cGAS and (D) STING in different subsets of human PBMCs. PBMCs were stained for CD3, CD4, CD8, CD19, CD14, CD123, and BDCA2 to identify CD4+ and CD8+ T cells, B cells, monocytes and pDCs. Cells were permeabilized and stained for cGAS and STING and spade analysis was performed to determine relative expression. The colors represent relative expression of proteins as a heat-map where blue represents low expression, green represents intermediate expression, and red and yellow represent high expression.
FIGURE 2.
FIGURE 2.
Stimulation with viruses and interferons upregulate cGAS but not STING expression in pDCs (A, B) Purified pDCs were stimulated with HSV, SeV, IAV, HIV, IFN-α, or IFN-λ for 4 hours. Total RNA was collected and cDNA was prepared. qPCR was performed to test how the expression of cGAS and STING is altered following each stimulation and are expressed relative to mock (n = 5 independent experiments). (C, D) PBMCs were incubated with IFN-α, IFN-λ, HSV, SeV, IAV, and HIV for 8 hours and expression of (C) cGAS and (D) STING in pDC (CD123+/BDCA2+ cells) were measured by flow cytometry and data expressed as the median fluorescent intensity (MFI) for the mock vs. stimulated pairs, with each donor represented by a line (n=5 independent experiments). Pairwise T tests were performed to test both mRNA and protein expression affected by each stimulation as compared to Mock.
FIGURE 3.
FIGURE 3.
cGAS co-localizes with dsDNA in a time-dependent manner, while STING resides in the ER and dissociates upon stimulation of the upstream pathway. pDCs were isolated from peripheral blood of healthy donors and transfected with FITC-conjugated ISD or ssDNA. Co-localization of DNA and cGAS was determined by Amnis ImageStream. (A) Schemata of identification of pDCs among PBMC population. Single cells are selected out of PBMCs, first by plotting the population with area vs. aspect ratio. Next, focused singlets were determined by plotting the single cells with area vs. side scatter. Finally, pDCs were identified out of focused singlets as CD123+BDCA2+ cells. (B) Sample histograms showing co-localization between cGAS and DNA by bright detail similarity score in time-dependent manner. (C) Representative image of a single cell showing cGAS and dsDNA co-localization. (D) Quantification of co-localization between cGAS and DNA by bright detail similarity score. One way ANOVA was performed between all groups, and then post-hoc T tests were performed. Each dot represents an individual experiment (n = 3). (E, F) pDCs were purified and transfected with unconjugated ISD or ssDNA for 2 hours, fixed overnight, permeabilized, and stained for Calnexin and STING. (E) Histogram of Calnexin and STING co-localization with or without DNA transfection (Data represents one of two independent experiment). (F) Representative images of single cells showing Calnexin and STING co-localization with or without DNA transfection.
FIGURE 4.
FIGURE 4.
pDCs produce type-I and type-III interferon, but not TNF-α, upon stimulation of cGAS-STING pathway. (A)Purified pDCs were stimulated for 3, 6, 9, 12, and 15 hr. with cyclic GMP-AMP (cGAMP), HSV and the TLR9 agonist CpG-A and the expression of IFN-α and IFN-λ were tested via flow cytometry. BFA was added 2 hrs prior to each time point. Cells were stained for pDC markers, fixed, permeabilized, stained for intracellular cytokines and acquired by flow cytometer. Data are from a representative experiment from two individual donors. (B) Purified pDCs (0.25 × 10⁶ cells/ml) were stimulated with HSV, CpG-A or lipofected with cGAMP (10 and 50 μg/ml) and supernatant was collected at each time point to perform ELISA for IFN-α and IFN-λ. Data are shown as mean ± 1 SD (n = 3 independent experiments). (C) pDCs were lipofected with ISD for 18 hours. Supernatants were collected and production of IFN-α and IFN-λ was measured by ELISA. Data are shown as mean ± 1 SD (n = 3 independent experiments). (C) pDCs were lipofected with ISD for 18 hours. Supernatants were collected and production of IFN-α was measured by ELISA. Data are shown as mean ± 1 SD (n = 3 independent experiments). (D, E) pDCs were stimulated with HSV, CpG-A or lipofected with cGAMP (50 μg/ml) or ISD (5 μg/ml) for 18 hours. Supernatants were collected and production of (D) TNF-α and (E) IFN-β was measured by ELISA. Data are shown as mean ± 1 SD (n = 3 independent experiments).
FIGURE 5.
FIGURE 5.
STING knock-down of pDCs down-regulates interferon production upon ISD or cGAMP stimulation. pDCs were lipofected with siRNA targeting STING or scrambled siRNA for 24 hours. (A) The survival of pDCs was measured via live/dead staining by flow cytometry. (B) Sample histograms showing the efficacy of knock-down of STING. (C) Summary data for STING expression (MFI) in pDCs lipofected with or without siRNA targeting STING or scrambled siRNA (n=3 independent experiments). (D, E) pDCs incubated with siRNA for 24 hours were washed and resuspended in fresh media and stimulated with HSV, CpG-A, ISD, and cGAMP for another 24 hours. Supernatants were collected and ELISA was performed to measure IFN-α and IFN-λ (n = 3 indepdendent experiments). (F) pDCs lipofected with scrambled siRNA or siRNA targeting STING for 48 hours were washed, resuspended in media, and stimulated with cGAMP or ISD for 3 hours, or CpG-A for 6 hours. IFN-α production by pDCs were measured via flow cytometry (Data represents of one of 2 independent experiments).
FIGURE 6.
FIGURE 6.
cGAS-STING pathway mediated interferon production in pDCs is dependent on the TBK1-IRF3 axis. (A) Purified pDCs were pre-treated for 6 hours with TBK1 inhibitor (BX795) or TLR9 inhibitor (iODN) and stimulated with HSV, CpG-A or ISD for 18 hours. Supernatants were collected and ELISAs for IFN-α and IFN-λ were performed. (B, C, D) pDCs transfected with cGAMP or ISD were stained for surface markers, fixed, permeabilized, and stained for nucleus (DRAQ5) and IRF3 or IRF7 and acquired via Amnis ImageStream. (B) Gating strategy showing how pDCs were identified among single-cells as CD123+BDCA2+ cells. Nuclear co-localization was seen in pDCs expressing IRF3. (C) Single cell image of an interferon producing pDC showing nuclear co-localization of IRF3 upon cGAMP stimulation. (D) Nuclear translocation of IRF3 and IRF7 upon cGAMP, ISD, HSV, and CpG-A stimulation was measured at 1.5, 3, and 4.5 hrs. (E,F) Quantification of nuclear translocation of IRF3 and IRF7 upon different stimuli. Each dot represents one independent experiment.
FIGURE 7.
FIGURE 7.
Pre-stimulation of cGAS-STING pathway inhibits TLR9-mediated cytokine production in pDCs probably by inducing SOCS1/3 but not SOCS5. (A) pDCs were stimulated for 6 hours for cGAS-STING pathway (via cGAMP or ISD) or TLR9 pathway (via CpG-A) followed by stimulation with HSV or CpG-A for 18 hours. Supernatants were collected and ELISAs were performed to measure IFN-α (n =3 independent experiments). (B) pDCs stimulated with cGAMP or ISD for 3 hours and qRT-PCR was performed to measure the induction of SOCS1, SOCS3, and SOCS5. (n =3 independent experiments) (C) pDCs pre-treated with or without anti IFNAR antibody for 1 hour were stimulated with cGAMP, ISD, or IFN-α for 3 hours. qRT-PCR was performed to measure the induction of SOCS1 and SOCS3 (n = 3 independent experiments).

Similar articles

Cited by

References

    1. Siegal FP, Kadowaki N, Shodell M, Fitzgerald-Bocarsly PA, Shah K, Ho S, Antonenko S, and Liu YJ. 1999. The nature of the principal type 1 interferon-producing cells in human blood. Science 284: 1835–1837. - PubMed
    1. Fitzgerald-Bocarsly P, Dai J, and Singh S. 2008. Plasmacytoid dendritic cells and type I IFN: 50 years of convergent history. Cytokine Growth Factor Rev 19: 3–19. - PMC - PubMed
    1. Izaguirre A, Barnes BJ, Amrute S, Yeow WS, Megjugorac N, Dai J, Feng D, Chung E, Pitha PM, and Fitzgerald-Bocarsly P. 2003. Comparative analysis of IRF and IFN-alpha expression in human plasmacytoid and monocyte-derived dendritic cells. J Leukoc Biol 74: 1125–1138. - PubMed
    1. Coccia EM, Severa M, Giacomini E, Monneron D, Remoli ME, Julkunen I, Cella M, Lande R, and Uze G. 2004. Viral infection and Toll-like receptor agonists induce a differential expression of type I and lambda interferons in human plasmacytoid and monocyte-derived dendritic cells. Eur J Immunol 34: 796–805. - PubMed
    1. Yin Z, Dai J, Deng J, Sheikh F, Natalia M, Shih T, Lewis-Antes A, Amrute SB, Garrigues U, Doyle S, Donnelly RP, Kotenko SV, and Fitzgerald-Bocarsly P. 2012. Type III IFNs are produced by and stimulate human plasmacytoid dendritic cells. J Immunol 189: 2735–2745. - PMC - PubMed

Publication types

MeSH terms