. 2020 May 26;12(6):583.
doi: 10.3390/v12060583.

The Nuclear Pore Complex: A Target for NS3 Protease of Dengue and Zika Viruses

Affiliations

The Nuclear Pore Complex: A Target for NS3 Protease of Dengue and Zika Viruses

Luis Adrián De Jesús-González et al. Viruses. .

Abstract

During flavivirus infection, some viral proteins move to the nucleus and cellular components are relocated from the nucleus to the cytoplasm. Thus, the integrity of the main regulator of the nuclear-cytoplasmic transport, the nuclear pore complex (NPC), was evaluated during infection with dengue virus (DENV) and Zika virus (ZIKV). We found that while during DENV infection the integrity and distribution of at least three nucleoporins (Nup), Nup153, Nup98, and Nup62 were altered, during ZIKV infection, the integrity of TPR, Nup153, and Nup98 were modified. In this work, several lines of evidence indicate that the viral serine protease NS2B3 is involved in Nups cleavage. First, the serine protease inhibitors, TLCK and Leupeptin, prevented Nup98 and Nup62 cleavage. Second, the transfection of DENV and ZIKV NS2B3 protease was sufficient to inhibit the nuclear ring recognition detected in mock-infected cells with the Mab414 antibody. Third, the mutant but not the active (WT) protease was unable to cleave Nups in transfected cells. Thus, here we describe for the first time that the NS3 protein from flavivirus plays novel functions hijacking the nuclear pore complex, the main controller of the nuclear-cytoplasmic transport.

Keywords: NS3; dengue; nuclear pore complex; nucleus; zika.


Conflict of interest statement

The authors declare no conflict of interest.

Figures

Figure 1
Figure 1
Zika virus (ZIKV) infection induces challenge in envelope nuclear in Huh-7 cells. Transmission electron microscopy of (A) mock-infected cells or (B) infected cells with ZIKV and (C) dengue virus (DENV 2) for 24 h. (D) The graphs represent the results of diffraction contrast expressed as arbitrary units and the error bars show the SD of three independent experiments. * p ≤ 0.05; *** p ≤ 0.001, n = 10 per group. Ne, nuclear envelope; Nu, nucleus; ER, endoplasmic reticulum; VE, double-membrane vesicles; LD, lipid droplets.
Figure 2
Figure 2
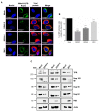
The integrity of the nuclear pore complex is altered after DENV and ZIKV infection. (A) Huh-7 cells mock-infected (Mock) or infected with DENV2, DENV4, or ZIKV for 48 hrs, were incubated with the monoclonal antibody against the FG-rich sequence of nucleoporins, Mab414, and analyzed by confocal microscopy. Anti-ZIKV-NS3 and anti-DENV-NS5 antibodies were used as controls of infection. Nuclei were stained with Hoechst. Representative images of three independent experiments are presented. (B) The graphs represent the results expressed as a percentage of Mock-normalized mean fluorescence intensity (MFI) arbitrary units and the error bars show the SD of three independent experiments. **** p ≤ 0.0001, n = 30 per group. (C) Levels of TPR, Nup153, Nup98, and Nup62 proteins were analyzed by Western blot in whole-cell lysates obtained from mock- and DENV2-, DENV4-, and ZIKV-infected cells for 24 hrs. The anti-NS3 antibody was used as a control of infection and anti-actin as a loading control. Representative Western blot assays of three independent experiments are presented.
Figure 3
Figure 3
The integrity and location of the Nup62 are altered during DENV infection. (A) Huh-7 cells mock-infected (Mock) or infected with DENV2 or DENV4 for 48 hrs were incubated with a monoclonal anti-Nup62 antibody and analyzed by confocal microscopy. The anti-E protein antibody was used as control of infection. Nuclei were stained with Hoechst. Representative images of three independent experiments are presented. White boxes represent zoom areas. Arrows indicate non-infected cells, and plus signs indicate infected cells. (B) The graphs represent the results expressed as a percentage of Mock-normalized mean fluorescence intensity (MFI) arbitrary units and the error bars show the SD of three independent experiments. **** p = ≤ 0.0001, n = 30 per group. (C) Levels of Nup62 protein were analyzed by Western blot in whole-cell lysates from mock or DENV2 or DENV4, infected cells for 12, 24, and 48 hrs. The anti-NS3 antibody was used as a control of infection and anti-actin as a loading control. Representative Western blot assays from three independent experiments are presented. The graph represents Nup62 protein levels compared with β-actin. Protein amount values from control (mock-infected) were adjusted to a value of 1. Values for expression in infected cells (white) were then expressed as a number relative to the control. Data are means and the error bars show the SEM of n = 3 independent experiments performed by duplicate. * p < 0.05, ** p < 0.001.
Figure 4
Figure 4
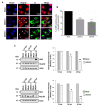
The integrity and location of the Nup62 are altered during ZIKV infection. (A) Huh-7 cells mock-infected (Mock) or infected with ZIKV for 48 hrs, were incubated with a monoclonal anti-Nup62 antibody and analyzed by confocal microscopy. The anti-E protein antibody was used as control of infection. Nuclei were stained with DAPI. Representative images of three independent experiments are presented. (B) The graphs represent the results expressed as a percentage of Mock-normalized mean fluorescence intensity (MFI) arbitrary units and the error bars show the SD of three independent experiments, n = 30 per group. (C) Levels of Nup62 protein were analyzed by Western blot in whole-cell lysates from mock or ZIKV infected cells for 12, 24, and 48 hrs. The anti-NS3 antibody was used as a control of infection and anti-actin as a loading control. Representative Western blot assays from three independent experiments are presented. The graph represents Nup62 protein levels compared with β-actin. Protein amount values from control (mock-infected) were adjusted to a value of 1. Values for expression in infected cells (white) were then expressed as a number relative to the control. Data are means ± SEM of n = 3 independent experiments performed by duplicate.
Figure 5
Figure 5
The integrity and location of the Nup98 are altered during DENV infection. (A) Huh-7 cells mock-infected (Mock) or infected with DENV2 or DENV4 for 48 hrs were incubated with a monoclonal anti-Nup98 antibody and analyzed by confocal microscopy. The anti-E protein antibody was used as control of infection. Nuclei were stained with Hoechst. Representative images of three independent experiments are presented. White boxes represent zoom areas. Arrows indicate non-infected cells, and plus signs indicate infected cells. (B) The graphs represent the results expressed as a percentage of Mock-normalized mean fluorescence intensity (MFI) arbitrary units and the error bars show the SD of three independent experiments. **** p ≤ 0.0001, n = 30 per group. (C) Levels of Nup-98 protein were analyzed by Western blot in whole-cell lysates from mock or DENV2, DENV4, and ZIKV-infected cells for 12, 24, and 48 hrs. The anti-NS3 antibody was used as a control of infection and anti-actin as a loading control. Representative Western blot assays of three independent experiments are presented. The graph represents Nup98 levels comparing with β-actin. Protein amount values from control (mock-infected) were adjusted to a value of 1. Values for expression in infected cells (white) were then expressed as a number relative to the control. Data are means ± standard error (S.E) of n = 3 independent experiments performed by duplicate. * p < 0.05, ** p < 0.001.
Figure 6
Figure 6
The integrity and location of the Nup98 are altered during ZIKV infection. (A) Huh-7 cells mock-infected (Mock) or infected with ZIKV for 48 hrs were incubated with a monoclonal anti-Nup98 antibody and analyzed by confocal microscopy. The anti-E protein antibody was used as control of infection. Nuclei were stained with DAPI. Representative images of three independent experiments are presented. Plus signs indicate infected cells. (B) The graphs represent the results expressed as a percentage of Mock-normalized mean fluorescence intensity (MFI) arbitrary units and the error bars show the SD of three independent experiments. *** p ≤ 0.001, n = 30 per group. (C) Levels of Nup98 protein were analyzed by Western blot in whole-cell lysates from mock or ZIKV-infected cells for 12, 24, and 48 hrs. The anti-NS3 antibody was used as a control of infection and anti-actin as a loading control. Representative Western blot assays of three independent experiments are presented. The graph represents Nup98 levels comparing with β-actin. Protein amount values from control (mock-infected) were adjusted to a value of 1. Values for expression in infected cells (white) were then expressed as a number relative to the control. Data are means ± standard error (S.E) of n = 3 independent experiments performed by duplicate. ** p < 0.001.
Figure 7
Figure 7
The integrity and location of TPR and Nup153 are altered during ZIKV infection.(A) Huh-7 cells mock-infected (Mock) or infected with ZIKV for 48 hrs were incubated with a monoclonal anti-TPR or anti-Nup153 antibody and analyzed by confocal microscopy. The anti-E protein antibody or anti-NS3 protein was used as control of infection. Nuclei were stained with DAPI. Representative images of three independent experiments are presented. Plus signs indicate infected cells. (B) The graphs represent the results expressed as a percentage of Mock-normalized mean fluorescence intensity (MFI) arbitrary units and the error bars show the SD of three independent experiments. **** p ≤ 0.0001, n = 30 per group. (C) Levels of TPR and Nup-153 proteins were analyzed by Western blot in whole-cell lysates from mock- or ZIKV-infected cells for 12, 24, and 48 hrs. The anti-NS3 antibody was used as a control of infection and anti-actin as a loading control. Representative Western blot assays of three independent experiments are presented. The graph represents TPR and Nup-153 levels comparing with β-actin. Protein amount values from control (mock-infected) were adjusted to a value of 1. Values for expression in infected cells (white) were then expressed as a number relative to the control. Data are means ± standard error (S.E) of n = 3 independent experiments performed by duplicate. ** p < 0.001.
Figure 8
Figure 8
Nup98 and Nup62 are cleaved by a serine-protease during DEN infection. Huh-7 cells infected with DENV2 for 24 hrs were incubated in the absence (VC) or in the presence of the serine-proteases inhibitors Leupeptin (Leu) and TLCK. The integrity of Nup98 and Nup62 was analyzed by Western blot in whole-cell lysates. The anti-NS3 antibody was used as a control of infection and anti-actin as a loading control. Representative Western blot assays of three independent experiments are presented. Cleavage products from serine protease processing (cp) are shown.
Figure 9
Figure 9
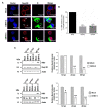
Transfection of NS2B3 proteins from DENV2 and ZIKV induces disruption of FG-rich sequence nucleoporins. (A) Huh-7 cells mock-transfected or transfected for 24 and 48 hrs with DENV2 or ZIKV active (WT) NS2B3 proteins were incubated with the Mab-414 and the anti-NS3 protein antibody respectively, and the integrity and subcellular localization of NS3 protein were analyzed by confocal microscopy. Nuclei were stained with Hoechst. Representative images of three independent experiments are presented. (B) The graphs represent the results expressed as a percentage of Mock-normalized mean fluorescence intensity (MFI) arbitrary units and the error bars show the SD of three independent experiments. **** p ≤ 0.0001, n = 30 per group.
Figure 10
Figure 10
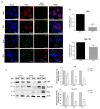
Transfection of the wild type but not with the mutant NS2B3 protein from DENV2 induces disruption of FG-rich sequence nucleoporins. (A) Huh-7 cells transfected for 24 and 48 hrs with wild type and DENV2 mutant NS2B3 protein. Nucleoporin integrity and subcellular localization of NS3 were analyzed by confocal microscopy using the Mab-414 and the anti-NS3 protein antibody, respectively. Nuclei were stained with Hoechst. Representative images of three independent experiments are presented. (B) The graphs represent the results expressed as a percentage of Mock-normalized mean fluorescence intensity (MFI) arbitrary units and the error bars show the SD of three independent experiments. **** p ≤ 0.0001, n = 30 per group.
Figure 11
Figure 11
The active NS2B3 protease of ZIKV alters the integrity of Nup98, but not the Nup-62. (A) Huh-7 cells mock-infected (Mock) or infected with ZIKV or transfected with the active (WT) or inactive (mutant) form of the NS2B3 protease for 48 hrs were incubated with a monoclonal anti-Nup62 or anti-Nup98 antibody and analyzed by Western blot. The anti-NS3 antibody was used as a control of infection and anti-actin as a loading control. Representative Western blot assays of three independent experiments are presented. (B) The graph represents Nup62 and Nup98 levels comparing with β-actin. Protein amount values from control (mock-infected) were adjusted to a value of 1. Values for expression in infected cells (white) were then expressed as a number relative to the control. Data are means ± standard error (S.E) of n = 3 independent experiments performed by duplicate. *** p ≤ 0.001, ns: no significant difference.
Figure 12
Figure 12
The active NS2B3 protease of ZIKV alters the integrity of TPR and NUp153. (A) Huh-7 cells mock-infected (Mock) or infected with ZIKV or transfected with the active (WT) or inactive (mutant) form of the NS2B3 protease for 48 hrs were incubated with a monoclonal anti-TPR or anti-Nup153 antibody and analyzed by Western blot. The anti-NS3 antibody was used as a control of infection and anti-actin as a loading control. Representative Western blot assays of three independent experiments are presented. (B) The graph represents Nup153 and TPR levels comparing with β-actin. Protein amount values from control (mock-infected) were adjusted to a value of 1. Values for expression in infected cells (white) were then expressed as a number relative to the control. Data are means ± standard error (S.E) of n = 3 independent experiments performed by duplicate. * p < 0.05, *** p ≤ 0.001, ns: no significant difference..

Similar articles

Cited by

References

    1. Hennessey M. Zika Virus Spreads to New Areas — Region of the Americas, May 2015–January 2016. MMWR Morb. Mortal. Wkly. Rep. 2016;65:55–58. doi: 10.15585/mmwr.mm6503e1. - DOI - PubMed
    1. WHO Zika: the continuing threat. Bull. World Health Organ. 2019;97:6–7. doi: 10.2471/BLT.19.020119. - DOI - PMC - PubMed
    1. Hurtado-Monzón A.M., Cordero-Rivera C.D., Farfan-Morales C.N., Osuna-Ramos J.F., Jesús-González L.A.D., Reyes-Ruiz J.M., Ángel R.M. del The role of anti-flavivirus humoral immune response in protection and pathogenesis. Rev. Med. Virol. n/a. 2020:e2100. doi: 10.1002/rmv.2100. - DOI - PubMed
    1. Barzon L., Trevisan M., Sinigaglia A., Lavezzo E., Palù G. Zika virus: from pathogenesis to disease control. FEMS Microbiol. Lett. 2016;363:fnw202. doi: 10.1093/femsle/fnw202. - DOI - PubMed
    1. Gu S.H., Song D.H., Lee D., Jang J., Kim M.Y., Jung J., Woo K.I., Kim M., Seog W., Oh H.S., et al. Whole-genome sequence analysis of Zika virus, amplified from urine of traveler from the Philippines. Virus Genes. 2017;53:918–921. doi: 10.1007/s11262-017-1500-9. - DOI - PMC - PubMed

Publication types

MeSH terms

LinkOut - more resources