Comparative Study
. 2020 Aug 4;142(5):466-482.
doi: 10.1161/CIRCULATIONAHA.119.045401. Epub 2020 May 14.

Transcriptional and Cellular Diversity of the Human Heart

Affiliations
Comparative Study

Transcriptional and Cellular Diversity of the Human Heart

Nathan R Tucker et al. Circulation. .

Abstract

Background: The human heart requires a complex ensemble of specialized cell types to perform its essential function. A greater knowledge of the intricate cellular milieu of the heart is critical to increase our understanding of cardiac homeostasis and pathology. As recent advances in low-input RNA sequencing have allowed definitions of cellular transcriptomes at single-cell resolution at scale, we have applied these approaches to assess the cellular and transcriptional diversity of the nonfailing human heart.

Methods: Microfluidic encapsulation and barcoding was used to perform single nuclear RNA sequencing with samples from 7 human donors, selected for their absence of overt cardiac disease. Individual nuclear transcriptomes were then clustered based on transcriptional profiles of highly variable genes. These clusters were used as the basis for between-chamber and between-sex differential gene expression analyses and intersection with genetic and pharmacologic data.

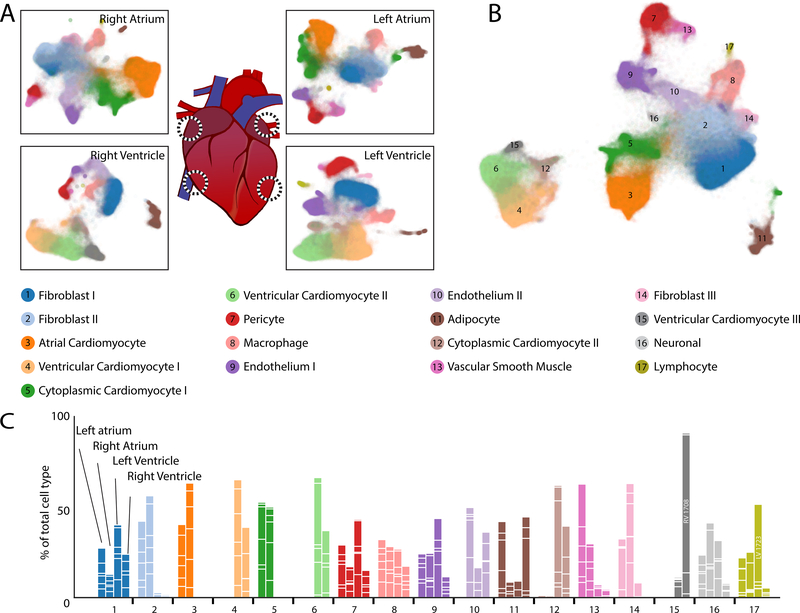
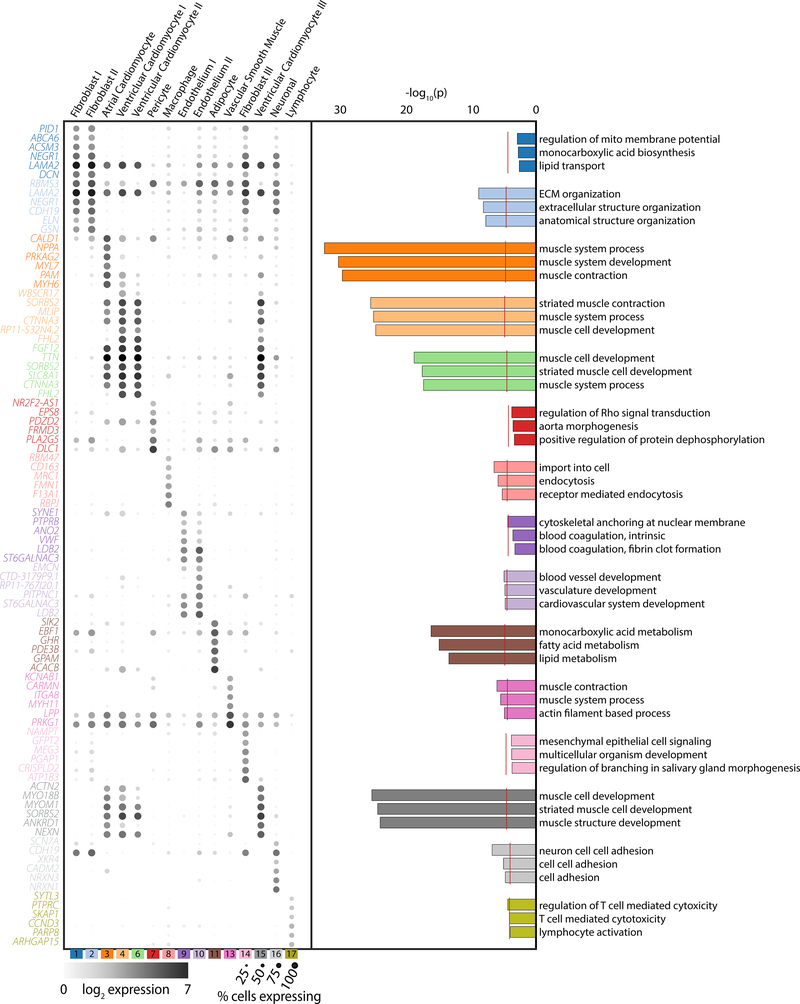
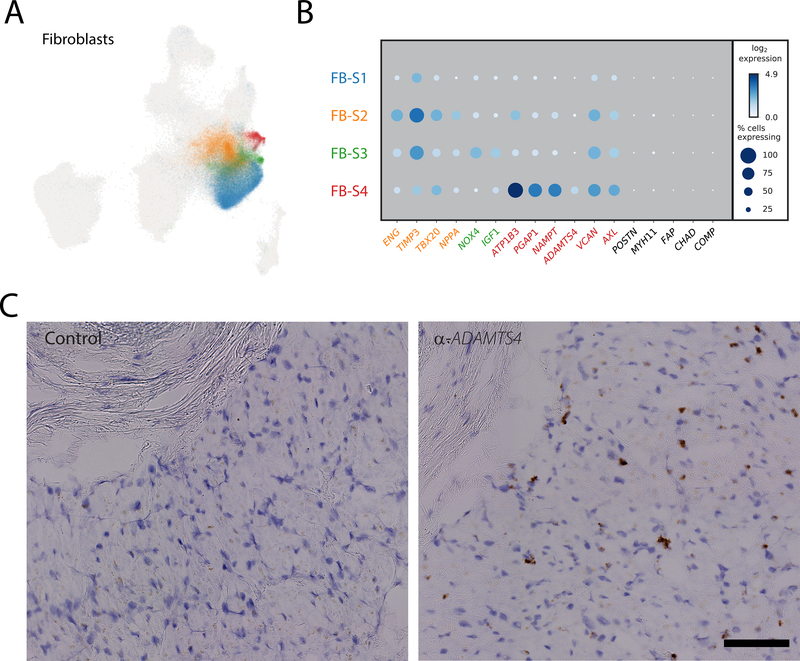
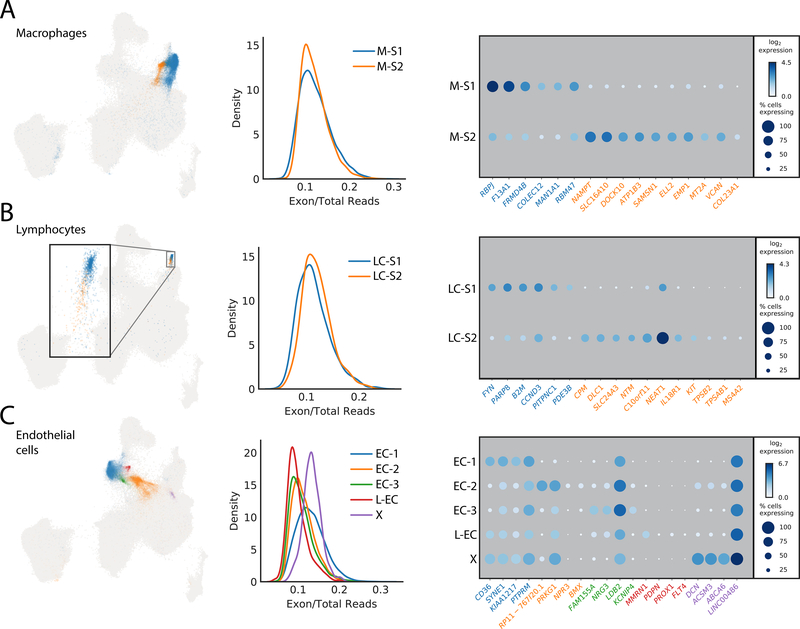
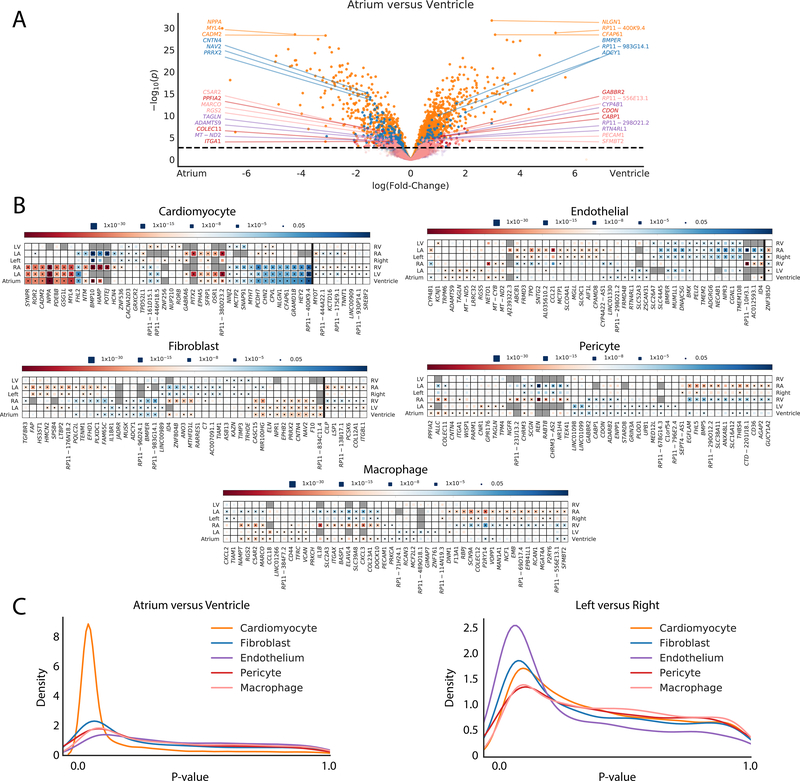
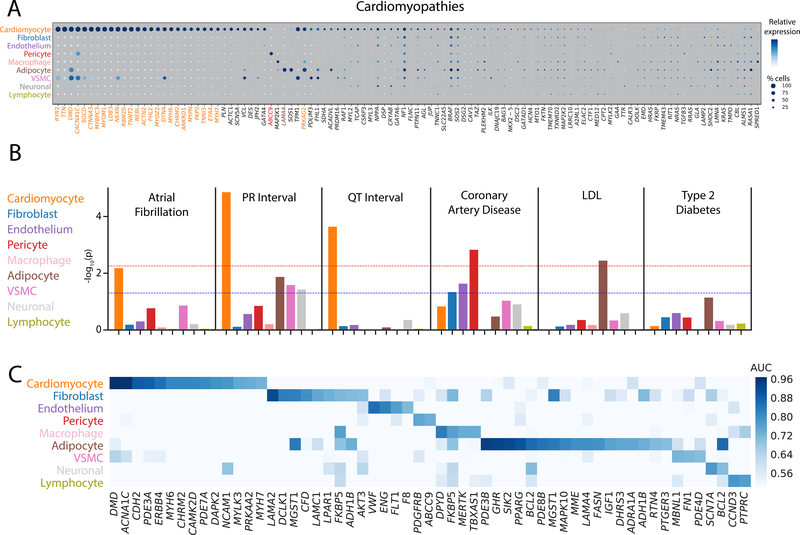
Results: We sequenced the transcriptomes of 287 269 single cardiac nuclei, revealing 9 major cell types and 20 subclusters of cell types within the human heart. Cellular subclasses include 2 distinct groups of resident macrophages, 4 endothelial subtypes, and 2 fibroblast subsets. Comparisons of cellular transcriptomes by cardiac chamber or sex reveal diversity not only in cardiomyocyte transcriptional programs but also in subtypes involved in extracellular matrix remodeling and vascularization. Using genetic association data, we identified strong enrichment for the role of cell subtypes in cardiac traits and diseases. Intersection of our data set with genes on cardiac clinical testing panels and the druggable genome reveals striking patterns of cellular specificity.

Conclusions: Using large-scale single nuclei RNA sequencing, we defined the transcriptional and cellular diversity in the normal human heart. Our identification of discrete cell subtypes and differentially expressed genes within the heart will ultimately facilitate the development of new therapeutics for cardiovascular diseases.

Keywords: RNA; cardiovascular disease; heart.


Figures

Figure 1:
Figure 1:. Observed cell types in the adult human heart.
A: UMAP plot displaying cellular diversity present in the human heart by chamber. Each dot represents an individual cell. Colors correspond to the cell cluster labels below the panel. B: Combined UMAP plot containing a total of 287,269 cells from 7 individuals. Colors and numbers correspond to the cell cluster labels as listed in the lower panel. C: Relative representation of cell clusters by sample. Aggregation of four bars for each cell cluster equals 100% for each cell type. White lines within bars separate individual sample contributions. Colors correspond to the cell type descriptions displayed in the panel above.
Figure 2:
Figure 2:. Gene and ontology definitions of observed cardiac cell clusters.
Left panel: Dot plots display the top 6 marker genes for each supercluster as determined by AUC. The size of the dot represents the percentage of cells within the cluster where each marker is detected while the gradation corresponds to the mean log2 of the counts normalized by total counts per cell times 10,000. Right panel: Gene ontology enrichment analysis as performed by GOStats using all genes which reach an AUC threshold of greater than 0.70 and an average log fold-change greater than 0.60 for the given cell cluster. Red dotted line indicates a Bonferroni statistical significance threshold. The top three gene ontologies are shown for each cell cluster.
Figure 3:
Figure 3:. Subclustering fibroblasts to identify activated and quiescent fibroblasts
A: UMAP plot representing the four observed fibroblast subclusters superimposed over the global UMAP distribution. Each dot represents an individual cell and are colored by their respective subcluster B: Dot plot detailing the percentage of cells where each gene is detected (dot size) and mean log2 expression (blue hue) for representative subcluster marker genes. Each row represents the cell subcluster as displayed in panel A as according to color. C: Representative RNA in situ hybridization showing localization of ADAMTS4 positive cells (brown stain) in sample LV1723 compared to a non-specific RNA probe (Control). Localization of nuclei is shown with hematoxylin (blue stain). Scale bar represents 100um.
Figure 4:
Figure 4:. Subclustering to identify additional cellular diversity within macrophages, endothelial cells and lymphocytes
A: Left panel showing the UMAP distribution of the two identified macrophage subclusters. Each dot represents an individual cell colored by its respective subcluster. Center panel represents the calculated proportion of exonic mapping reads for the two subclusters. Right panel details the top markers by AUC for each subcluster. The size of the dot relates to the percentage of cells within the cluster which express that markers whereas the gradation relates to the mean log2 of the counts normalized by total counts per cell times 10,000. B: Left panel is the distribution of the two subclusters for lymphocytes in the global UMAP. Each dot represents an individual cell colored by its respective subcluster. Inset is the magnification of the outlined region. Center panel displays equivalent exon mapping reads for each of the subclusters. Right panel displays the top genes defining each subcluster as defined by AUC. C: Left panel is the distribution of the five identified subclusters of endothelial cells within the global UMAP plot. Each dot represents an individual cell colored by its respective subcluster. Center details the percentage of exon mapping reads, where cluster X (purple) has enrichment for exonic reads. Right panel shows a dot plot of the top markers for each subcluster by AUC with the addition of those markers used for identification of the lymphatic endothelium cluster derived from the standardized positive predictive value.
Figure 5:
Figure 5:. Differential expression analyses for chamber specific signatures of major cell types
A: Volcano plot detailing differential expression of genes when comparing the aggregated atrial and ventricular chambers in cardiomyocytes (orange), fibroblasts (blue), endothelial cells (purple), pericytes (red), and macrophages (pink). The X-axis represents the fixed effect from the generalized linear mixed model and the Y-axis represents the -log10(P-value). Dotted line indicates the FDR adjusted P-value threshold for statistical significance. The top 3 genes upregulated in atrial cells and ventricle cells are highlighted for each cell major cell type. B: Heat maps detailing a representative selection of significantly differentially expressed genes between chambers within major cell types. Color indicates whether the gene is enriched within the chamber listed on the left (red) or right (blue). Size of the inset block indicates the P-value for the comparison. Dot within the block indicates statistical significance for the given comparison. Genes to the right of the dark vertical line are those with different directionalities when comparing atria versus ventricles on the left or right side. C: Density plot displaying the number of genes with certain P-values across the P-value spectrum within each major cell type for atrium versus ventricle (left panel) and left versus right (right panel) comparisons.
Figure 6:
Figure 6:. Integration of single nucleus RNA sequencing with genetic associations to uncover disease biology
A: Dot plot for genes currently on standard cardiomyopathy clinical testing panels. The size of each dot represents the percent of cells in which the gene of interest is detected and the shading represents the relative expression of the gene. Color of the genes correspond to the cell type for which the AUC reaches 0.70 or greater. Genes with black color indicate no cell type which reaches this threshold. Size and shade of the dot corresponds percentage of cells and relative expression, respectively. B: Results of LD score regression analyses on the combined major cell types. Dotted lines display unadjusted (blue) and Bonferroni adjusted (red) P-value thresholds for statistical significance. Colors of the bars correspond to the color of the cell major cell type labels on the left. C: Heat map detailing the intersection between single nucleus RNA sequencing data and Tier 1 druggable genes. Genes with an AUC greater than 0.70 in at least one cell type are shown. Shade of the color represents the AUC value for the gene within each cell type. Of note, genes that have an AUC greater than 0.70 in multiple cell types appear multiple times in the plot.

Similar articles

  • Cells of the adult human heart.
    Litviňuková M, Talavera-López C, Maatz H, Reichart D, Worth CL, Lindberg EL, Kanda M, Polanski K, Heinig M, Lee M, Nadelmann ER, Roberts K, Tuck L, Fasouli ES, DeLaughter DM, McDonough B, Wakimoto H, Gorham JM, Samari S, Mahbubani KT, Saeb-Parsy K, Patone G, Boyle JJ, Zhang H, Zhang H, Viveiros A, Oudit GY, Bayraktar OA, Seidman JG, Seidman CE, Noseda M, Hubner N, Teichmann SA. Litviňuková M, et al. Nature. 2020 Dec;588(7838):466-472. doi: 10.1038/s41586-020-2797-4. Epub 2020 Sep 24. Nature. 2020. PMID: 32971526 Free PMC article.
  • Single-Cell Reconstruction of Progression Trajectory Reveals Intervention Principles in Pathological Cardiac Hypertrophy.
    Ren Z, Yu P, Li D, Li Z, Liao Y, Wang Y, Zhou B, Wang L. Ren Z, et al. Circulation. 2020 May 26;141(21):1704-1719. doi: 10.1161/CIRCULATIONAHA.119.043053. Epub 2020 Feb 26. Circulation. 2020. PMID: 32098504
  • Single-Cell Resolution of Temporal Gene Expression during Heart Development.
    DeLaughter DM, Bick AG, Wakimoto H, McKean D, Gorham JM, Kathiriya IS, Hinson JT, Homsy J, Gray J, Pu W, Bruneau BG, Seidman JG, Seidman CE. DeLaughter DM, et al. Dev Cell. 2016 Nov 21;39(4):480-490. doi: 10.1016/j.devcel.2016.10.001. Epub 2016 Nov 10. Dev Cell. 2016. PMID: 27840107 Free PMC article.
  • Dynamic cell-cell and cell-ECM interactions in the heart.
    Howard CM, Baudino TA. Howard CM, et al. J Mol Cell Cardiol. 2014 May;70:19-26. doi: 10.1016/j.yjmcc.2013.10.006. Epub 2013 Oct 17. J Mol Cell Cardiol. 2014. PMID: 24140801 Review.
  • Origin of cardiac fibroblasts and the role of periostin.
    Snider P, Standley KN, Wang J, Azhar M, Doetschman T, Conway SJ. Snider P, et al. Circ Res. 2009 Nov 6;105(10):934-47. doi: 10.1161/CIRCRESAHA.109.201400. Circ Res. 2009. PMID: 19893021 Free PMC article. Review.

Cited by

References

    1. Macosko EZ, Basu A, Satija R, Nemesh J, Shekhar K, Goldman M, Tirosh I, Bialas AR, Kamitaki N, Martersteck EM, et al. Highly parallel genome-wide expression profiling of individual cells using nanoliter droplets. Cell. 2015;161:1202–1214. doi:10.1016/j.cell.2015.05.002. - DOI - PMC - PubMed
    1. Zheng GXY, Terry JM, Belgrader P, Ryvkin P, Bent ZW, Wilson R, Ziraldo SB, Wheeler TD, McDermott GP, Zhu J, et al. Massively parallel digital transcriptional profiling of single cells. Nat Commun. 2017;8:14049. doi:10.1038/ncomms14049. - DOI - PMC - PubMed
    1. Regev A, Teichmann SA, Lander ES, Amit I, Benoist C, Birney E, Bodenmiller B, Campbell P, Carninci P, Clatworthy M, et al. The human cell atlas. Elife. 2017;6. doi:10.7554/eLife.27041. - DOI - PMC - PubMed
    1. Schaum N, Karkanias J, Neff NF, May AP, Quake SR, Wyss-Coray T, Darmanis S, Batson J, Botvinnik O, Chen MB, et al. Single-cell transcriptomics of 20 mouse organs creates a Tabula Muris. Nature. 2018;562:367–372. doi:10.1038/s41586-018-0590-4. - DOI - PMC - PubMed
    1. Cui Y, Zheng Y, Liu X, Yan L, Fan X, Yong J, Hu Y, Dong J, Li Q, Wu X, et al. Single-Cell Transcriptome Analysis Maps the Developmental Track of the Human Heart. Cell Rep. 2019;26:1934–1950.e5. doi:10.1016/j.celrep.2019.01.079. - DOI - PubMed

Publication types

MeSH terms

Substances