. 2020 Jul 1;31(7):1422-1439.
doi: 10.1021/jasms.0c00033. Epub 2020 May 29.

TRANSPIRE: A Computational Pipeline to Elucidate Intracellular Protein Movements from Spatial Proteomics Data Sets

Affiliations

TRANSPIRE: A Computational Pipeline to Elucidate Intracellular Protein Movements from Spatial Proteomics Data Sets

Michelle A Kennedy et al. J Am Soc Mass Spectrom. .

Abstract

Protein localization is paramount to protein function, and the intracellular movement of proteins underlies the regulation of numerous cellular processes. Given advances in spatial proteomics, the investigation of protein localization at a global scale has become attainable. Also becoming apparent is the need for dedicated analytical frameworks that allow the discovery of global intracellular protein movement events. Here, we describe TRANSPIRE, a computational pipeline that facilitates TRanslocation ANalysis of SPatIal pRotEomics data sets. TRANSPIRE leverages synthetic translocation profiles generated from organelle marker proteins to train a probabilistic Gaussian process classifier that predicts changes in protein distribution. This output is then integrated with information regarding co-translocating proteins and complexes and enriched gene ontology associations to discern the putative regulation and function of movement. We validate TRANSPIRE performance for predicting nuclear-cytoplasmic shuttling events. Analyzing an existing data set of nuclear and cytoplasmic proteomes during Kaposi Sarcoma-associated herpesvirus (KSHV)-induced cellular mRNA decay, we confirm that TRANSPIRE readily discerns expected translocations of RNA binding proteins. We next investigate protein translocations during infection with human cytomegalovirus (HCMV), a β-herpesvirus known to induce global organelle remodeling. We find that HCMV infection induces broad changes in protein localization, with over 800 proteins predicted to translocate during virus replication. Evident are protein movements related to HCMV modulation of host defense, metabolism, cellular trafficking, and Wnt signaling. For example, the low-density lipoprotein receptor (LDLR) translocates to the lysosome early in infection in conjunction with its degradation, which we validate by targeted mass spectrometry. Using microscopy, we also validate the translocation of the multifunctional kinase DAPK3, a movement that may contribute to HCMV activation of Wnt signaling.

Keywords: machine learning; protein translocation; spatial proteomics; subcellular organelles; viral infection.


Conflict of interest statement

The authors declare no competing financial interest.

Figures
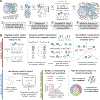
Figure 1.
Figure 1.
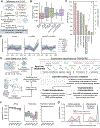
Workflows for spatial proteomics and the TRANPIRE pipeline for studying protein localization and movement. (A) General workflow for assessing the subcellular distribution of cellular proteins using organelle fractionation-based spatial proteomics. Most commonly, these approaches combine multiplexed isobaric labeling and quantitative mass spectrometry with machine learning to discern information regarding protein localization. Organelle marker proteins are used to inform machine learning-enabled classification. (B) Data processing and analysis pipeline for TRANSPIRE, a computational method leveraging a Gaussian process classifier (GPC) to characterize protein movements between organelles. By training the classifier with synthetic translocation profiles derived from different combinations of organelle markers, this classifier can detect and score the probability of protein translocation events. The output of the classifier is further combined with Mahalanobis distance analyses to identify co-translocating proteins and protein complexes. Integration of this analysis with known interactions and gene ontology enrichment can help reveal the putative function of these changes in protein distribution.
Figure 2.
Figure 2.
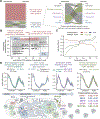
Assessing the reliability of TRASPIRE classification for predicting protein translocations in the context of viral infection. (A) Experimental workflow from Gilbertson et al., a study focused on understanding nuclear-cytoplasmic shuttling events upon KSHV-induced cellular mRNA decay (induced by transfection of the KSHV endonuclease muSOX or its catalytically inactive counterpart muSOX D219A). (B) Boxplots of weighted F1 scores describing classifier performance across five balanced training folds and three biological replicates for each experimental condition. (C) Gene ontology enrichment on proteins predicted to translocate by TRANSPIRE point to RNA binding proteins, in agreement with the results of the original manuscript. (D) Selected profiles of proteins predicted to translocate by TRANSPIRE in an Xrn1-dependent manner. Solid lines and shaded areas represent the mean and standard deviation, respectively, of protein profiles across the three biological replicates reported in the study. (E) Experimental workflow for the HCMV spatial proteomics study that was subsequently analyzed by TRANSPIRE. Using 6-plex TMT labeling, Jean Beltran et al. generated spatial profiles of proteins in uninfected and (HCMV)-infected cells at 24, 48, 72, 96, and 120 hpi. The curated organelle markers defined in the original study were used to generate synthetic translocation profiles from all pairwise combinations of organelle markers. Equal subsets of profiles corresponding to each combination of markers were then used to train the classifier and performance was validated on a held-out subset of test data. Following training, the classifier was then applied to predict translocations within the data set and high confidence predictions were further characterized by integrating information regarding known protein interactions and gene ontology enrichment analysis. (F) Boxplots of weighted F1 scores describing performance on the held-out test data set across all time points of infection at both binary (e.g., translocating versus not translocating) and multiclass levels, as well as for classifier predictions after grouping ambiguous organelles. Ambiguous organelle groups were: plasma membrane/cytoplasm, ER/Golgi/lysosome, and dense cytosol/nucleus. (G) Classifier score distributions for correct and incorrect classifier predictions before and after grouping ambiguous organelles. Note that these scores refer to multiclass translocation assignments rather than the binary translocation scores discussed later in the manuscript.
Figure 3.
Figure 3.
HCMV infection globally induces protein movements. (A) Sankey diagram depicting all high confidence predictions made by TRANSPIRE across all infection conditions. Each color (besides red) represents a different organelle, while the width of the strip represents the number of proteins that correspond to that organelle in each state. (B) Agreement between TRANSPIRE translocation predictions and the original study. To make this comparison, we generated a putative “translocation score” from the organelle assignments described in the original study (see eqs 5 and 6). Scores closer to 0 or closer to 1 indicate less uncertainty, while scores closer to 0.5 represent high uncertainty. (C) Translocation scores plotted against the relative enrichment for proteins with low, high, and very high translocation evidence scores in the Translocatome database. Cutoffs were defined as per the Translocatome publication (e.g., low ≤ 0.4487, high > 0.4487 ≤ 0.6167, and very high > 0.6167), and the enrichment baseline was determined by the translocation evidence scores for all proteins detected in the study. D) TRANSPIRE identification of proteins known to translocate upon HCMV infection. (Top) Protein translocation profiles compared to synthetic translocation profiles for the corresponding predicted translocation class. Solid lines and shaded areas represent the mean and standard deviation, respectively, of protein profiles across all time points for uninfected and infected cells. (Bottom) schematic overview of the role of these movements during HCMV infection. Mean translocation scores and their standard deviations across time points are reported. Abbreviations: PM, plasma membrane; DC, dense cytosol.
Figure 4.
Figure 4.
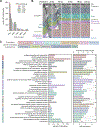
Temporal, spatial, and functional nature of protein movements reflect the HCMV modulation of cellular pathways. (A) Onset times for protein movement events identified by TRANSPIRE. Onset was defined as the first time point with a translocation score above the determined cutoff. (B) Spatiotemporal dynamics of protein movements during HCMV infection illustrated as a Sankey diagram. (C) Results of gene ontology (GO) analysis of all translocating proteins. GO terms are color-coded by the general category that they belong to. Gray data points on the right-most graph represent the −log10(p-value), and the dashed line represents a significance cutoff of 0.05. GO terms that returned a p-value of 0.0 based on FDR resampling are represented with a p-value of 0.0001 for visualization purposes. PM, plasma membrane; DC, dense cytosol.
Figure 5.
Figure 5.
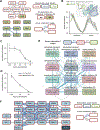
HCMV infection targets cholesterol metabolism, cellular trafficking factors, and Wnt signaling via protein translocations. (A) Translocating and co-translocating proteins involved in cholesterol metabolism. Co-translocations that correspond to a known interaction are shown in blue, while other co-translocations are shown in gray. Node border color denotes the time of translocation onset. (B) Translocation profiles of LDLR relative to the synthetic translocation profiles generated for plasma membrane (PM) to ER/Golgi/Lysosome movements. (C) LDLR protein levels decrease throughout HCMV infection. Error bars represent the standard deviation of three biological replicates. (D) Validation of decrease in LDLR levels by targeted mass spectrometry. Error bars represent the standard deviation across two unique LDLR peptides quantified by parallel reaction monitoring (PRM). (E) Translocating and co-translocating protein categories involved in intracellular trafficking. Edge width scales with the number of TRANSPIRE-identified co-translocations that represent known (blue) or unknown (gray) associations. (F) Translocating and co-translocating proteins involved in Wnt signaling.
Figure 6.
Figure 6.
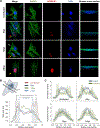
HCMV stimulates DAPK3 translocation between multiple subcellular compartments. (A) Immunofluorescence microscopy images (maximum projections) of DAPK3 distributions in uninfected and HCMV-infected cells early during HCMV infection (6, 12, and 24 hpi). The immediate-early HCMV protein IE1 is provided as marker of infected cells. Yellow arrows denote the nucleus that is cross-sectioned in the right-most panel. For emphasis, white arrows highlight plasma membrane accumulations of DAPK3 in uninfected cells, while red arrows point to infected cells that have lost this phenotype. (B) Line scan analysis of DAPK3 distributions (shaded to highlight the plasma membrane and cytoplasm, with the nucleus between the cytoplasm shadings) in uninfected and infected cells at 6, 12, and 24 hpi. The schematic in the upper-left corner is a representation of the orientation of the line scans relative to the cell body. (C) Overlay of the distribution of DAPK3 relative to the nucleus in uninfected and infected cells at 6, 12, and 24 hpi. Solid lines and shading represent the mean and standard deviation, respectively, across line scans from all cells analyzed at a given condition.

Similar articles

Cited by

References

    1. Hetz C; Papa FR The Unfolded Protein Response and Cell Fate Control. Mol. Cell 2018, 69, 169–181. - PubMed
    1. Alchini R; Sato H; Matsumoto N; Shimogori T; Sugo N; Yamamoto N Nucleocytoplasmic Shuttling of Histone Deacetylase 9 Controls Activity-Dependent Thalamocortical Axon Branching. Sci. Rep 2017, 7 (1), 1–11. - PMC - PubMed
    1. Diner BA; Lum KK; Toettcher JE; Cristea IM Viral DNA Sensors IFI16 and Cyclic GMP-600 AMP Synthase Possess Distinct Functions in Regulating Viral Gene Expression. mBio 2016, DOI: 10.1128/mBio.01553-16. - DOI - PMC - PubMed
    1. Lin R; Heylbroeck C; Pitha PM; Hiscott J Virus-Dependent Phosphorylation of the IRF-3 Transcription Factor Regulates Nuclear Translocation, Transactivation Potential, and Proteasome-Mediated Degradation. Mol. Cell. Biol 1998, 18 (5), 2986–2996. - PMC - PubMed
    1. Erster S; Mihara M; Kim RH; Petrenko O; Moll UM In Vivo Mitochondrial P53 Translocation Triggers a Rapid First Wave of Cell Death in Response to DNA Damage That Can Precede P53 Target Gene Activation. Mol. Cell. Biol 2004, 24 (15), 6728–6741. - PMC - PubMed