. 2020 May 19;52(5):825-841.e8.
doi: 10.1016/j.immuni.2020.04.014. Epub 2020 May 11.

Developmental Relationships of Four Exhausted CD8+ T Cell Subsets Reveals Underlying Transcriptional and Epigenetic Landscape Control Mechanisms

Affiliations

Developmental Relationships of Four Exhausted CD8+ T Cell Subsets Reveals Underlying Transcriptional and Epigenetic Landscape Control Mechanisms

Jean-Christophe Beltra et al. Immunity. .

Abstract

CD8+ T cell exhaustion is a major barrier to current anti-cancer immunotherapies. Despite this, the developmental biology of exhausted CD8+ T cells (Tex) remains poorly defined, restraining improvement of strategies aimed at "re-invigorating" Tex cells. Here, we defined a four-cell-stage developmental framework for Tex cells. Two TCF1+ progenitor subsets were identified, one tissue restricted and quiescent and one more blood accessible, that gradually lost TCF1 as it divided and converted to a third intermediate Tex subset. This intermediate subset re-engaged some effector biology and increased upon PD-L1 blockade but ultimately converted into a fourth, terminally exhausted subset. By using transcriptional and epigenetic analyses, we identified the control mechanisms underlying subset transitions and defined a key interplay between TCF1, T-bet, and Tox in the process. These data reveal a four-stage developmental hierarchy for Tex cells and define the molecular, transcriptional, and epigenetic mechanisms that could provide opportunities to improve cancer immunotherapy.

Keywords: CD8; PD-1 blockade; T cell exhaustion lineage; T-bet; TCF1; Tox; cancer immunotherapy; chronic infection; epigenetics; exhaustion.


Conflict of interest statement

Declaration of Interests E.J.W. is a member of the Parker Institute for Cancer Immunotherapy which supported these studies. E.J.W. has consulting agreements with and/or is on the scientific advisory board for Merck, Roche, Pieris, Elstar, and Surface Oncology. E.J.W. has a patent licensing agreement on the PD-1 pathway with Roche/Genentech. E.J.W. is a founder of Arsenal Biosciences.

Figures

Figure 1.
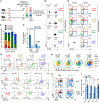
Figure 1.. Four Tex Subsets Develop during Chronic Viral Infections and Cancer
Naive CD45.1+ P14 CD8+ T (103) were adoptively transferred into C57BL/6J mice (CD45.2+) after infection with LCMV clone 13 and analyzed at d30pi. (A) Ly108 and TCF1 expression by PD-1int and PD-1hi P14 CD8+ T cells. Numbers are frequencies. (B) Representative Ki67 and CD69 co-expression in indicated populations of P14 CD8+ T cells. (C) Representative histograms for indicated markers on subpopulations among endogenous Dbgp33 tetramer+ CD8+ T cells. Numbers are mean fluorescence intensity (MFI). (D) Representative Ly108 and CD69 co-expression on splenic P14 CD8+ T cells at indicated time post-infection (pi) with LCMV Armstrong (left) or clone 13 (right). Numbers are frequencies. (E) Frequencies of different P14 populations at indicated time after clone-13 infection. (F) Absolute number of different P14 populations at indicated time after clone-13 infection. (G) Representative Ly108 and CD69 co-expression in tissues. Numbers are frequencies. (H) Frequencies of Ki67+ cells among indicated P14 populations (gray line; right axis) and MFI for TCF1 (blue line; left axis). (I) Representative TCF1 and CD69 co-expression on PD-1+Tox+ TILs from B16 tumors (see Figure S1I for gating). Right graph shows cumulative data. (J) Representative TCF1 and CD69 co-expression on non-naive Tox+ TILs (see Figure S1J for gating) analyzed from human melanoma tumors. n = 7 patients. (A)–(H), n = 5 with 6 to 16 mice per group/time point. (I), n = 2 with 11 mice/group.
Figure 2.
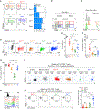
Figure 2.. Developmental Lineage Relationships between Four Tex Subsets and Changes upon PD-L1 Blockade
(A) Experimental design. Tex subsets were sorted from endogenous PD-1+ CD8+ T cells at d21pi, labeled with CFSE, transferred back (1 × 10⁵ each) into infection-matched recipients and analyzed 7 days post-transfer (d28pi). (B) CFSE profile of indicated transferred populations. Numbers are frequencies. (C) Frequencies of P14 populations from indicated donor cells. (D) Ly108 and CD69 co-expression on divided (CFSElo) and undivided (CFSEhi) cells that developed from indicated transferred cells. (E) Ratio of Ly108+CD69+/Ly108+CD69 within CFSElo (light blue) and CFSEhi (dark blue) cells from indicated donor origin. (F) IRs co-expression on indicated P14 populations. (G) Representative PD-1/CD44, Cxcr5/Tim-3, and T-bet/Eomes co-expression in indicated P14 populations. (H) Representative Ly108 and CD69 co-expression on P14 (CD45.1+) and endogenous Dbgp33+ (CD45.2+) CD8+ T cells 1 day after treatment (d35pi) with either PBS (CTR) or anti-PD-L1. (I) Absolute number of indicated P14 populations 1 day post-treatment (d35pi) with either PBS (CTR) or anti-PD-L1. (B)–(E), n = 2 with 6–8 mice/group; (F), n = 3 with 10 mice/group; (G), n = 2 with 9 mice/group; (H) and (I), n = 2 with 7–11 mice/group.
Figure 3.
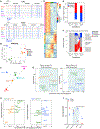
Figure 3.. Developmental Transitions Alter Tex Subset Localization and Effector Functions
(A) LCMV-clone-13-infected mice were injected with 3μg/mouse of anti-CD8 i.v. at d30pi and sacrificed 3 min later. Representative dot plots (left) and frequencies (right) of indicated P14 populations located either in the white pulp (CD8 i.v. antibody negative) or the red pulp (CD8 i.v. antibody positive) of the spleen. Numbers are frequencies. (B) Representative Ly108 and CD69 co-expression on P14 CD8+ T cells isolated from the spleen (left plot) or blood (right plot). Numbers are frequencies. (C) TCF1 expression in indicated P14 populations isolated from the blood. (D) Representative IFNγ and TNF co-production by indicated P14 populations at d30pi. Numbers are frequencies. (E–G) Frequencies of IFNγ+ (E), IFNγ+TNFα+ (F), and CD107a+ (G) cells among indicated P14 populations. (H) Representative CD107a expression by indicated P14 populations. Numbers are MFI. (I) Indicated P14 populations were sorted at d30pi, labeled with CFSE, and incubated with gp33-peptide coated dendritic cells (ratio 1/1). Dot plots display CFSE dilution profile after 3 days of co-culture. Numbers are frequencies. (J) Representative dot plots and frequencies of active caspase-3-positive cells within indicated P14 populations. Numbers are frequencies. (A)–(C), 3 independent experiments with 12–18 mice/group; (D)–(H), n = 2 with 7 mice/group; (I), n = 2 with 4–10 mice/group; (J), n = 3 with 10 mice/group.
Figure 4.
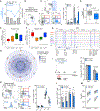
Figure 4.. Subset Transitions Induce Major Transcriptional Changes and Drive Acquisition of Population-Specific Transcriptomic Signatures
(A) PCA of RNA-seq profiles. (B) Venn diagram displaying overlaps between DEGs from indicated pairwise comparisons (lfc ≥ 1, p = 0.01). (C) DEGsUP overlaps between indicated P14 populations. Bubble size represents the proportion of DEGsUP from each individual Tex population (y axis) also found to be upregulated in indicated Tex subsets (x axis) in at least one pairwise comparison. (D) Heatmap displaying all DEGs (lfc ≥ 1, p = 0.01) clustered by using Pearson correlation as distance measure. Color legend indicates row z scores. (E) Pathway enrichment analysis. Bubble graph displays the five most significantly enriched pathways by log(q-value) for each cluster established in Figure 4D. (F) Representative histograms showing the expression of indicated markers by different P14 populations. Numbers are MFIs. (G) GSEA displaying enrichment of each individual Tex subset for signatures of indicated cell types. NES, Normalized Enrichment Score. n = 3 biological replicates.
Figure 5.
Figure 5.. Epigenetic Remodeling during Tex Subset Transitions Identifies Subset-Specific TF Accessibility
(A) ATAC-seq tracks at indicated loci. (B) PCA of normalized ATAC-seq counts (top 25% peaks by variance are displayed). (C) Spearman correlation network analysis showing similarities between indicated populations based on all ATAC-seq peaks. (D) Heatmap of peak intensity displaying the top 500 peaks by variance and clustered by using K-means method (k = 5). Color legend indicates row z scores. (E) Number of statistically significant peaks (lfc ≥ 1, p < 0.05) either opening (red) or closing (blue) upon indicated subset transitions. (F) Alluvial plot displaying the dynamics of transition-specific peaks (E) and refined as lfc ≥ 1, p < 0.01. (G) TF motifs enrichment analysis (HOMER) of subset-transition specific peaks (E). Volcano plots show TFs with the highest predicted binding activity to the identified DNA sequence. (H) Comparing TF motif enrichment with differential mRNA expression (Log2FoldChange) upon the indicated subset-transition. Plotted are TFs with a motif enrichment fold over background >1.25 in (G). (I) Protein expression dynamics of TCF1 and T-bet in the indicated P14 populations at d30pi. (A)–(H), n = 3 biological replicates; (I), n = 2 with 7mice/group.
Figure 6.
Figure 6.. TCF1 and T-bet Mediate Opposing Regulation of Tex Subset Differentiation
(A) Experimental design. (B) Representative flow cytometry plots (left) and frequencies (right) of indicated populations among splenic WT (gray; open circles) or TCF1KO (blue) P14 CD8+ T cells at d8pi. Numbers are frequencies. (C–F) Gating strategy, representative flow cytometry plots and frequencies of indicated populations of WT P14 (gray; open bars) or T-bet KO P14 (blue) at d8 ([C] and [D]) and 15 ([E] and [F]) pi. Numbers are frequencies. (G) Representative Ly108 and CD69 co-expression by P14 CD8+ T cells transduced (VEX+; lower line) or not (VEX−; upper line) with either empty (Empty RV), TCF1 (short isoform; TCF1 RV), or T-bet (Tbet RV) encoding RVs at d15pi. Numbers are frequencies. (B), n = 2 with 7 mice/group; (C)–(F), n = 3–5 with 11–17 mice/group; (G), n = 1 with 4 mice/group.
Figure 7.
Figure 7.. Tox Modulates Tex Subset Dynamics through Regulation of T-bet
(A) Tox MFI (blue line; left axis) and Tox/T-bet ratio (gray bars; right axis) in indicated populations among Dbgp33 tetramer+CD8+ T cells at d27pi. (B) Representative T-bet and Tox co-expression in PD-1+ Dbgp33 tetramer+ CD8+ T cells at d27pi. (C) Representative plots (left) and frequency (right) of indicated populations among Toxint (gray) and Toxhi (blue) endogenous Dbgp33 tetramer+ CD8+ T cells. (D) T-bet MFI in Toxint and Toxhi endogenous Dbgp33 tetramer+ CD8+ T cells. (E and F) T-bet (E) and Tox (F) MFI in indicated populations (gated on TCF1 and CD69; Figure 1J) within non-naive Tox+ TILs isolated from human melanoma tumors. (G) ATACseq tracks at the Tbx21 locus highlighting TFs with predictive binding sites at the indicated OCRs. (H) Correlation score by mRNA between T-bet and TFs predicted to bind near the Tbx21 locus (filtering out TFs without detectable mRNA in Tex subsets). Each TF is colored by the cell-type in which mRNA expression is highest (red-Texprog1, orange Texprog2, green-Texint, blue-Texterm). (I) Experimental design. (J) Numbers of Tox+/+ P14 (gray) and Tox+/− P14 (blue) cells at the indicated time points. (K) Representative dot plots (left) and frequencies (right) of the indicated populations among Tox+/+ (gray; open circles) and Tox+/− (blue) P14 cells. Numbers indicate frequencies. Numbers in the histogram are MFI. (L) Number of indicated populations within Tox+/+ P14 (gray) and Tox+/− P14 (blue) at d27pi. (M) T-bet MFI in indicated populations among Tox+/+ P14 (open circles) and Tox+/− P14 (blue circles). Linked circles represent individual mice. (A)–(D), 3 experiments with 22 mice/group; (E) and (F), n = 7 patients; (J)–(M), 2 experiments with 15 mice/group.

Comment in

Similar articles

Cited by

References

    1. Alfei F, Kanev K, Hofmann M, Wu M, Ghoneim HE, Roelli P, Utzschneider DT, von Hoesslin M, Cullen JG, Fan Y, et al. (2019). TOX reinforces the phenotype and longevity of exhausted T cells in chronic viral infection. Nature 571, 265–269. - PubMed
    1. Anderson KG, Mayer-Barber K, Sung H, Beura L, James BR, Taylor JJ, Qunaj L, Griffith TS, Vezys V, Barber DL, and Masopust D (2014). Intravascular staining for discrimination of vascular and tissue leukocytes. Nat. Protoc 9, 209–222. - PMC - PubMed
    1. Beltra JC, Bourbonnais S, Bédard N, Charpentier T, Boulangé M, Michaud E, Boufaied I, Bruneau J, Shoukry NH, Lamarre A, and Decaluwe H (2016). IL2Rβ-dependent signals drive terminal exhaustion and suppress memory development during chronic viral infection. Proc. Natl. Acad. Sci. USA 113, E5444–E5453. - PMC - PubMed
    1. Bengsch B, Ohtani T, Khan O, Setty M, Manne S, O’Brien S, Gherardini PF, Herati RS, Huang AC, Chang KM, et al. (2018). Epigenomic-Guided Mass Cytometry Profiling Reveals Disease-Specific Features of Exhausted CD8 T Cells. Immunity 48, 1029–1045.e5, e1025. - PMC - PubMed
    1. Berrien-Elliott MM, Yuan J, Swier LE, Jackson SR, Chen CL, Donlin MJ, and Teague RM (2015). Checkpoint blockade immunotherapy relies on T-bet but not Eomes to induce effector function in tumor-infiltrating CD8+ T cells. Cancer Immunol. Res 3, 116–124. - PMC - PubMed

Publication types

MeSH terms