

Clinico-Genetic, Imaging and Molecular Delineation of COQ8A-Ataxia: A Multicenter Study of 59 Patients
- PMID: 32337771
- PMCID: PMC7877690
- DOI: 10.1002/ana.25751
Clinico-Genetic, Imaging and Molecular Delineation of COQ8A-Ataxia: A Multicenter Study of 59 Patients
Abstract
Objective: To foster trial-readiness of coenzyme Q8A (COQ8A)-ataxia, we map the clinicogenetic, molecular, and neuroimaging spectrum of COQ8A-ataxia in a large worldwide cohort, and provide first progression data, including treatment response to coenzyme Q10 (CoQ10).
Methods: Cross-modal analysis of a multicenter cohort of 59 COQ8A patients, including genotype-phenotype correlations, 3D-protein modeling, in vitro mutation analyses, magnetic resonance imaging (MRI) markers, disease progression, and CoQ10 response data.
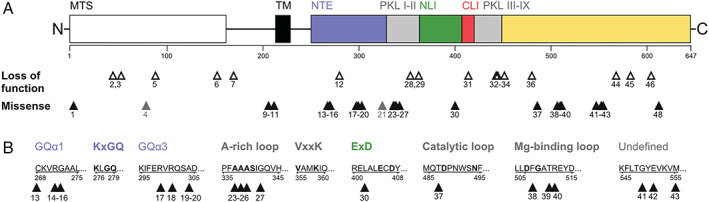
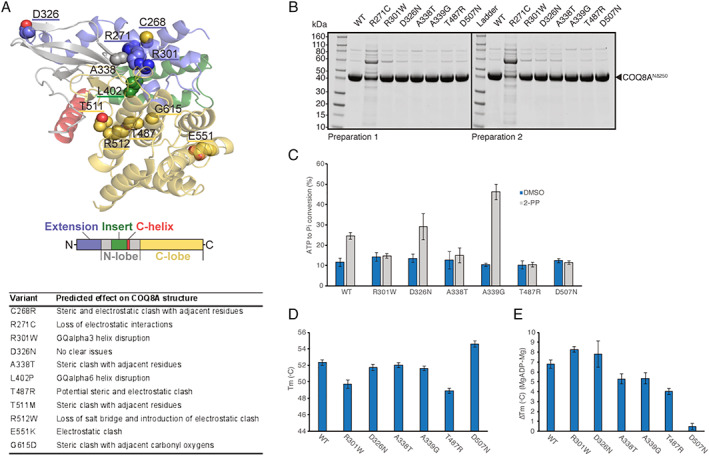
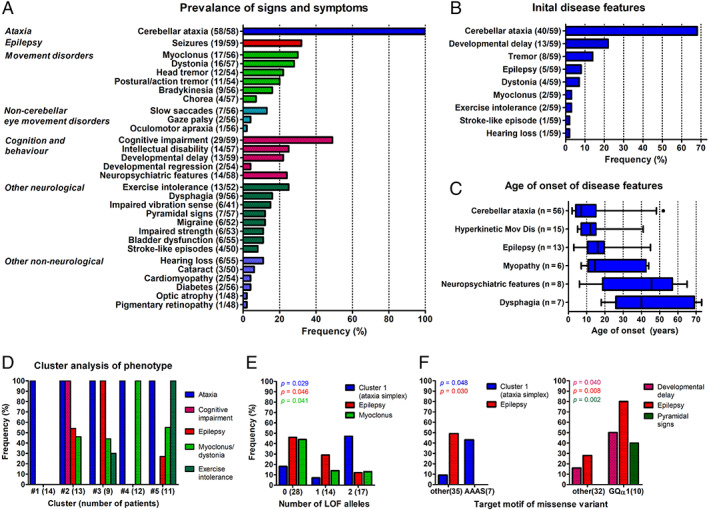
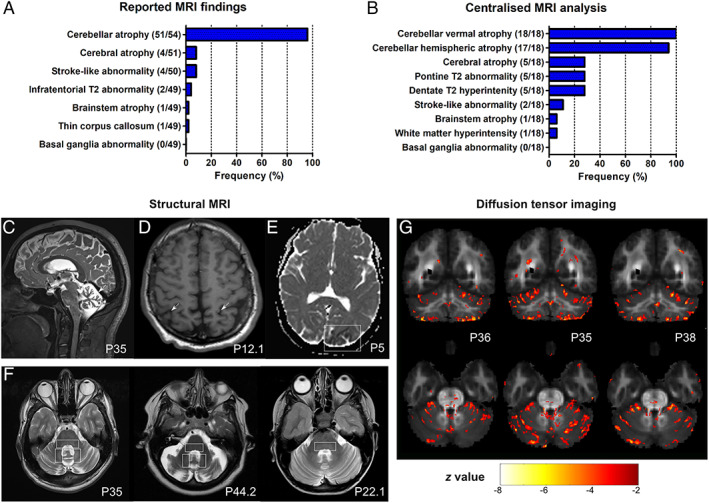
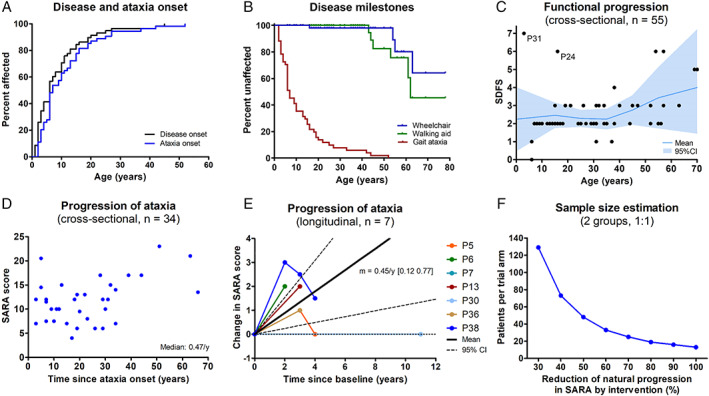
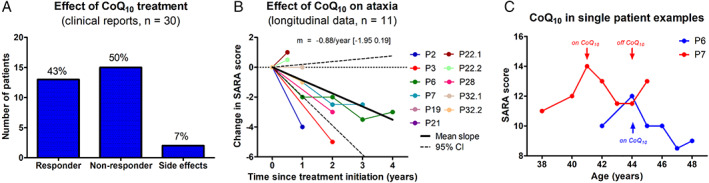
Results: Fifty-nine patients (39 novel) with 44 pathogenic COQ8A variants (18 novel) were identified. Missense variants demonstrated a pleiotropic range of detrimental effects upon protein modeling and in vitro analysis of purified variants. COQ8A-ataxia presented as variable multisystemic, early-onset cerebellar ataxia, with complicating features ranging from epilepsy (32%) and cognitive impairment (49%) to exercise intolerance (25%) and hyperkinetic movement disorders (41%), including dystonia and myoclonus as presenting symptoms. Multisystemic involvement was more prevalent in missense than biallelic loss-of-function variants (82-93% vs 53%; p = 0.029). Cerebellar atrophy was universal on MRI (100%), with cerebral atrophy or dentate and pontine T2 hyperintensities observed in 28%. Cross-sectional (n = 34) and longitudinal (n = 7) assessments consistently indicated mild-to-moderate progression of ataxia (SARA: 0.45/year). CoQ10 treatment led to improvement by clinical report in 14 of 30 patients, and by quantitative longitudinal assessments in 8 of 11 patients (SARA: -0.81/year). Explorative sample size calculations indicate that ≥48 patients per arm may suffice to demonstrate efficacy for interventions that reduce progression by 50%.
Interpretation: This study provides a deeper understanding of the disease, and paves the way toward large-scale natural history studies and treatment trials in COQ8A-ataxia. ANN NEUROL 2020;88:251-263.
© 2020 The Authors. Annals of Neurology published by Wiley Periodicals, Inc. on behalf of American Neurological Association.
Conflict of interest statement
The authors declared no conflict of interest.
Figures
Similar articles
-
Mitochondrial Dysfunction due to Novel COQ8A Variation with Poor Response to CoQ10 Treatment: A Comprehensive Study and Review of Literatures.Cerebellum. 2024 Oct;23(5):1824-1838. doi: 10.1007/s12311-024-01671-4. Epub 2024 Mar 2. Cerebellum. 2024. PMID: 38429489 Review.
-
Primary CoQ10 deficiency with a severe phenotype due to the c.901 C > T (p.R301W) mutation in the COQ8A gene.Int J Neurosci. 2024 Jun;134(2):148-152. doi: 10.1080/00207454.2022.2095269. Epub 2022 Jul 4. Int J Neurosci. 2024. PMID: 35757998
-
Dystonia-Ataxia with early handwriting deterioration in COQ8A mutation carriers: A case series and literature review.Parkinsonism Relat Disord. 2019 Nov;68:8-16. doi: 10.1016/j.parkreldis.2019.09.015. Epub 2019 Sep 28. Parkinsonism Relat Disord. 2019. PMID: 31621627 Review.
-
Primary coenzyme Q10 deficiency due to COQ8A gene mutations.Mol Genet Genomic Med. 2020 Oct;8(10):e1420. doi: 10.1002/mgg3.1420. Epub 2020 Aug 2. Mol Genet Genomic Med. 2020. PMID: 32743982 Free PMC article.
-
The cerebellar bioenergetic state predicts treatment response in COQ8A-related ataxia.Parkinsonism Relat Disord. 2022 Jun;99:91-95. doi: 10.1016/j.parkreldis.2022.05.008. Epub 2022 May 19. Parkinsonism Relat Disord. 2022. PMID: 35642996
Cited by
-
Mitochondrial Dysfunction due to Novel COQ8A Variation with Poor Response to CoQ10 Treatment: A Comprehensive Study and Review of Literatures.Cerebellum. 2024 Oct;23(5):1824-1838. doi: 10.1007/s12311-024-01671-4. Epub 2024 Mar 2. Cerebellum. 2024. PMID: 38429489 Review.
-
Primary Coenzyme Q10 Deficiency-Related Ataxias.J Clin Med. 2024 Apr 19;13(8):2391. doi: 10.3390/jcm13082391. J Clin Med. 2024. PMID: 38673663 Free PMC article. Review.
-
Calorie Restriction Rescues Mitochondrial Dysfunction in Adck2-Deficient Skeletal Muscle.Front Physiol. 2022 Jul 14;13:898792. doi: 10.3389/fphys.2022.898792. eCollection 2022. Front Physiol. 2022. PMID: 35936917 Free PMC article.
-
COQ8A-Ataxia as a Manifestation of Primary Coenzyme Q Deficiency.Metabolites. 2022 Oct 8;12(10):955. doi: 10.3390/metabo12100955. Metabolites. 2022. PMID: 36295857 Free PMC article. Review.
-
Refractory Epilepsy in Adult Patient With COQ8A Variant Improves With CoQ10 Supplementation: A Case for Exome Sequencing in the ICU.Neurol Genet. 2024 Sep 18;10(5):e200184. doi: 10.1212/NXG.0000000000200184. eCollection 2024 Oct. Neurol Genet. 2024. PMID: 39296910 Free PMC article.
References
-
- Synofzik M, Puccio H, Mochel F, Schöls LJN. Autosomal recessive cerebellar ataxias: paving the way toward targeted molecular therapies. Neuron 2019;101:560–583. - PubMed
-
- Rossi M, Anheim M, Durr A, et al. The genetic nomenclature of recessive cerebellar ataxias. Mov Disord 2018;33:1056–1076. - PubMed
Publication types
MeSH terms
Substances
Grants and funding
LinkOut - more resources
Full Text Sources
Medical
Molecular Biology Databases
