

Effectiveness of the measures to flatten the epidemic curve of COVID-19. The case of Spain
- PMID: 32330703
- PMCID: PMC7166106
- DOI: 10.1016/j.scitotenv.2020.138761
Effectiveness of the measures to flatten the epidemic curve of COVID-19. The case of Spain
Abstract
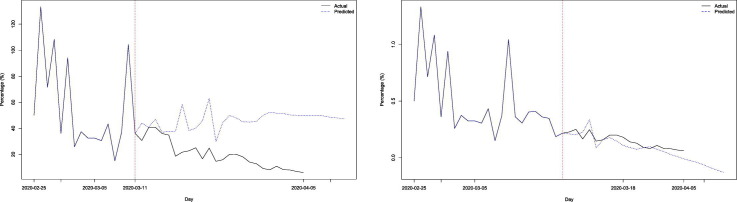
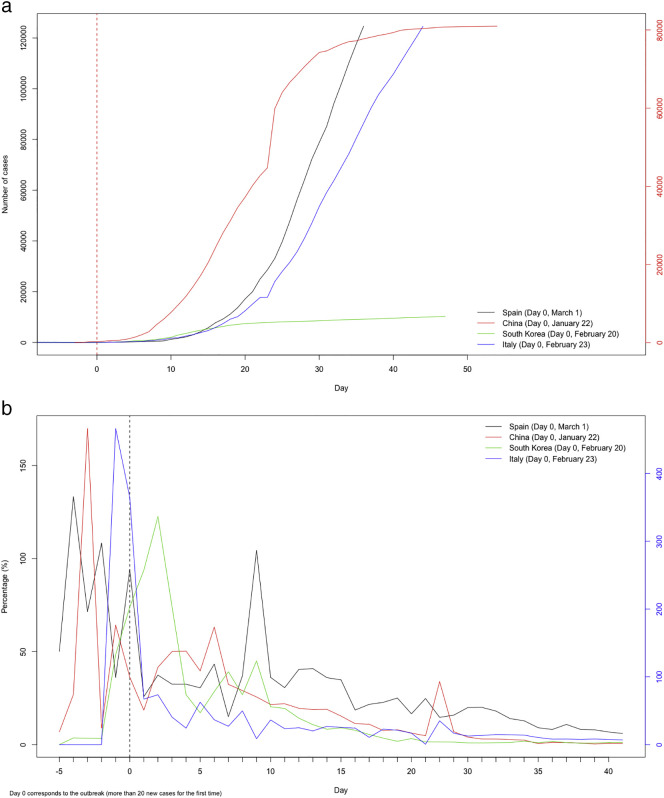
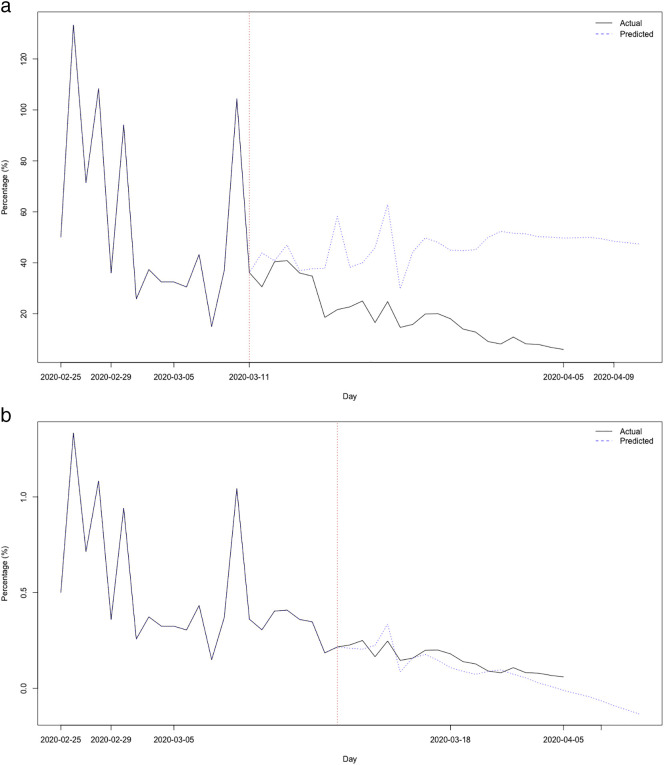
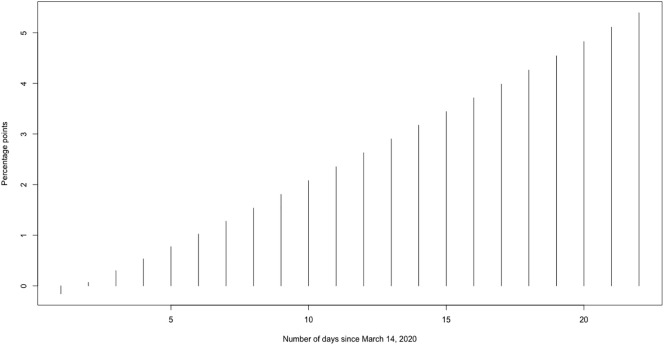
After the cases of COVID-19 skyrocketed, showing that it was no longer possible to contain the spread of the disease, the governments of many countries launched mitigation strategies, trying to slow the spread of the epidemic and flatten its curve. The Spanish Government adopted physical distancing measures on March 14; 13 days after the epidemic outbreak started its exponential growth. Our objective in this paper was to evaluate ex-ante (before the flattening of the curve) the effectiveness of the measures adopted by the Spanish Government to mitigate the COVID-19 epidemic. Our hypothesis was that the behavior of the epidemic curve is very similar in all countries. We employed a time series design, using information from January 17 to April 5, 2020 on the new daily COVID-19 cases from Spain, China and Italy. We specified two generalized linear mixed models (GLMM) with variable response from the Gaussian family (i.e. linear mixed models): one to explain the shape of the epidemic curve of accumulated cases and the other to estimate the effect of the intervention. Just one day after implementing the measures, the variation rate of accumulated cases decreased daily, on average, by 3.059 percentage points, (95% credibility interval: -5.371, -0.879). This reduction will be greater as time passes. The reduction in the variation rate of the accumulated cases, on the last day for which we have data, has reached 5.11 percentage points. The measures taken by the Spanish Government on March 14, 2020 to mitigate the epidemic curve of COVID-19 managed to flatten the curve and although they have not (yet) managed to enter the decrease phase, they are on the way to do so.
Keywords: COVID-19; Generalized linear mixed models; Mitigation; Physical distancing; R-INLA.
Copyright © 2020 Elsevier B.V. All rights reserved.
Conflict of interest statement
Declaration of competing interest The authors declare that they have no known competing financial interests or personal relationships that could have appeared to influence the work reported in this paper.
Figures
Similar articles
-
Impact of self-imposed prevention measures and short-term government-imposed social distancing on mitigating and delaying a COVID-19 epidemic: A modelling study.PLoS Med. 2020 Jul 21;17(7):e1003166. doi: 10.1371/journal.pmed.1003166. eCollection 2020 Jul. PLoS Med. 2020. PMID: 32692736 Free PMC article.
-
Modelling the initial epidemic trends of COVID-19 in Italy, Spain, Germany, and France.PLoS One. 2020 Nov 9;15(11):e0241743. doi: 10.1371/journal.pone.0241743. eCollection 2020. PLoS One. 2020. PMID: 33166344 Free PMC article.
-
Flexible, Freely Available Stochastic Individual Contact Model for Exploring COVID-19 Intervention and Control Strategies: Development and Simulation.JMIR Public Health Surveill. 2020 Sep 18;6(3):e18965. doi: 10.2196/18965. JMIR Public Health Surveill. 2020. PMID: 32568729 Free PMC article.
-
The Timing and Intensity of Social Distancing to Flatten the COVID-19 Curve: The Case of Spain.Int J Environ Res Public Health. 2020 Oct 6;17(19):7283. doi: 10.3390/ijerph17197283. Int J Environ Res Public Health. 2020. PMID: 33036132 Free PMC article.
-
COVID-19 and Italy: what next?Lancet. 2020 Apr 11;395(10231):1225-1228. doi: 10.1016/S0140-6736(20)30627-9. Epub 2020 Mar 13. Lancet. 2020. PMID: 32178769 Free PMC article. Review.
Cited by
-
Evaluating COVID-19 infection prevention measures in Malaysia: A fuzzy DEMATEL approach.Digit Health. 2023 Dec 6;9:20552076231211670. doi: 10.1177/20552076231211670. eCollection 2023 Jan-Dec. Digit Health. 2023. PMID: 38074341 Free PMC article.
-
Psychological distress during the COVID-19 pandemic in the population of Argentina.Medicine (Baltimore). 2021 Dec 23;100(51):e28333. doi: 10.1097/MD.0000000000028333. Medicine (Baltimore). 2021. PMID: 34941136 Free PMC article.
-
End of Life Intervention Program During COVID-19 in Vall d'Hebron University Hospital.Front Psychiatry. 2021 May 3;12:608973. doi: 10.3389/fpsyt.2021.608973. eCollection 2021. Front Psychiatry. 2021. PMID: 34040548 Free PMC article.
-
Robust trend estimation for COVID-19 in Brazil.Spat Spatiotemporal Epidemiol. 2021 Nov;39:100455. doi: 10.1016/j.sste.2021.100455. Epub 2021 Sep 13. Spat Spatiotemporal Epidemiol. 2021. PMID: 34774261 Free PMC article.
-
Changes in lifestyle resulting from confinement due to COVID-19 and depressive symptomatology: A cross-sectional a population-based study.Compr Psychiatry. 2021 Jan;104:152214. doi: 10.1016/j.comppsych.2020.152214. Epub 2020 Oct 20. Compr Psychiatry. 2021. PMID: 33186837 Free PMC article.
References
-
- European Centre for Disease Prevention and Control (ECDC) Outbreak of Acute Respiratory Syndrome Associated with a Novel Coronavirus, China: First Local Transmission in the EU/EEA − Third Update – 31st January 2020. 2020. https://www.ecdc.europa.eu/sites/default/files/documents/novel-coronavir... Available at.
-
- European Centre for Disease Prevention and Control (ECDC) Situation update worldwide, as of 6 April 2020. 2020. https://www.ecdc.europa.eu/en/geographical-distribution-2019-ncov-cases Available at.
-
- European Centre for Disease Prevention and Control (ECDC) Download today's data on the geographic distribution of COVID-19 cases worldwi, 2020. 2020. https://www.ecdc.europa.eu/en/publications-data/download-todays-data-geo... Available at.
-
- Gómez-Rubio V. Chapman and Hall/CRC; London, United Kingdom: 2020. Bayesian Inference with INLA. (Chapter 3)
-
- Novel Coronavirus Pneumonia Emergency Response Epidemiology Team . China CDC Weekly. 2020. The epidemiological characteristics of an outbreak of 2019 novel coronavirus diseases (COVID-19) in China; p. 2.http://www.ourphn.org.au/wp-content/uploads/20200225-Article-COVID-19.pdf Available at. - PMC - PubMed
MeSH terms
LinkOut - more resources
Full Text Sources
Miscellaneous
