. 2020 Apr 24:9:e53381.
doi: 10.7554/eLife.53381.

Squamous trans-differentiation of pancreatic cancer cells promotes stromal inflammation

Affiliations

Squamous trans-differentiation of pancreatic cancer cells promotes stromal inflammation

Tim Dd Somerville et al. Elife. .

Abstract

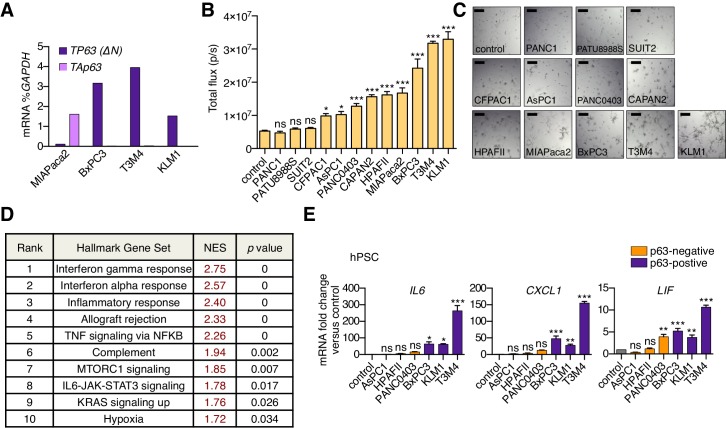
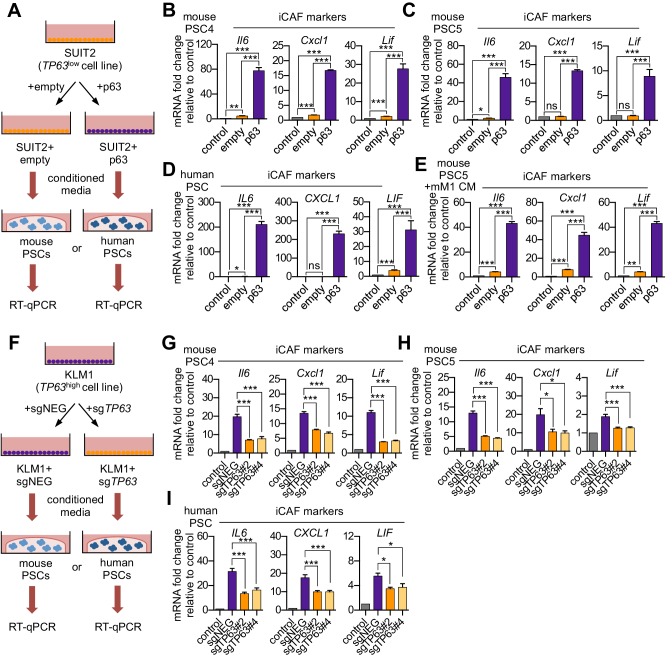
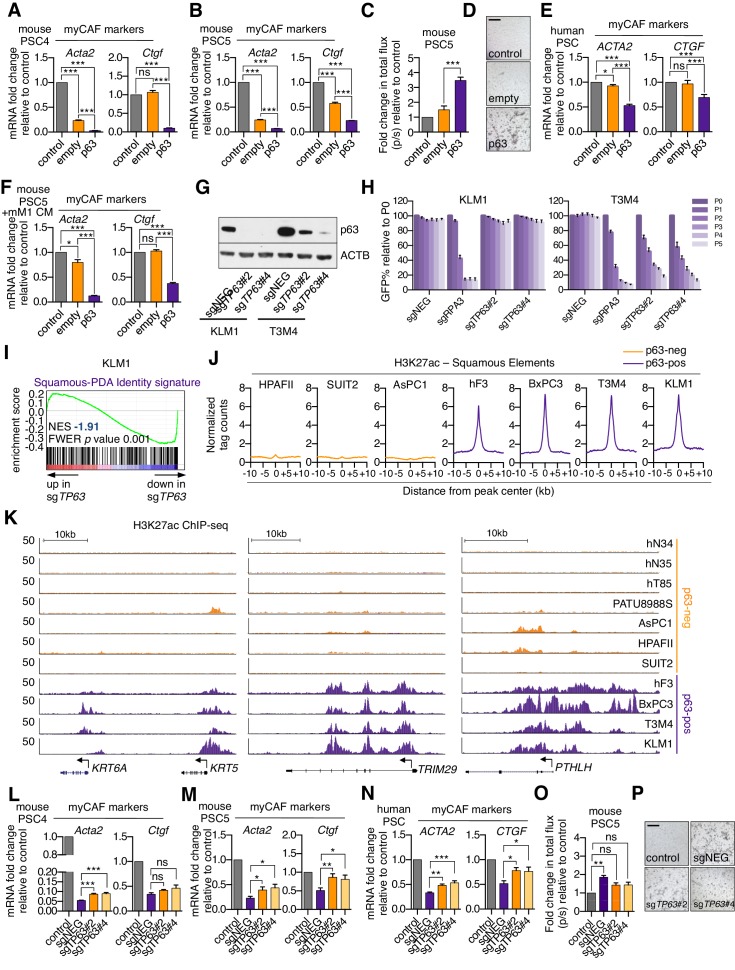
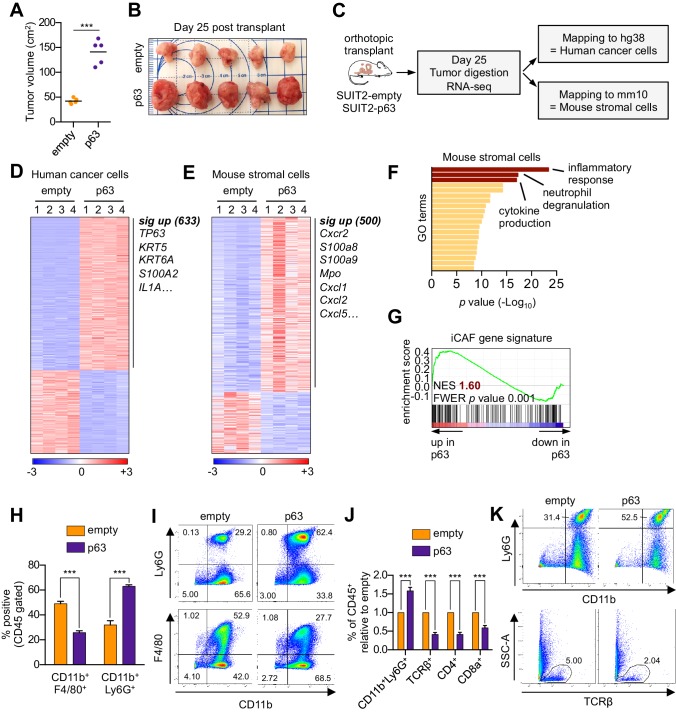
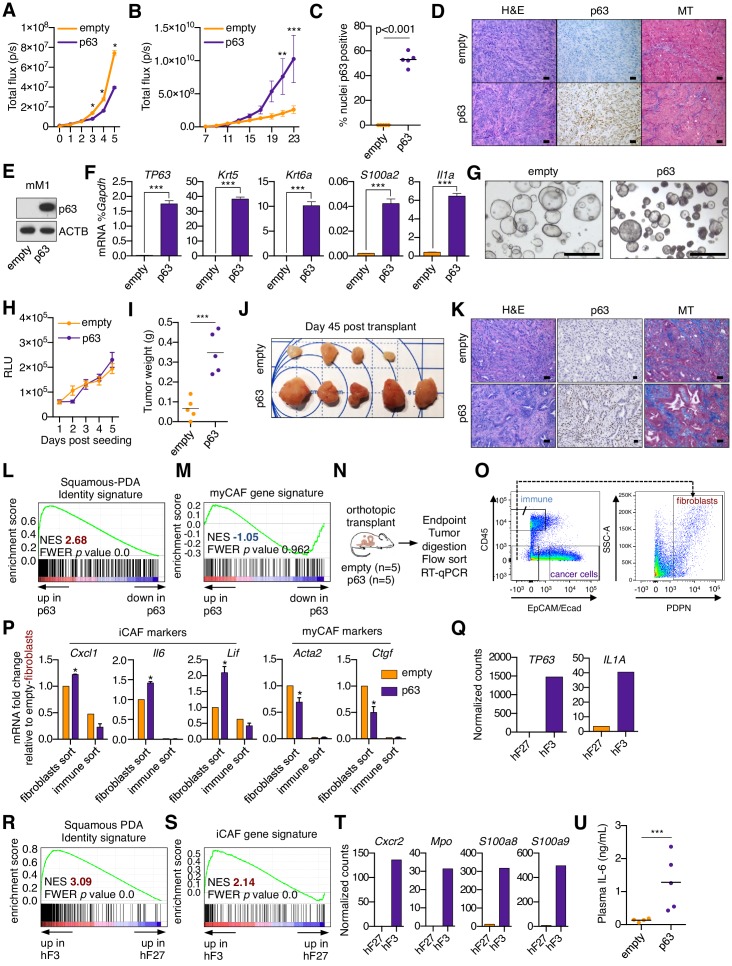
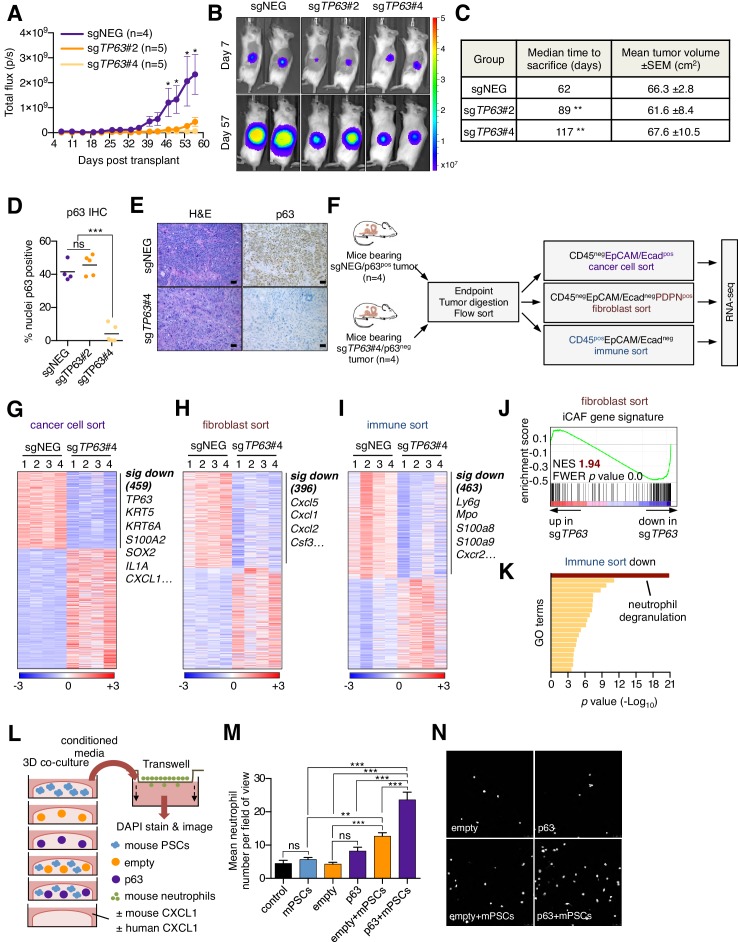
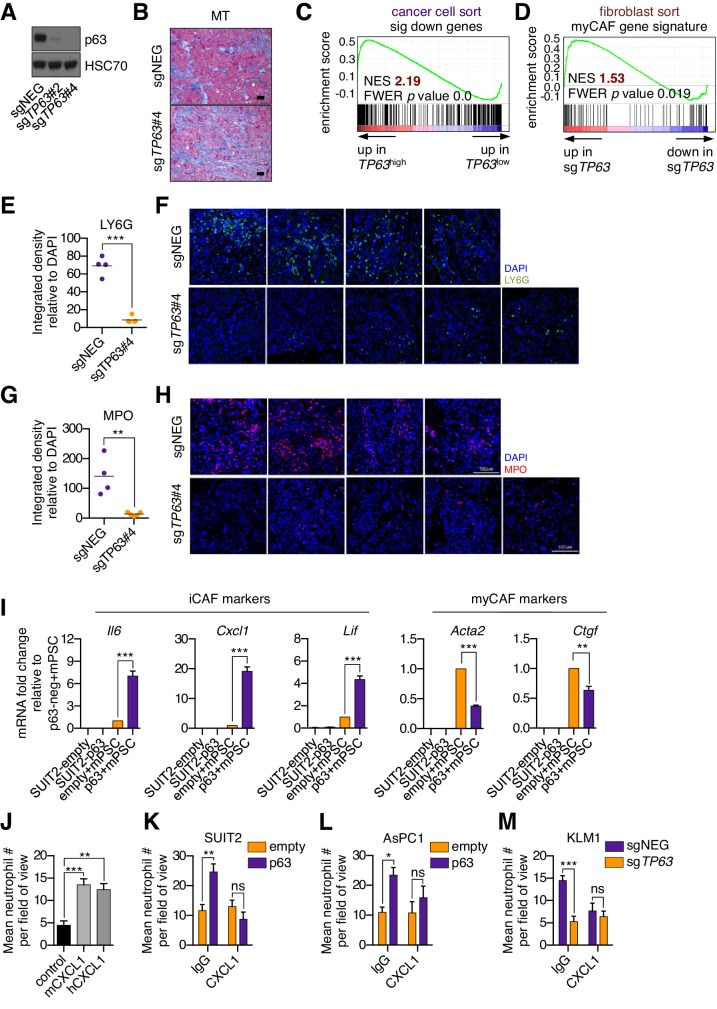
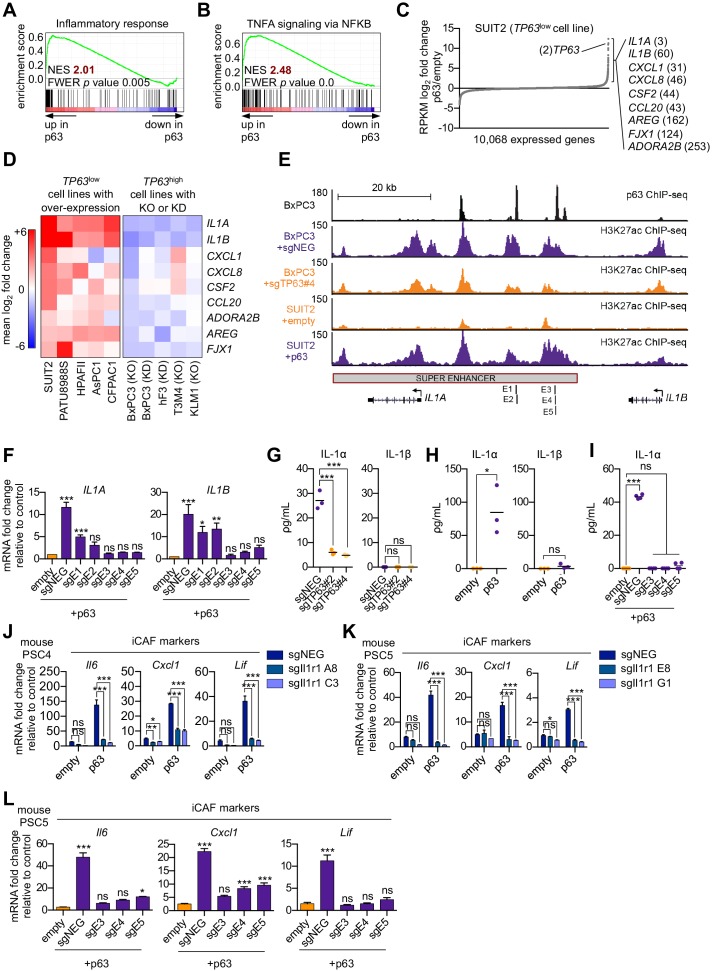
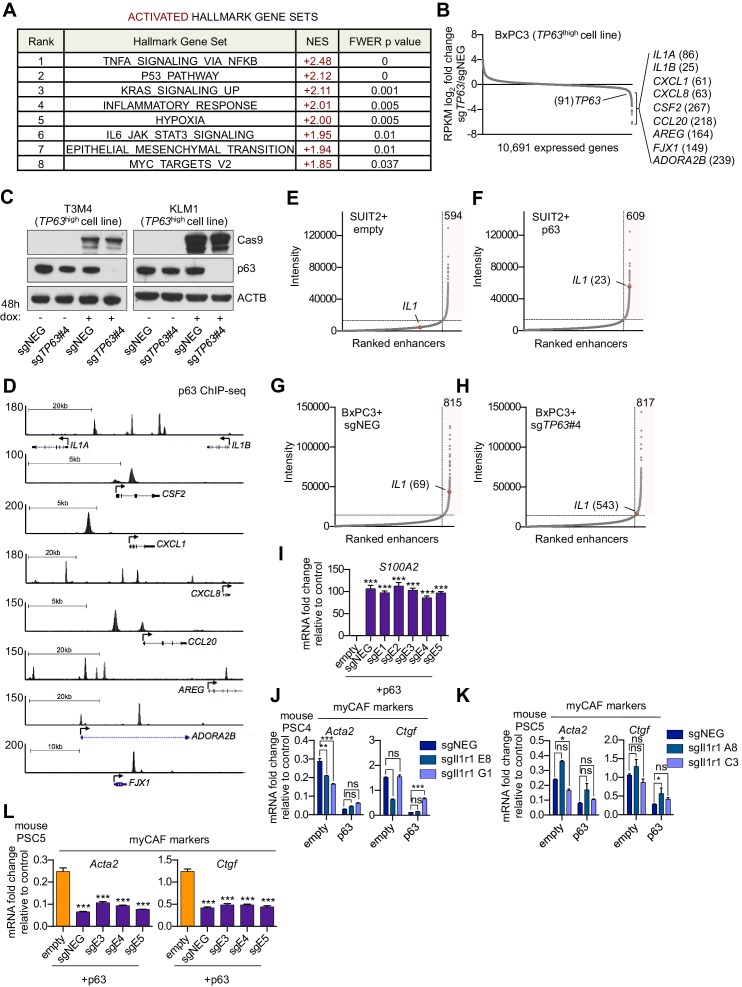
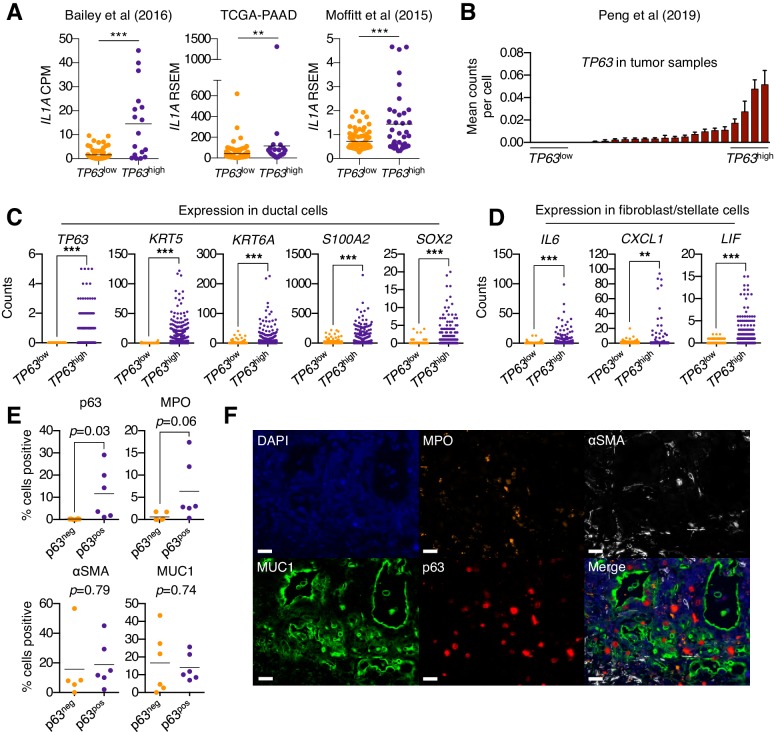
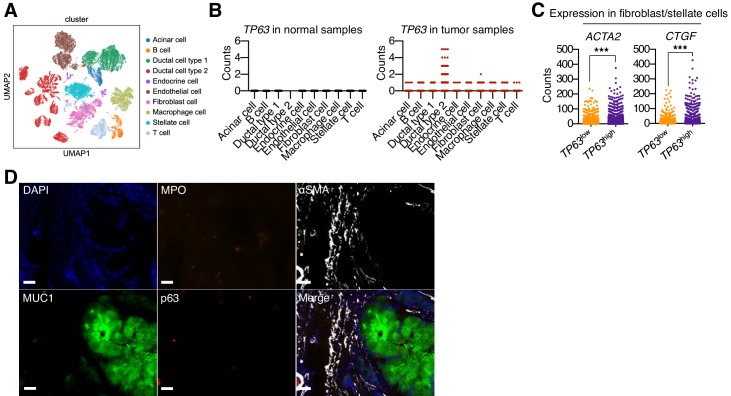
A highly aggressive subset of pancreatic ductal adenocarcinomas undergo trans-differentiation into the squamous lineage during disease progression. Here, we investigated whether squamous trans-differentiation of human and mouse pancreatic cancer cells can influence the phenotype of non-neoplastic cells in the tumor microenvironment. Conditioned media experiments revealed that squamous pancreatic cancer cells secrete factors that recruit neutrophils and convert pancreatic stellate cells into cancer-associated fibroblasts (CAFs) that express inflammatory cytokines at high levels. We use gain- and loss-of-function approaches to show that squamous-subtype pancreatic tumor models become enriched with neutrophils and inflammatory CAFs in a p63-dependent manner. These effects occur, at least in part, through p63-mediated activation of enhancers at pro-inflammatory cytokine loci, which includes IL1A and CXCL1 as key targets. Taken together, our findings reveal enhanced tissue inflammation as a consequence of squamous trans-differentiation in pancreatic cancer, thus highlighting an instructive role of tumor cell lineage in reprogramming the stromal microenvironment.

Keywords: TP63; cancer biology; cancer-associated fibroblasts; human; human biology; inflammation; medicine; mouse; pancreatic cancer; squamous; trans-differentiation.


Conflict of interest statement

TS, GB, JD, SH, XH, KV, KM, YX, DM, OK, OD, JP, MH, ME No competing interests declared, DT an advisor to Surface, Leap, and Cygnal and has stock ownership in Surface and Leap, CV has received funding from Boehringer-Ingelheim and is an advisor to KSQ Therapeutics.

Figures

Figure 1.
Figure 1.. A secretory phenotype of p63-positive PDA cells that promotes inflammatory gene expression changes in CAFs in vitro.
(A) Western blot analysis showing p63 expression in a panel of 12 human PDA cell lines. (B–C) Bar charts show expression of TP63 and KRT5 cell lines shown in (A). (D) Schematic of experimental workflow for RNA-seq analysis of PSCs following culture in Matrigel with conditioned media from the 12 human PDA cell lines. (E) Heatmap representation of unsupervised hierarchical clustering of mouse PSCs based on their global transcriptional profile. Scale bar indicates Pearson correlation coefficient. Control refers to control media, which was DMEM supplemented with 5% FBS. (F) Heatmap representation of differentially expressed genes from PSCs in Group 1 and Group 2. Selected genes in each group are listed. Scale bar indicates standardized expression value. (G) GSEA plot evaluating Hallmark Inflammatory Response genes based on their expression in Group 2 versus Group 1 cultures. (H–I) GSEA plots evaluating the iCAF and myCAF gene signatures in Group 2 versus Group 1 cultures.
Figure 1—figure supplement 1.
Figure 1—figure supplement 1.. A secretory phenotype of p63-positive PDA cells that promotes inflammatory gene expression changes in CAFs in vitro.
(A) Bar chart shows RT-qPCR analysis for TP63 isoforms in MIAPaca2, BxPC3, T3M4 and KLM1 PDA cell lines. (B) Luciferase-based quantification of mouse PSC proliferation in Matrigel following four days of culture with conditioned media from the indicated human PDA cell lines. Mean+ SEM is shown. n = 5 technical repeats (C) Representative bright-field images from (B). Scale bar indicates 200 μm. (D) Table summarizing GSEA evaluating Hallmark gene sets for their enrichment in Group 2 versus Group 1 cultures. Gene sets with a FWER p value < 0.05 are shown. (E) Bar chart showing RT-qPCR analysis for iCAF markers (IL6, CXCL1, LIF) following culture of human PSCs in Matrigel for four days with conditioned media from the indicated human cell lines. Mean+ SEM is shown. n = 3. ***p<0.001, **p<0.01, *p<0.05 by one-way ANOVA with Dunnett’s test for multiple comparisons. ns, not significant.
Figure 2.
Figure 2.. p63 expression in PDA cells drives a secretory phenotype that induces iCAF formation in vitro.
(A) Schematic of workflow for generating conditioned media from SUIT2-empty and SUIT2-p63 cells and subsequent analysis of PSC cultures. (B–C) Bar charts showing RT-qPCR analysis for iCAF markers (Il6, Cxcl1, Lif) following culture of 2 mouse PSC lines in Matrigel for four days with the indicated conditioned media. (D) RT-qPCR analysis for the iCAF markers (IL6, CXCL1, LIF) following culture of human PSCs in Matrigel for four days with the indicated conditioned media. (E) Mouse mM1 organoids were infected with a p63 cDNA or empty vector control. Bar chart shows RT-qPCR analysis for iCAF markers (Il6, Cxcl1, Lif) following culture of a mouse PSC line in Matrigel for four days in the indicated conditioned medias. (F) Schematic of workflow for generating conditioned media from KLM1-Cas9 cells infected with p63 sgRNAs (sgTP63#2 and sgTP63#4) or a control (sgNEG) and subsequent analysis of PSC cultures. (G–H) Bar chart showing RT-qPCR analysis for iCAF markers (Il6, Cxcl1, Lif) following culture of mouse PSCs in Matrigel for four days with the indicated conditioned media. (I) RT-qPCR analysis for iCAF markers (IL6, CXCL1, LIF) following culture of human PSCs in Matrigel for four days with the indicated conditioned media. For all experiments, control media represents DMEM supplemented with 5% FBS. Mean+ SEM is shown. Results are presented as the mean of three technical replicates and are representative of n = 3 biological replicates. For B-E, ***p<0.001, **p<0.01, *p<0.05 by Student’s t-test and for G-I, ***p<0.001, **p<0.01, *p<0.05 by one-way ANOVA with Dunnett’s test for multiple comparisons.
Figure 2—figure supplement 1.
Figure 2—figure supplement 1.. p63 expression in PDA cells drives a secretory phenotype that induces iCAF formation in vitro.
(A–B) Bar charts showing RT-qPCR analysis for myCAF markers (Acta2, Ctgf) following culture of the two mouse PSC lines in Matrigel for four days with conditioned media from SUIT2-empty or SUIT2-p63 cells. (C) Luciferase-based quantification of mouse PSC proliferation in Matrigel. (D) Representative bright-field images from (C). Scale bar indicates 500 μm. (E) Bar charts showing RT-qPCR analysis for myCAF markers (ACTA2, CTGF) following culture of human PSCs in Matrigel for four days with conditioned media from SUIT2-empty or SUIT2-p63 cells. (F) Bar chart shows RT-qPCR analysis for myCAF markers (Acta2, Ctgf) following culture of mouse PSCs in conditioned media from mM1-empty or mM1-p63 cells. (G) Representative western blot analysis for ACTB and p63 following p63 knock out in KLM1-Cas9 and T3M4-Cas9 cells. (H) Competition based GFP depletion assays of KLM1-Cas9 cells (left panel) or T3M4-Cas9 cells (right panel) following infection with the indicated sgRNAs linked to GFP. (I) GSEA plot evaluating the Squamous-PDA Identity signature following doxycycline-inducible knock out of p63 and subsequent RNA-seq analysis KLM1 cells. The Squamous-PDA Identity signature was defined previously (Somerville et al., 2018). (J–K) Metagene representation (J) and browser track examples (K) of H3K27ac signal at Squamous Elements in p63-negative and p63-positive PDA cells. Normal organoids: hN34, hN35; PDA organoids: hF3, hT85; PATU: PATU8988S. (L–N) Bar charts showing RT-qPCR analysis for myCAF marker genes following culture of two mouse PSC cell lines (L and M) or human PSCs (N) in Matrigel for four days with conditioned media from KLM1-Cas9 cells infected with the indicated sgRNA. (O) Luciferase-based quantification of mouse PSC proliferation in Matrigel cultured with conditioned media from KLM1-Cas9 cells infected with sgRNAs targeting TP63 or control (sgNEG). (P) Representative bright-field images from (O). Scale bar indicates 500 μm. For all experiments control media represents DMEM supplemented with 5% FBS. Matrigel only represents conditioned media from Matrigel cultured with control media only. Mean+ SEM is shown. n = 3. For A, B, E and F, ***p<0.001, **p<0.01, *p<0.05 by Student’s t-test and for C, ***p<0.001, **p<0.01, *p<0.05 by one-way ANOVA with Dunnett’s test for multiple comparisons. ns, not significant.
Figure 3.
Figure 3.. Ectopic expression of p63 in PDA cells promotes inflammation-associated transcriptional changes in the tumor microenvironment.
(A–I) SUIT2-empty and SUIT2-p63 PDA cells harboring a luciferase transgene were transplanted into the pancreas of NSG mice. (A–B) Quantification of tumor volume (A) and images of tumors (B) on day 25 post-transplantation. (C) Experimental workflow for RNA-seq analysis of bulk tumor tissue. (D–E) Heatmap representations of differentially expressed genes that unambiguously map to (D) the human genome and therefore are derived from human cancer cells or (E) the mouse genome and therefore are derived from mouse stromal cells. Selected genes in each group are listed. Scale bar indicates standardized expression value. (F) Ontology analysis of the 500 significantly up-regulated mouse genes using Metascape. GO terms are ranked by their significance (p value) and the most significant terms (-log10 p value > 15) are highlighted. (G) GSEA plot evaluating the iCAF signature in the mouse stromal compartment of SUIT2-p63 versus SUIT2-empty tumors. (H) Quantification of flow cytometry analysis of CD45+CD11b+Ly6G+ neutrophils and CD45+CD11b+F4/80+ macrophages from bulk tumor tissues from SUIT2 xenografts. n = 5 mice per group. ***p<0.001 by Student’s t-test. (I) Representative flow cytometry plots from (H). (J–K) KPC mM1 organoids with a p63 cDNA or empty vector control and transplanted to the pancreas of C57BL6 mice. (J) Quantification of flow cytometry analysis of CD45+ cells in the tumors. n = 4–5 mice per group. ***p<0.001 by Student’s t-test. (K) Representative flow cytometry plots from (J). TCRβ refers to T cell receptor β.
Figure 3—figure supplement 1.
Figure 3—figure supplement 1.. Ectopic expression of p63 in PDA cells promotes inflammation-associated transcriptional changes in the tumor microenvironment.
(A) Luciferase-based quantification of SUIT2-empty and SUIT2-p63 cell proliferation in vitro. Mean ± SEM values are shown. n = 6 technical repeats. (B) Quantification of the bioluminescence signal following transplantation of SUIT2- empty or SUIT2-p63 cells to the pancreas of NSG mice. Mean ± SEM in shown. Mice were imaged every two days between day seven and 23 post-transplantation. n = 5 mice per group. (C) Quantification of p63 expression by immunohistochemical staining of tumors. p value determined by Student’s t-test. (D) Representative images from (C). MT, Masson’s trichrome. Scale bar indicates 50 μm. (E) Representative western blot analysis for ACTB and p63 in mM1-empty or mM1-p63 cells. (F) Bar chart showing RT-qPCR analysis for squamous markers (TP63, Krt5, Krt6a and S100a2) and Il1a in mM1-empty and mM1-p63 cells. Mean+ SEM is shown. n = 3. (G) Representative bright-field images of mM1 organoid cultures. (H) Quantification of in vitro cell growth measured by CellTiter-Glo. RLU, relative luminescence units. (I–J) Quantification of tumor volume (I) and images of tumors (J) on day 45 post-transplantation of mM1 organoids to the pancreas of C57BL/6 mice. ***p<0.001 by Student’s t-test. (K) Representative images from (J). MT, Masson’s trichrome. Scale bar indicates 50 μm. (L) GSEA plot evaluating the Squamous-PDA Identity signature (Somerville et al., 2018) within the human cancer cell compartment of p63-positive versus negative tumors. (M) GSEA plot evaluating the myCAF signature in the mouse stromal compartment of SUIT2-p63 versus SUIT2-empty tumors. (N–P) RT-qPCR analysis of flow-sorted tumor samples. (N) Schematic of experimental workflow. (O) Representative flow cytometry plots showing the gating strategy for enriching human cancer cells, mouse fibroblasts and mouse immune cells. (P) Bar chart showing RT-qPCR analysis for the indicated genes in the indicated sorted fraction and tumor samples. ***p<0.001, **p<0.01, *p<0.05 by two-way ANOVA with Sidak’s test for multiple comparisons. (QT) Orthotopic tumors derived from hF3 (squamous/basal) and hF27 (progenitor/classical) human tumor organoids were subjected to RNA-seq analysis of the bulk tumor tissue. (Q) TP63 and IL1A expression in the human cancer cell compartment of the tumors. (R) GSEA plot evaluating the Squamous PDA identity signature in the human cancer cell compartment of hF3 versus hF27 tumors. (S) GSEA plot evaluating the iCAF signature in the mouse stromal compartment of hF3 versus hF27 tumors. (T) Expression levels of genes preferentially expressed on neutrophils in the mouse stromal cell compartment of the hF3 and hF27 tumors. Data are from Miyabayashi et al (currently under review). (U) ELISA of IL-6 in the plasma of mice from (J) at end point. n = 4–5 mice per group. ***p<0.001 by Student’s t-test.
Figure 4.
Figure 4.. Knockout of p63 in an orthotopic PDA tumor model attenuates stromal inflammation.
(A–E) KLM1-Cas9 cells expressing a luciferase transgene were infected with two independent p63 or control (sgNEG) sgRNAs and transplanted to the pancreas of NSG mice. (A) Quantification of bioluminescence signal. Mean ± SEM is shown. Mice were imaged every four days between day 7 and day 57 post-transplantation. n = 4–5 mice per group. *p<0.05 by two-way ANOVA with Sidak’s test for multiple comparisons. (B) Representative images at day 7 and day 57 post-transplantation from (A). (C) Table summarizing the median time mice from each group were sacrificed and the tumor volume at endpoint. Endpoint was determined as a bioluminescence signal >3×10⁹ p/s for each individual mouse. **p<0.01 by log rank (Mantel-Cox) test. (D) Quantification of p63 expression as determined by immunohistochemical staining of tumors from the indicated experimental groups. n = 4–5 mice per group. ***p<0.001 by one-way ANOVA with Tukey’s test for multiple comparisons. (E) Representative images from (D). Scale bar indicates 50 μm. (F) Schematic of experimental workflow and sorting strategy for enriching for human cancer cells, mouse fibroblasts and mouse immune cells and subsequent RNA-seq analysis. (G–I) Heatmap representations of differentially expressed genes from the human cancer cell compartment (G), mouse fibroblast compartment (H) and mouse immune compartment (I) and the indicated tumor samples. Selected genes in each group are listed. Scale bar indicates standardized expression value. (J) GSEA plot evaluating the iCAF signature in the mouse fibroblast compartment of p63-positive versus control (sgNEG) tumors. (K) Ontology analysis of the 463 significantly down-regulated mouse genes from immune compartment using Metascape. GO terms are ranked by their significance (p value) and the most significant term (-log10 p value > 15) is highlighted. (L–N) SUIT2-empty or SUIT2-p63 cells were cultured in isolation or together with mouse PSCs in Matrigel for four days before conditioned media was harvested and used for a trans-well migration assay with freshly isolated mouse neutrophils. (L) Schematic of experimental workflow. (M) Quantification of trans-well neutrophil migration in the indicated media conditions as determined by confocal imaging. Mean+ SEM is shown. Results are presented as the mean number of invading neutrophils per 10 random fields for each condition and are representative of n = 3 biological replicates. ***p<0.001, **p<0.01 by two-way ANOVA with Sidak’s test for multiple comparisons. All significant interactions are shown. (N) Representative confocal images from (M).
Figure 4—figure supplement 1.
Figure 4—figure supplement 1.. Knockout of p63 in an orthotopic PDA tumor model attenuates the inflammatory signature of fibroblasts and immune cells.
(A) Western blot analysis for HSC70 and p63 in the KLM1-Cas9 cells following p63 knock out with CRISPR. (B) Representative images from Figure 4D. Scale bar indicates 50 μm. MT, Masson’s trichrome. (C) GSEA plot evaluating the 459 significantly down-regulated human genes based on their expression in TP63high versus TP63low PDA patient samples from the study by Bailey et al. (2016). Patients were designated as TP63high or TP63low as described in Somerville et al. (2018). (D) GSEA plot evaluating the myCAF signature in FACS-purified fibroblasts from p63-positive (sgNEG) or p63 knockout tumors. (E–H) Quantification of LY6G (E) and MPO (G) expression as determined by immunofluorescence staining of tumors from the indicated experimental groups. n = 4–5 mice per group. ***p<0.001, **p<0.01 by Student’s t-test. Representative images for LY6G (F) and MPO (H) are shown. Scale bar indicates 100 μm and applies to all images. (I) Bar charts show RT-qPCR analysis for the iCAF markers (Il6, Cxcl1, Lif; left panel) and myCAF markers (Acta2, Ctgf; right panel) in the indicated culture conditions. Mean+ SEM is shown. n = 3. ***p<0.001, **p<0.01 by Student’s t-test. (J) Quantification of trans-well neutrophil migration stimulated by murine (mCXCL1) or human CXCL1 (hCXCL1) as determined by confocal imaging. These experiments were performed alongside the SUIT2-empty or SUIT2-p63 cells co-culture experiments shown in the main figure as positive controls. Mean+ SEM is shown. Results are presented as the mean number of invading neutrophils per 10 random fields for each condition and are representative of n = 3 biological replicates. ***p<0.001, **p<0.01 by two-way ANOVA with Sidak’s test for multiple comparisons. (K–M) Conditioned media was harvested from SUIT2-empty or SUIT2-p63 cells (K), AsPC1-empty or AsPC1-p63 cells (L), or KLM1-Cas9 cells infected with sgRNAs targeting TP63 or a control sgRNA (sgNEG) (M) after four days and used for trans-well migration assays with freshly isolated mouse neutrophils in the presence of a CXCL1 blocking antibody or IgG control. Bar charts show quantification of trans-well neutrophil migration in the indicated media conditions as determined by confocal imaging. Mean+ SEM is shown. n = 3. ***p<0.001, **p<0.01, *p<0.05 by two-way ANOVA with Sidak’s test for multiple comparisons. ns, not significant.
Figure 5.
Figure 5.. p63 activates enhancer elements and transcription of genes encoding pro-inflammatory cytokines in PDA cells.
(A–B) GSEA plots evaluating the indicated Hallmark gene signatures upon p63 expression in SUIT2 cells. (C) Scatter plot shows the mean log2 fold change of expressed genes upon p63 expression in SUIT2 cells. Genes with a mean log2 fold change >1 in this dataset and the BxPC3+sgTP63 dataset (Figure 5—figure supplement 1B) that are also found in the gene signatures shown in A and B are highlighted along with the rank. Data are from Somerville et al. (2018). (D) Heatmap shows gene expression changes in those genes shown in (C) in the indicated cell lines following p63 over-expression (left panel) or knockout/knockdown (right panel). Scale bar indicates mean log2 fold change versus control. (E) ChIP-seq profiles of p63 (top track) and H3K27ac (bottom four tracks) following p63 knockout in BxPC3 cells or overexpression in SUIT2 cells surrounding the IL1 locus. The H3K27ac regions identified as a super enhancer by ROSE analysis are indicated along with the positions of sgRNAs targeting this enhancer used for experiments shown in (F) and (I). (F) RT-qPCR analysis for IL1A and IL1B in SUIT2-empty or SUIT2-p63 cells infected with dCas9 fused with the KRAB repression domain and the indicated sgRNAs. The positions of the sgRNAs targeting the IL1 super enhancer are shown in (E). (G–H) ELISA for IL-1α and IL-1β from conditioned media harvested from KLM1-Cas9 cells infected with the indicated sgRNA (G) or from SUIT2-empty and SUIT2-p63 cells (H). (I) ELISA for IL-1α in SUIT2-empty or SUIT2-p63 cells infected with dCas9 fused with the KRAB repression domain and the indicated sgRNAs. (J–K) Bar charts showing RT-qPCR analysis for iCAF markers (Il6, Cxcl1, Lif) following culture of clones of two mouse PSC lines from which the IL-1 receptor was clonally knocked out with CRISPR in Matrigel for four days with conditioned media from SUIT2-empty or SUIT2-p63 cells. (L) Bar charts showing RT-qPCR analysis for iCAF markers (Il6, Cxcl1, Lif) following culture of PSCs in Matrigel for four days with the conditioned media harvested from cells shown in (I). For all experiments, control media represent DMEM supplemented with 5% FBS. Mean+ SEM is shown. For RT-qPCR experiments, results are presented as the mean of three technical replicates and are representative of n = 3 biological replicates and ***p<0.001, **p<0.01, *p<0.05 by one-way ANOVA with Dunnett’s test for multiple comparisons. For each ELISA experiment, n = 3 biological replicates and ***p<0.001, **p<0.01, *p<0.05 by one-way ANOVA with Tukey’s test for multiple comparisons. ns = not significant.
Figure 5—figure supplement 1.
Figure 5—figure supplement 1.. p63 activates enhancer elements and transcription of genes encoding pro-inflammatory cytokines in PDA cells.
(A) Table shows evaluation of the indicated Hallmark gene sets by GSEA upon p63 expression in SUIT2 cells. Gene sets are ranked by their NES score and only those with a FWER p value < 0.05 are shown. (B) Scatter plot shows the mean log2 fold change of expressed genes upon p63 knock out in BxPC3 cells. Genes with a mean log2 fold change >1 in this dataset and the SUIT2-p63 dataset (Figure 5C) that are also found in the gene signatures shown in Figure 5A and Figure 5B are highlighted along with the rank. Data are from Somerville et al. (2018). (C) Representative western blot analysis for ACTB, p63 and Cas9 in KLM1 and T3M4 cells lentivirally transduced with a doxycycline-inducible Cas9 vector and the indicated sgRNA. (D) ChIP-seq profiles of p63 in BxPC3 cells surrounding the genes shown in Figure 5D. (E–H) Scatter plots showing enhancers ranked by intensity in SUIT2-empty (E), SUIT2-p63 (F) and BxPC3-Cas9 cells transduced with a control sgRNA (G) or a sgRNA targeting TP63 (H). Shaded box highlights the number of super enhancers identified and the super enhancer associated with the IL1 locus is highlighted along with its rank. (I) RTqPCR analysis for S100A2 in SUIT2-empty or SUIT2-p63 cells infected with dCas9 fused with the KRAB repression domain and the indicated sgRNAs. Mean+ SEM is shown. n = 3. ***p<0.001, **p<0.01, *p<0.05 versus empty control by one-way ANOVA with Dunnett’s test for multiple comparisons. (J–K) Bar charts showing RT-qPCR analysis for the indicated myCAF markers (Acta2, Ctgf) following culture of two mouse PSC lines from which the IL1 receptor was clonally knocked out with CRISPR in Matrigel for four days with conditioned media from SUIT2-empty or SUIT2-p63 cells. (L) Bar charts showing RT-qPCR analysis for myCAF markers (Acta2, Ctgf) following culture of PSCs in Matrigel for four days with the conditioned media harvested from cells shown in Figure 5I. Mean+ SEM is shown. n = 3. ***p<0.001, **p<0.01, *p<0.05 by one-way ANOVA with Dunnett’s test for multiple comparisons.
Figure 6.
Figure 6.. Squamous trans-differentiation of PDA cells correlates with increased inflammatory fibroblasts and neutrophil infiltration in patient samples.
(A) Quantification of IL1A mRNA levels in the indicated studies. Each dot represents one patient sample, and patients were stratified as TP63high or TP63low as described in Somerville et al. (2018). (B–D) Single cell RNA-seq data from 24 primary PDA tumor and 11 normal pancreas samples from the study by Peng et al. (2019). (B) 24 primary PDA tumor samples ranked by mean TP63 expression levels across all cell types. Patients were stratified as TP63high (n = 4) or TP63low (n = 4) as shown. (C) Expression of squamous genes in ductal cells from TP63high or TP63low PDA patient samples from (B). (D) Expression of inflammatory genes (IL6, CXCL1 and LIF) in stellate cells and fibroblast cells from TP63high or TP63low PDA patient samples from (B). Each dot represents a single cell and the four patient samples were pooled for this analysis. (E–F) Multiplex immunofluorescent staining of primary pancreatic cancer tumor from the Rapid Autopsy Program. (E) Quantification of p63, MPO, αSMA and MUC1 in p63-negative (p63neg, n = 6) and p63-positive (p63pos, n = 6) samples. (F) Representative images of a p63-positive PDA tumor stained with DAPI (blue), MPO (orange), αSMA (white), MUC1 (green), p63 (red), and overlaid (merge). The images were collected from the same tumor area, but over multiple rounds of iterative staining. Scale bar indicates 20 μm. For (A), (C) and (D) ***p<0.001, **p<0.01 by Student’s t-test. ns, not significant.
Figure 6—figure supplement 1.
Figure 6—figure supplement 1.. p63 expression in PDA cells is associated with inflammatory CAF induction and neutrophil infiltration in patient samples.
(A–C) Single cell RNA-seq data from 24 primary PDA tumor and 11 normal pancreas samples from the study by Peng et al. (2019). (A) UMAP representation of cell clusters identified from analysis of 57,530 cells from all samples (15,544 cells from normal tissue and 41,986 from tumor tissue). Cluster were re-derived from the Peng et al study. (B) TP63 expression across cell types shown in (A) from normal samples (left) or tumor samples (right). (C) Expression of myofibroblastic genes (ACTA2 and CTGF) in stellate cells and fibroblast cells from TP63high or TP63low PDA patient samples. Each dot represents a single cell and the four patient samples were pooled for this analysis. ***p<0.001 by Student’s t-test. (D) Multiplex immunoflourescent staining of primary pancreatic cancer tumor from the Rapid Autopsy Program. Representative images of a p63-negative PDA tumor stained with DAPI (blue), MPO (orange), αSMA (white), Muc1 (green), P63 (red), overlaid (merge). The images were collected from the same area but over multiple rounds of iterative staining. Scale bar indicates 20 μm.

Similar articles

Cited by

References

    1. Ahdesmäki MJ, Gray SR, Johnson JH, Lai Z. Disambiguate: an open-source application for disambiguating two species in next generation sequencing data from grafted samples. F1000Research. 2016;5:2741. doi: 10.12688/f1000research.10082.1. - DOI - PMC - PubMed
    1. Albrengues J, Shields MA, Ng D, Park CG, Ambrico A, Poindexter ME, Upadhyay P, Uyeminami DL, Pommier A, Küttner V, Bružas E, Maiorino L, Bautista C, Carmona EM, Gimotty PA, Fearon DT, Chang K, Lyons SK, Pinkerton KE, Trotman LC, Goldberg MS, Yeh JT, Egeblad M. Neutrophil extracellular traps produced during inflammation awaken dormant Cancer cells in mice. Science. 2018;361:eaao4227. doi: 10.1126/science.aao4227. - DOI - PMC - PubMed
    1. Andreu P, Johansson M, Affara NI, Pucci F, Tan T, Junankar S, Korets L, Lam J, Tawfik D, DeNardo DG, Naldini L, de Visser KE, De Palma M, Coussens LM. FcRgamma activation regulates inflammation-associated squamous carcinogenesis. Cancer Cell. 2010;17:121–134. doi: 10.1016/j.ccr.2009.12.019. - DOI - PMC - PubMed
    1. Andricovich J, Perkail S, Kai Y, Casasanta N, Peng W, Tzatsos A. Loss of KDM6A activates Super-Enhancers to induce Gender-Specific Squamous-like pancreatic Cancer and confers sensitivity to BET inhibitors. Cancer Cell. 2018;33:512–526. doi: 10.1016/j.ccell.2018.02.003. - DOI - PMC - PubMed
    1. Bailey P, Chang DK, Nones K, Johns AL, Patch AM, Gingras MC, Miller DK, Christ AN, Bruxner TJ, Quinn MC, Nourse C, Murtaugh LC, Harliwong I, Idrisoglu S, Manning S, Nourbakhsh E, Wani S, Fink L, Holmes O, Chin V, Anderson MJ, Kazakoff S, Leonard C, Newell F, Waddell N, Wood S, Xu Q, Wilson PJ, Cloonan N, Kassahn KS, Taylor D, Quek K, Robertson A, Pantano L, Mincarelli L, Sanchez LN, Evers L, Wu J, Pinese M, Cowley MJ, Jones MD, Colvin EK, Nagrial AM, Humphrey ES, Chantrill LA, Mawson A, Humphris J, Chou A, Pajic M, Scarlett CJ, Pinho AV, Giry-Laterriere M, Rooman I, Samra JS, Kench JG, Lovell JA, Merrett ND, Toon CW, Epari K, Nguyen NQ, Barbour A, Zeps N, Moran-Jones K, Jamieson NB, Graham JS, Duthie F, Oien K, Hair J, Grützmann R, Maitra A, Iacobuzio-Donahue CA, Wolfgang CL, Morgan RA, Lawlor RT, Corbo V, Bassi C, Rusev B, Capelli P, Salvia R, Tortora G, Mukhopadhyay D, Petersen GM, Munzy DM, Fisher WE, Karim SA, Eshleman JR, Hruban RH, Pilarsky C, Morton JP, Sansom OJ, Scarpa A, Musgrove EA, Bailey UM, Hofmann O, Sutherland RL, Wheeler DA, Gill AJ, Gibbs RA, Pearson JV, Waddell N, Biankin AV, Grimmond SM, Australian Pancreatic Cancer Genome Initiative Genomic analyses identify molecular subtypes of pancreatic Cancer. Nature. 2016;531:47–52. doi: 10.1038/nature16965. - DOI - PubMed

Publication types

Associated data