. 2020 Apr 18;21(8):2830.
doi: 10.3390/ijms21082830.

TNFAIP3 Deficiency Affects Monocytes, Monocytes-Derived Cells and Microglia in Mice

Affiliations

TNFAIP3 Deficiency Affects Monocytes, Monocytes-Derived Cells and Microglia in Mice

Francesca Montarolo et al. Int J Mol Sci. .

Abstract

The intracellular-ubiquitin-ending-enzyme tumor necrosis factor alpha-induced protein 3 (TNFAIP3) is a potent inhibitor of the pro-inflammatory nuclear factor kappa-light-chain-enhancer of activated B cell (NF-kB) pathway. Single nucleotide polymorphisms in TNFAIP3 locus have been associated to autoimmune inflammatory disorders, including Multiple Sclerosis (MS). Previously, we reported a TNFAIP3 down-regulated gene expression level in blood and specifically in monocytes obtained from treatment-naïve MS patients compared to healthy controls (HC). Myeloid cells exert a key role in the pathogenesis of MS. Here we evaluated the effect of specific TNFAIP3 deficiency in myeloid cells including monocytes, monocyte-derived cells (M-MDC) and microglia analyzing lymphoid organs and microglia of mice. TNFAIP3 deletion is induced using conditional knock-out mice for myeloid lineage. Flow-cytometry and histological procedures were applied to assess the immune cell populations of spleen, lymph nodes and bone marrow and microglial cell density in the central nervous system (CNS), respectively. We found that TNFAIP3 deletion in myeloid cells induces a reduction in body weight, a decrease in the number of M-MDC and of common monocyte and granulocyte precursor cells (CMGPs). We also reported that the lack of TNFAIP3 in myeloid cells induces an increase in microglial cell density. The results suggest that TNFAIP3 in myeloid cells critically controls the development of M-MDC in lymphoid organ and of microglia in the CNS.

Keywords: TNFAIP3; inflammation; microglia; monocyte and macrophage; myeloid cells.


Conflict of interest statement

The authors declare no conflicts of interest.

Figures

Figure 1
Figure 1
Body weight analysis of 3 month-old WT and TNFAIP3cx3cr1-KO mice. The analysis of body weight reports that at 3 months of age, TNFAIP3cx3cr1-KO mice are smaller compared to their WT littermates (n = 7 for each group) (Mann–Whitney test, p = 0.014 * p < 0.05).
Figure 2
Figure 2
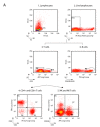
Flow-cytometry gating strategy used for spleen and lymph nodes. (A) Gating strategy for lymphocytes, NK and B cells; (1) FS versus SS gating was used to discriminate cells based on their size; (2) living cells were then identified by propidium iodide negativity; (3) CD3 was used as a T-cell marker; (4) CD3+ cells were distinguished based on the presence of CD4 and CD8; (5) NK and NK T were distinguished based on the presence of CD49b; (6) CD45R was used as a B-cell marker. (B) Gating strategy for macrophages, monocytes and DCs; (1) FS versus SS gating was used to discriminate cells based on their size; (2) living cells were then identified by propidium iodide negativity; (3–4) F4/80 gating on CD11b+ cells was used to select macrophages; (5) Ly6-C and Ly6-G gating on CD11b+ cells was used to select monocytes; (6) DCs were distinguished based on the presence of CD11c and CD86. (NK, natural killer; FS, forward scatter; SS side scatter; DCs, dendritic cells).
Figure 2
Figure 2
Flow-cytometry gating strategy used for spleen and lymph nodes. (A) Gating strategy for lymphocytes, NK and B cells; (1) FS versus SS gating was used to discriminate cells based on their size; (2) living cells were then identified by propidium iodide negativity; (3) CD3 was used as a T-cell marker; (4) CD3+ cells were distinguished based on the presence of CD4 and CD8; (5) NK and NK T were distinguished based on the presence of CD49b; (6) CD45R was used as a B-cell marker. (B) Gating strategy for macrophages, monocytes and DCs; (1) FS versus SS gating was used to discriminate cells based on their size; (2) living cells were then identified by propidium iodide negativity; (3–4) F4/80 gating on CD11b+ cells was used to select macrophages; (5) Ly6-C and Ly6-G gating on CD11b+ cells was used to select monocytes; (6) DCs were distinguished based on the presence of CD11c and CD86. (NK, natural killer; FS, forward scatter; SS side scatter; DCs, dendritic cells).
Figure 3
Figure 3
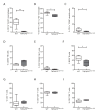
Flow-cytometry analysis performed on spleen obtained from 3 month-old WT and TNFAIP3cx3cr1-KO mice. The analysis reveals that the percentage number of CD11b+F4/80+ macrophages (A, p = 0.004), CD11b+Ly-6C+Ly-6G+ monocytes (B, p = 0.016), CD11c+CD86+ DCs (C, p = 0.048) and B200+ B (F, p = 0.048) cells is reduced in TNFAIP3cx3cr1-KO mice compared to their WT littermates. No differences are reported in CD49+NK (D, p = 0.214) and CD3+ CD49+NK T cells (E, p = 0.153) CD3+ T (G, p = 0.367), CD3+CD4+ T helper (H, p = 0.683) and CD3+CD8+ cytotoxic T cells (I, p = 0.109) (WT n = 8; TNFAIP3cx3cr1-KO n = 4) (Mann–Whitney test, ** p < 0.01; * p < 0.05). (DCs, dendritic cells; NK, natural killer).
Figure 4
Figure 4
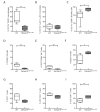
Flow-cytometry analysis performed on lymph nodes obtained from 3 month-old WT and TNFAIP3cx3cr1-KO mice. The analysis reveals that the percentage number of CD11b+F4/80+ macrophages (A, p = 0.006), CD49+ NK (D, p = 0.009) and CD3+CD49+ NK T (E, p = 0.009) cells is reduced in TNFAIP3cx3cr1-KO mice compared to their WT littermates. No differences are reported in CD11b+Ly-6C+Ly-6G+ monocytes (B, p = 0.914), CD3+ T (G, p = 0.114) and CD3+CD4+ T helper cells (H, p = 0.066). The percentage number of CD11c+CD86+ DCs (C, p = 0.019), B200+ B (F, p = 0.019) and CD3+CD8+ cytotoxic T (I, p = 0.009) cells is increased in TNFAIP3cx3cr1-KO mice compared to their WT littermates. (WT n = 8; TNFAIP3cx3cr1-KO n = 4) (Mann–Whitney test, ** p < 0.01; * p < 0.05). (DCs, dendritic cells; NK, natural killer).
Figure 5
Figure 5
Flow-cytometry gating strategy used for bone marrow. Gating strategy for CMPs and CMGPs; (1) FS versus SS gating was used to discriminate cells based on their size; (2) living cells were then identified by propidium iodide negativity; (3) Lin- and (4) Sca-1- cells were gated based on the presence of (5) CD34 and c-kit; (6) CMPs and CMGPs were distinguished based on the presence of CD16CD32. (CMPs, common myeloid precursors; CMGPs, common monocyte and granulocyte precursor; FS, forward scatter; SS side scatter).
Figure 6
Figure 6
Flow-cytometry analysis performed on bone marrow obtained from 3 month-old WT and TNFAIP3cx3cr1-KO mice. No differences are highlighted between WT and TNFAIP3cx3cr1-KO mice in the percentage number of the Lin-Sca1-c-kit+CD34+CD16CD32+ CMPs (A, p = 0.073). However, the percentage number of the CMGPs is reduced in TNFAIP3cx3cr1-KO mice compared to their WT littermates (B, p = 0.006). (WT n = 8; TNFAIP3cx3cr1-KO n = 4) (Mann–Whitney test, ** p < 0.01). (CMPs, common myeloid precursors; CMGPs, common monocyte and granulocyte precursor).
Figure 7
Figure 7
Ib1a+ microglial cells in the corpus callosum and in the spinal cord obtained from 3 month-old WT and TNFAIP3cx3cr1-KO mice. (AD; FI) Representative images of coronal section of corpus callosum (AD) and spinal cord (FI) of WT (A,C,F,H) and TNFAIP3cx3cr1-KO (B,D,G,I) mice immunostained with Iba1 antibody. Scale bar, 250 µm for A–B, F–G; 50 µm for C–D, H–I. (E,L) Quantitative analysis of the Iba1+ cell density in corpus callosum (E) and spinal cord (L) of WT and TNFAIP3cx3cr1-KO mice discloses an increased microglial cell density in the corpus callosum of TNFAIP3cx3cr1-KO mice compared to their WT littermates (E, p = 0.024). No differences are highlighted in the cervical spinal cord of TNFAIP3cx3cr1-KO mice compared to their WT littermates (L, p = 0.548). (WT n = 6; TNFAIP3cx3cr1-KO n = 3) (Mann–Whitney test, * p < 0.05). (Iba1, Ionized calcium binding adaptor molecule 1).

Similar articles

Cited by

References

    1. Serhan C.N., Levy B.D., Serhan C.N., Levy B.D. Resolvins in inflammation: Emergence of the pro-resolving superfamily of mediators. J. Clin. Investig. 2018;128:2657–2669. doi: 10.1172/JCI97943. - DOI - PMC - PubMed
    1. Pasparakis M. Regulation of tissue homeostasis by NF-kappaB signalling: Implications for inflammatory diseases. Nat. Rev. Immunol. 2009;9:778–788. doi: 10.1038/nri2655. - DOI - PubMed
    1. Ruland J. Return to homeostasis: Downregulation of NF-κB responses. Nat. Immunol. 2011;12:709–714. doi: 10.1038/ni.2055. - DOI - PubMed
    1. Das T., Chen Z., Hendriks R.W., Kool M. A20/Tumor Necrosis Factor α-Induced Protein 3 in Immune Cells Controls Development of Autoinflammation and Autoimmunity: Lessons from Mouse Models. Front. Immunol. 2018;9:104. doi: 10.3389/fimmu.2018.00104. - DOI - PMC - PubMed
    1. Vereecke L., Beyaert R., van Loo G. The ubiquitin-editing enzyme A20 (TNFAIP3) is a central regulator of immunopathology. Trends Immunol. 2009;30:383–391. doi: 10.1016/j.it.2009.05.007. - DOI - PubMed

MeSH terms

Substances

LinkOut - more resources