. 2020 Apr 14;31(2):107515.
doi: 10.1016/j.celrep.2020.03.079.

AMPAR Auxiliary Protein SHISA6 Facilitates Purkinje Cell Synaptic Excitability and Procedural Memory Formation

Affiliations

AMPAR Auxiliary Protein SHISA6 Facilitates Purkinje Cell Synaptic Excitability and Procedural Memory Formation

Saša Peter et al. Cell Rep. .

Abstract

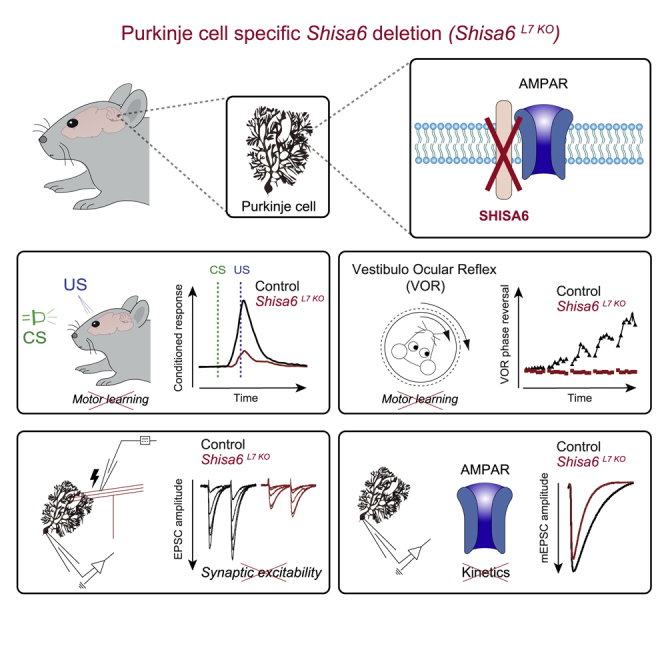
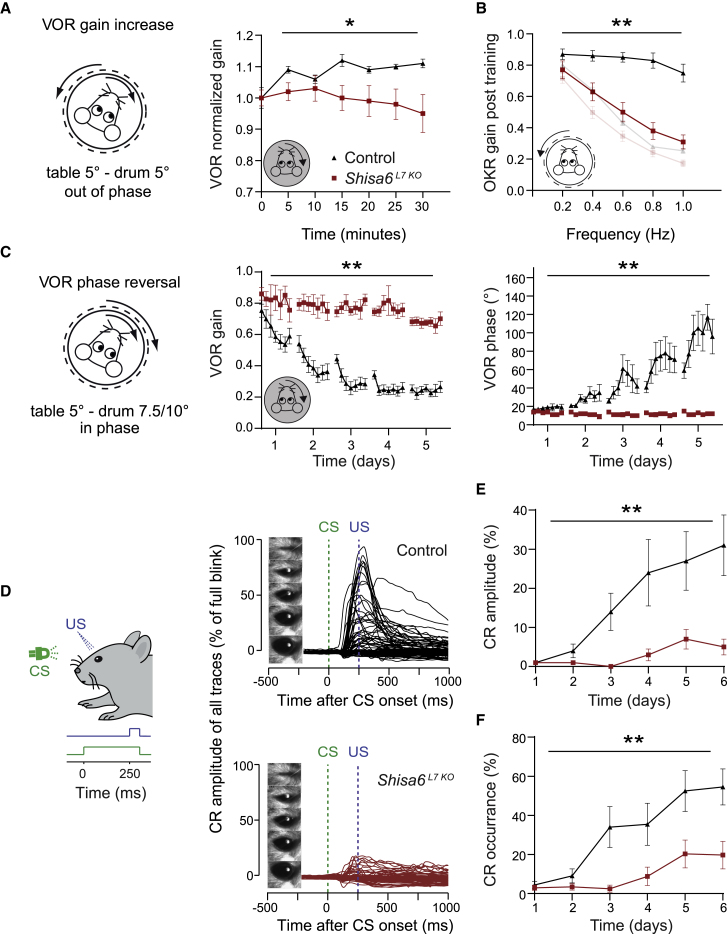
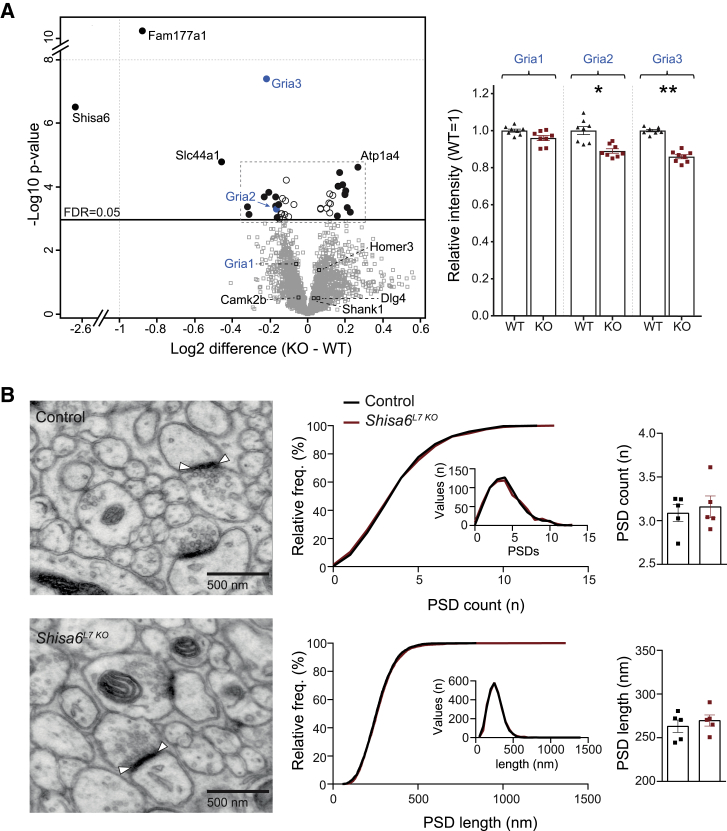
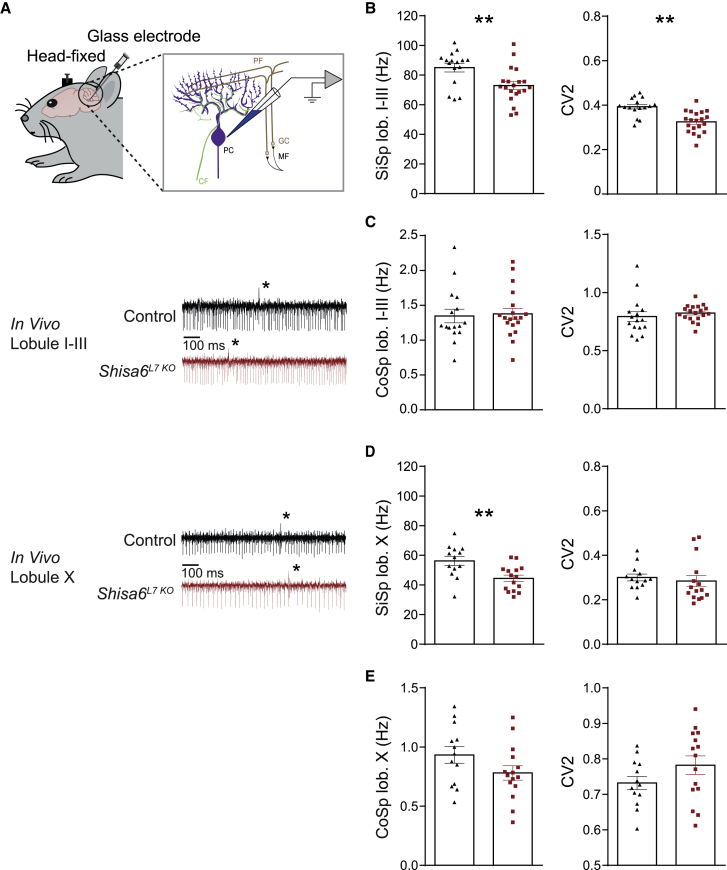
The majority of excitatory postsynaptic currents in the brain are gated through AMPA-type glutamate receptors, the kinetics and trafficking of which can be modulated by auxiliary proteins. It remains to be elucidated whether and how auxiliary proteins can modulate synaptic function to contribute to procedural memory formation. In this study, we report that the AMPA-type glutamate receptor (AMPAR) auxiliary protein SHISA6 (CKAMP52) is expressed in cerebellar Purkinje cells, where it co-localizes with GluA2-containing AMPARs. The absence of SHISA6 in Purkinje cells results in severe impairments in the adaptation of the vestibulo-ocular reflex and eyeblink conditioning. The physiological abnormalities include decreased presence of AMPARs in synaptosomes, impaired excitatory transmission, increased deactivation of AMPA receptors, and reduced induction of long-term potentiation at Purkinje cell synapses. Our data indicate that Purkinje cells require SHISA6-dependent modification of AMPAR function in order to facilitate cerebellar, procedural memory formation.

Keywords: AMPAR kinetics; auxiliary subunit; cerebellum; long-term depression; procedural memory; synapse.


Conflict of interest statement

Declaration of Interests A.B.S. participates in a holding that owns shares of Sylics BV.

Figures

None
Graphical abstract
Figure 1
Figure 1
Mice Lacking SHISA6 in PCs Show Impaired Motor Learning (A) Out-of-phase visual and vestibular stimulation aimed at increasing the VOR gain. VOR gain increase was impaired in Shisa6L7 KO mice. (B) Re-recording of OKR gain (compare to transparent inset of baseline OKR gain data, Figure S1C) following the VOR phase reversal training (see C) shows severe impairments for OKR gain increase in Shisa6L7 KO mice. (C) The ability of mice to reverse the direction of their VOR was tested by training the mice and testing them in the dark. The Shisa6L7 KO mice showed severe impairments in VOR phase reversal adaptation, evidenced by a lack of VOR gain and phase changes over days, whereas control mice showed a reduction in VOR gain and an increase in phase (control, 7 mice; Shisa6L7 KO, 6 mice). (D) Experimental setup for the eyeblink conditioning where an LED light was used as the conditioned stimulus (CS) and a corneal air puff as the unconditioned stimulus (US). Post-training testing was done using only the CS. Right panels: the eyelid responses for all individual trials. (E) The average CR amplitude (threshold: eyelid movement at least 10% of a full blink) for eyelid movements in the 500 ms centered on the US was significantly lower in the Shisa6L7 KO mice compared to the controls (control, 16 mice; Shisa6L7 KO, 16 mice). (F) The percentage of CR responses over sessions. The Shisa6L7 KO mice showed significantly fewer responses than the controls over time, indicative of impaired learning (control, 16 mice; Shisa6L7 KO, 16 mice). Data are represented as mean ± SEM; p < 0.05, ∗∗p < 0.01.
Figure 2
Figure 2
SHISA6 Is Expressed in PCs and Interacts with AMPARs (A) Representative widefield images of control with SHISA6 expression and Shisa6L7 KO mice without SHISA6 expression in PCs. (B) Additional higher-magnification confocal images showing the absence of SHISA6 signal in the ML of the Shisa6L7 KO mice confirming to PC specificity of SHISA6 expression. (C) SIM imaging in control mice shows colocalization of SHISA6 (red) and GluA2 (green) in the ML. (D) Native SHISA6 complexes were immunoprecipitated (IP) from the cerebellum of Shisa6 WT and Shisa6null mice (n-Dodecyl-beta-Maltoside [DDM]-extracted crude synaptic membranes; 3 IPs per genotype) and subjected to MS analysis. Significantly enriched proteins are represented by closed-circle symbols and labeled by gene name (Student’s t test with permutation-based FDR analysis; S0 = 0.5, FDR = 0.01). Additional information, including protein identification and quantification, statistical analysis, data distribution, and the full list of proteins is provided in Table S1.
Figure 3
Figure 3
SHISA6 Absence Alters Synaptic Glutamate Receptor Levels without Affecting PSD Length or Count (A) Comparison of the cerebellar synaptic proteome of WT and Shisa6null mice, as acquired by label free SWATH-MS measurement. Proteins with a significant difference between the mice are represented by circle symbols and labeled by gene name (Student’s t test with permutation-based FDR correction, FDR ≤ 0.05); filled circles indicate proteins with a difference greater than 10%. AMPAR subunits GluA2 (Gria2) and GluA3 (Gria3) are significantly downregulated upon Shisa6 deletion. See Figure S2A for a more detailed overview of the proteins at the center of the volcano plot and Table S2 for a full list of proteins. Right panels: detailed comparison of GluA regulation after setting the mean WT intensity to 1. (B) Examples of EM pictures including PF to PC synapses and their PSDs. Top middle: cumulative frequency plot (histogram inset) of all sampled EM pictures indicating no population difference in PSD count (control, 640 images/5 mice; Shisa6L7 KO, 640 images/5 mice). Top right: average PSD count per animal did not differ between the groups. Bottom middle: cumulative frequency plot (histogram inset) of all sampled PSDs indicating no population difference in PSD length (control, 2629 PSDs/5 mice; Shisa6L7 KO, 2629 PSDs/5 mice). Bottom right: average PSD length per animal did not differ between the groups. Data are represented as individual replicates and by the mean ± SEM; p < 0.05, ∗∗p < 0.01.
Figure 4
Figure 4
PC-Specific Absence of SHISA6 Leads to Reduced PF to PC Excitatory Synaptic Input (A) Sample traces of evoked EPSCs generated by stimulating afferent PFs with increasing stimulation strengths. Evoked EPSCs were consistently of lower amplitude in the Shisa6L7 KO, whereas the PPF ratio was unaffected (control, 21–25 cells/6 animals; Shisa6L7 KO, 25–27 cells/7 animals). (B) Whole-cell patch clamp recording configuration of mEPSCs including raw traces. Top panels: mEPSC rise times and mEPSC decay times are significantly faster in the Shisa6L7 KO in comparison to controls (control, 30 cells/4 animals; ShisaL7 KO, 31 cells/4 animals). Lower panels: mEPSCs in Shisa6L7 KO PCs occur at a significantly lower frequency, but with comparable median amplitude (control, 30 cells/4 animals; KO, 31 cells/4 animals). (C) With the addition of FSK, we increase the GluA3-containing AMPAR conductance. Top panels: both the rise and decay time are significantly different between control and Shisa6L7 KO PCs, replicating the mEPSC trials without FSK. Lower panels: the mEPSC frequency is still largely reduced in the absence of SHISA6, but now a median amplitude difference is also revealed in the presence of FSK (control, 14 cells/3 animals; KO, 13 cells/3 animals). Data are represented as mean ± SEM; p < 0.05, ∗∗p < 0.01. See also Figure S3 for CF and sIPSC data.
Figure 5
Figure 5
SHISA6 Is Important for PF to PC Induced LTP, But Not LTD (A) Recording configuration for PF-PC stimulation and PC voltage clamp in LTP experiments including sample traces. LTP at the PF-PC synapse was induced in control animals after a 5-min induction protocol, whereas LTP was absent in the Shisa6L7 KO (control, 7 cells/4 mice; Shisa6L7 KO, 9 cells/5 mice). No difference in PPF was observed. (B) LTP configuration for induction of LTP with FSK. LTP at the PF-PC synapse was similarly induced in both groups after FSK application (control, 7 cells/4 mice; Shisa6L7 KO, 9 cells/5 mice). Both groups have a significant but small effect in PPF and no PPF difference between the groups. (C) Recording configuration for PF-PC LTD including sample traces. PFs are stimulated in the distal ML, whereas the CF is stimulated close to the soma. LTD was successfully induced in both control and Shisa6L7 KO animals after a 5-min induction of conjunctive CF and PF stimulation (control, 7 cells/5 mice; Shisa6L7 KO, 7 cells/5 mice). No difference in PPF was observed. For both LTP and LTD, the pre-induction data are based on the mean of the last 5 min of the baseline recording. Post-induction data are the mean of minutes 20–25 of the post-induction recording. Data are represented as mean ± SEM; p < 0.05, ∗∗p < 0.01.
Figure 6
Figure 6
Shisa6L7 KO Mice Show Reduced SiSp Frequencies and Increased SiSp Regularity In Vivo (A) Top: recording configuration for in vivo spiking. Bottom traces: raw recordings for anterior (lobules I–III) and posterior (lobule X) in vivo recordings. Note the complex spikes (indicated with asterisk) and subsequent SiSp pause. (B) Left panel: SiSp frequency in lobules I–III was significantly lower in the Shisa6L7 KO. Moreover, a significant difference in the CV2 (right panel) was found between the two groups, indicating that the SS regularity was increased in the Shisa6L7 KO. (C) There was no difference in the anteriorly recorded CoSp frequency or regularity (control, 16 cells/3 mice; Shisa6L7 KO, 20 cells/3 mice). (D) SiSp frequency was lowered in the Shisa6L7 KO mice, whereas spike regularity was unaffected (control, 13 cells/3 mice; Shisa6L7 KO, 15 cells/3 mice). (E) There was no difference in the posteriorly recorded CoSp frequency or regularity. Data are represented as mean ± SEM; p < 0.05, ∗∗p < 0.01.

Similar articles

Cited by

References

    1. Barski J.J., Dethleffsen K., Meyer M. Cre recombinase expression in cerebellar Purkinje cells. Genesis. 2000;28:93–98. - PubMed
    1. Bates D., Mächler M., Bolker B., Walker S. Fitting linear mixed-effects models using lme4. J. Stat. Softw. 2015;67
    1. Bruderer R., Bernhardt O.M., Gandhi T., Miladinović S.M., Cheng L.Y., Messner S., Ehrenberger T., Zanotelli V., Butscheid Y., Escher C. Extending the limits of quantitative proteome profiling with data-independent acquisition and application to acetaminophen-treated three-dimensional liver microtissues. Mol. Cell. Proteomics. 2015;14:1400–1410. - PMC - PubMed
    1. Chen L., Chetkovich D.M., Petralia R.S., Sweeney N.T., Kawasaki Y., Wenthold R.J., Bredt D.S., Nicoll R.A. Stargazin regulates synaptic targeting of AMPA receptors by two distinct mechanisms. Nature. 2000;408:936–943. - PubMed
    1. Chen N., Pandya N.J., Koopmans F., Castelo-Székelv V., van der Schors R.C., Smit A.B., Li K.W. Interaction proteomics reveals brain region-specific AMPA receptor complexes. J. Proteome Res. 2014;13:5695–5706. - PubMed

Publication types