. 2020 Jul 1;130(7):3734-3749.
doi: 10.1172/JCI134791.

Proinflammatory P2Y14 receptor inhibition protects against ischemic acute kidney injury in mice

Affiliations

Proinflammatory P2Y14 receptor inhibition protects against ischemic acute kidney injury in mice

Maria Agustina Battistone et al. J Clin Invest. .

Abstract

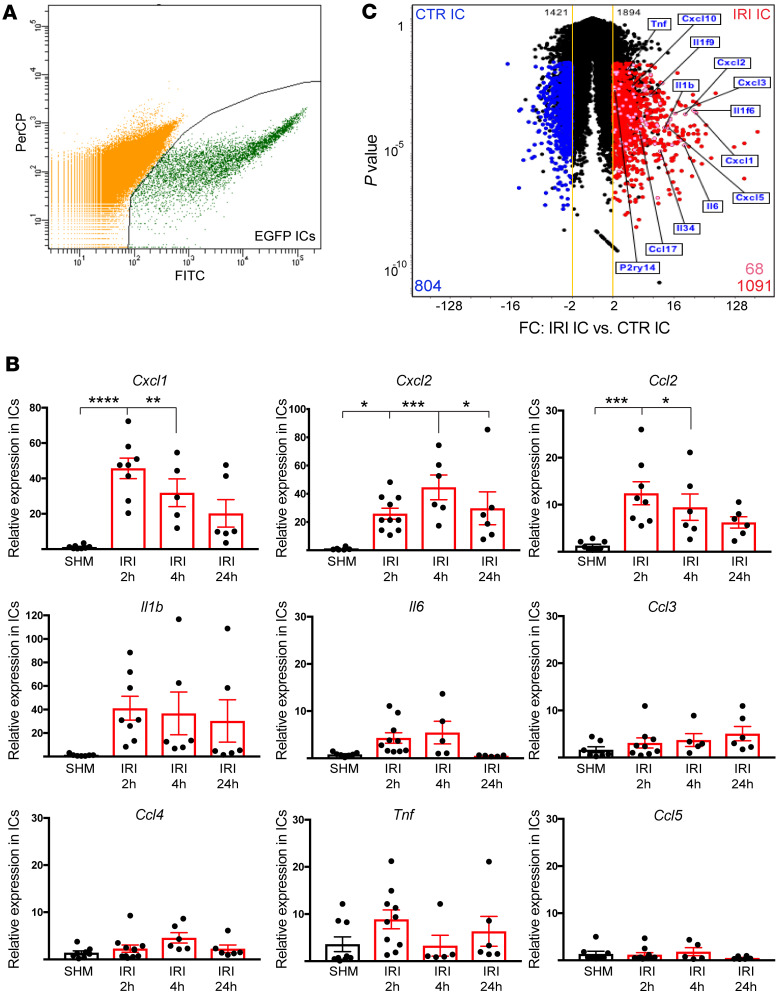
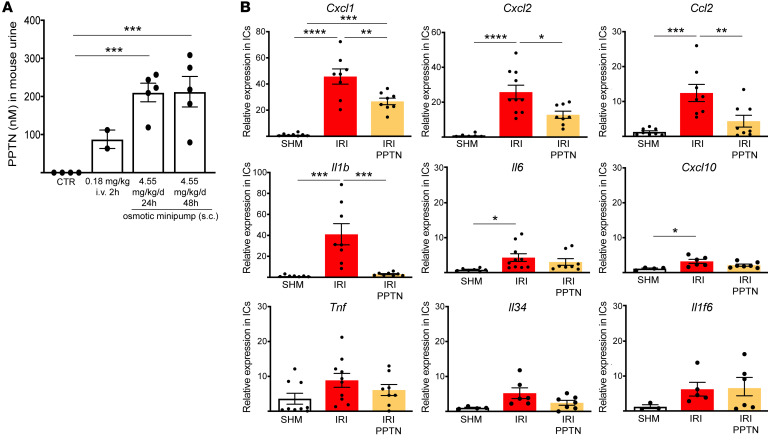
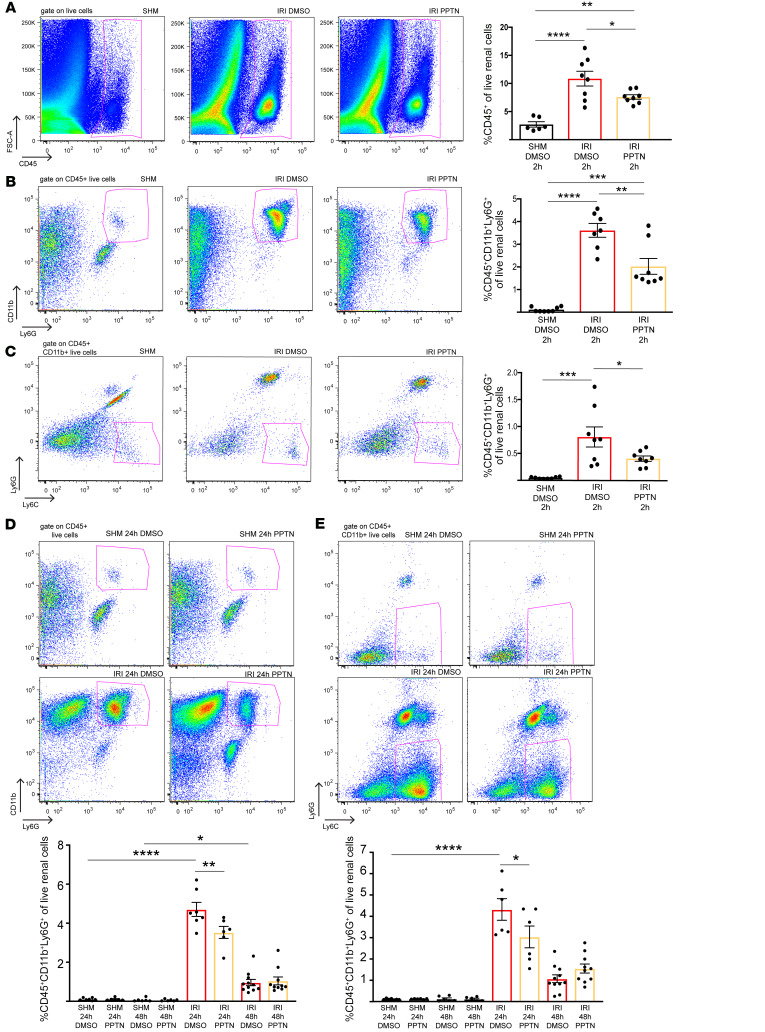
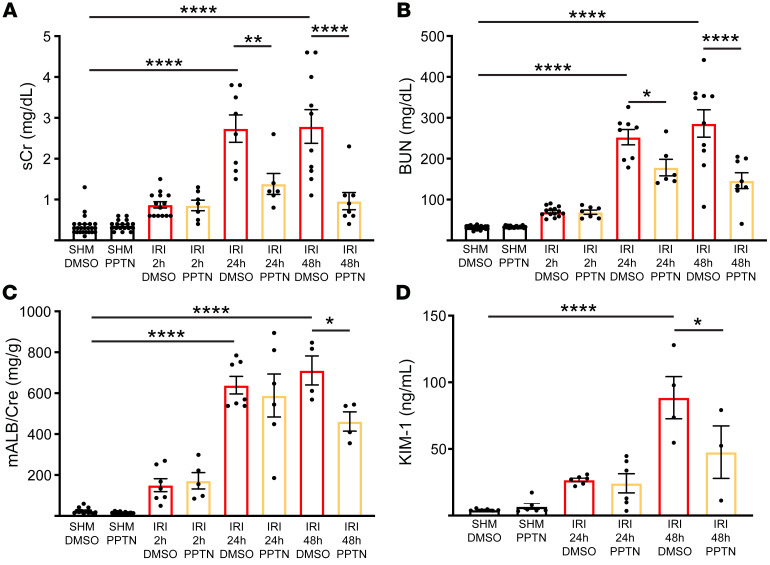
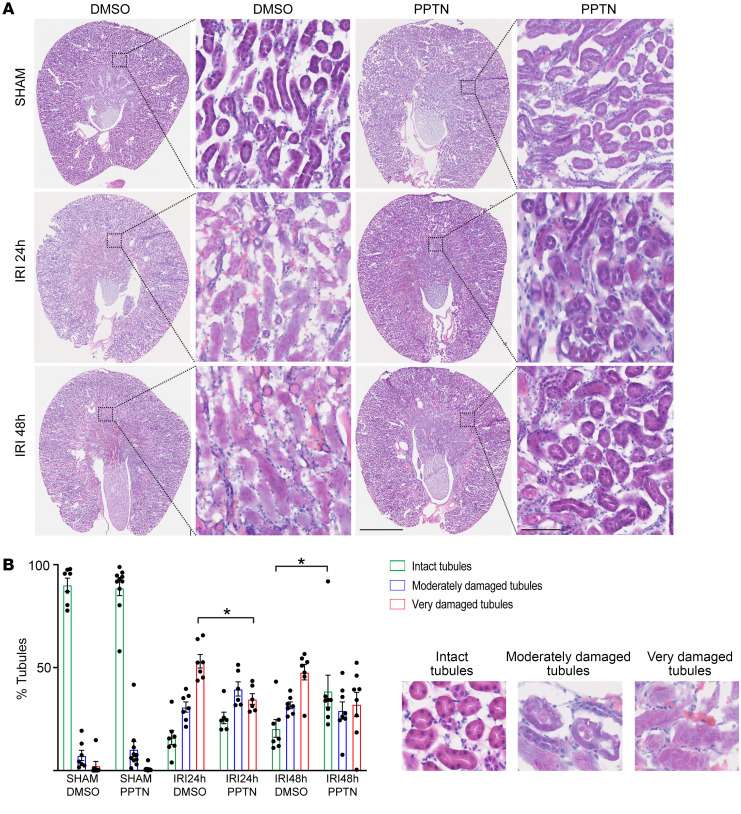
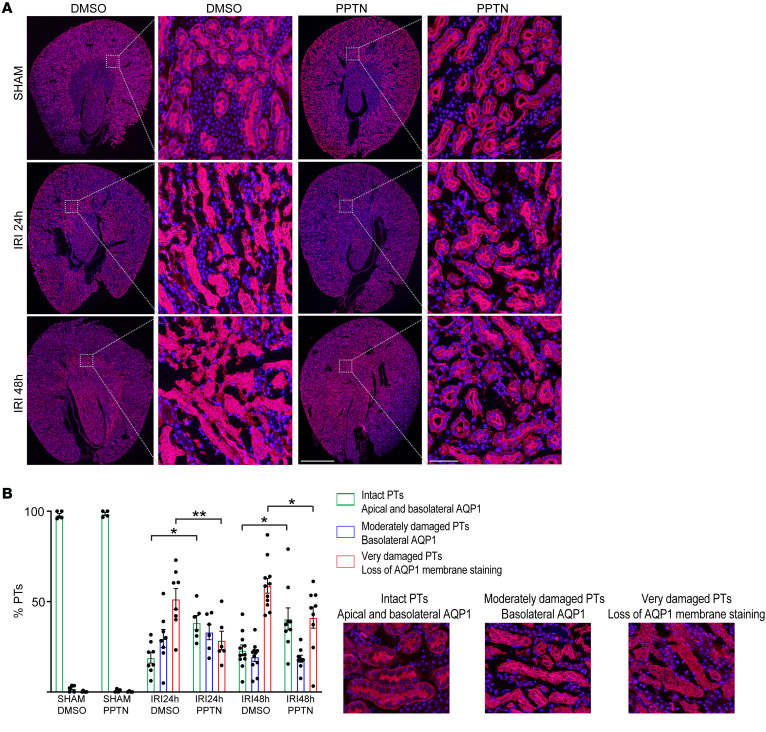
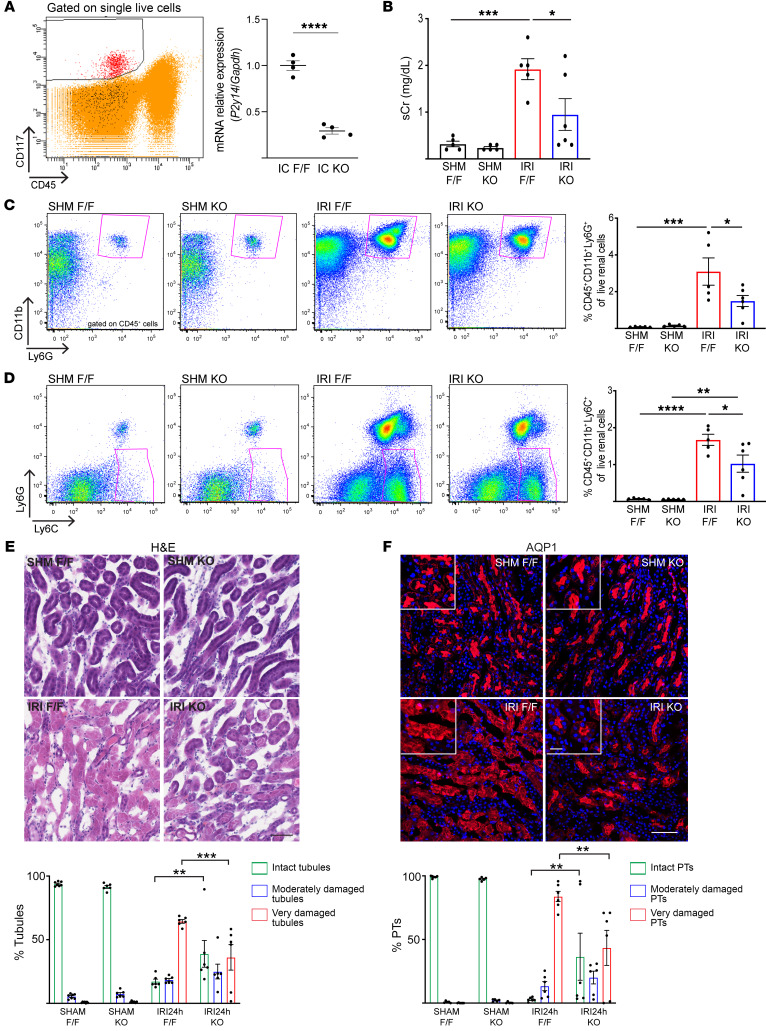
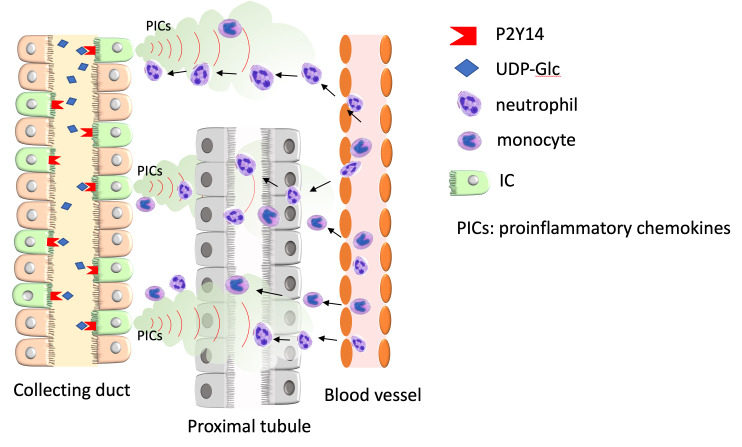
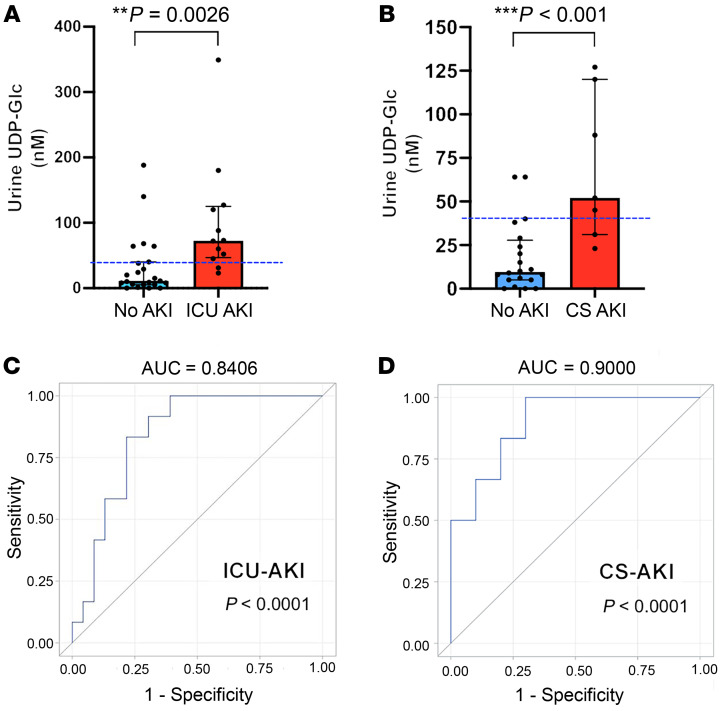
Ischemic acute kidney injury (AKI), a complication that frequently occurs in hospital settings, is often associated with hemodynamic compromise, sepsis, cardiac surgery, or exposure to nephrotoxins. Here, using a murine renal ischemia/reperfusion injury (IRI) model, we show that intercalated cells (ICs) rapidly adopted a proinflammatory phenotype after IRI. Wwe demonstrate that during the early phase of AKI either blockade of the proinflammatory P2Y14 receptor located on the apical membrane of ICs or ablation of the gene encoding the P2Y14 receptor in ICs (a) inhibited IRI-induced increase of chemokine expression in ICs, (b) reduced neutrophil and monocyte renal infiltration, (c) reduced the extent of kidney dysfunction, and (d) attenuated proximal tubule damage. These observations indicate that the P2Y14 receptor participates in the very first inflammatory steps associated with ischemic AKI. In addition, we show that the concentration of the P2Y14 receptor ligand UDP-glucose (UDP-Glc) was higher in urine samples from intensive care unit patients who developed AKI compared with patients without AKI. In particular, we observed a strong correlation between UDP-Glc concentration and the development of AKI in cardiac surgery patients. Our study identifies the UDP-Glc/P2Y14 receptor axis as a potential target for the prevention and/or attenuation of ischemic AKI.

Keywords: Cellular immune response; Inflammation; Monocytes; Nephrology; Neutrophils.


Conflict of interest statement

Conflict of interest: SB is a cofounder of Kantum Pharma (previously “Kantum Diagnostics Inc.”), a company developing a diagnostic and therapeutic combination to prevent and treat acute kidney injury. SB and her spouse own equity in the privately held company. SB and DB are inventors on a patent (US Patent 10,088,489) covering technology that has been licensed to the company through Massachusetts General Hospital (MGH). SB’s and DB’s interests were reviewed and are managed by MGH and Partners HealthCare in accordance with their conflict-of-interest policies.

Figures

Figure 1
Figure 1. Renal bilateral IRI increases urinary concentration of UDP-Glc.
UDP-Glc was measured by LC-MS/MS in the urine of mice subjected to bilateral IRI and sham-operated mice. UDP-Glc concentration was normalized for urine creatinine (uCr). Each dot represents urine samples pooled from 3 mice. SHAM 2 hours, n = 7 samples (21 mice); SHAM 24 hours, n = 16 samples (48 mice); SHAM 48 hours, n = 6 samples (18 mice); IRI 2 hours, n = 13 samples (39 mice); IRI 24 hours, n = 7 samples (21 mice); IRI 48 hours, n = 6 samples (18 mice). Data are means ± SEM, analyzed using 2-way ANOVA followed by Tukey’s post hoc test. A significant elevation of UDP-Glc/uCr value was detected 2 hours after IRI compared with SHAM (IRI 2 hours vs. SHAM 2 hours, *P = 0.013). No difference was observed 24 hours and 48 hours after IRI. IRI 2 hours vs. IRI 24 hours, P = 0.0006; IRI 2 hours vs. IRI 48 hours, P = 0.0014.
Figure 2
Figure 2. Renal bilateral IRI increases expression of proinflammatory transcripts in ICs.
(A) Representative pseudoblot of EGFP+ ICs isolated by FACS from kidney of B1-EGFP mice 2 hours after bilateral IRI. (B) qPCR showing expression of selected proinflammatory chemokines 2, 4, and 24 hours after IRI or sham surgery (SHM). Each dot represents 1 mouse. No difference was detected in SHM-operated mice (2, 4, and 24 hours), and all groups were then combined into a single SHM group. Data are means ± SEM, analyzed using 1-way ANOVA followed by Dunnett’s post hoc test. For Cxcl1, SHM (n = 8), IRI 2 hours (n = 8), IRI 4 hours (n = 5), IRI 24 hours (n = 6); **P = 0.0036, ****P < 0.0001. For Cxcl2, SHM (n = 6), IRI 2 hours (n = 10), IRI 4 hours (n = 6), IRI 24 hours (n = 6); *P = 0.034, ***P = 0.0009. For Ccl2, SHM (n = 8), IRI 2 hours (n = 6), IRI 4 hours (n = 6), IRI 24 hours (n = 6); *P = 0.018, ***P = 0.0006. For Il1b, SHM (n = 7), IRI 2 hours (n = 8), IRI 4 hours/24 hours (n = 6). For Il6, SHM (n = 7), IRI 2 hours (n = 10), IRI 4 hours/24 hours (n = 5). For Ccl3, SHM (n = 7), IRI 2 hours (n = 9), IRI 4 hours (n = 5), IRI 24 hours (n = 6). For Ccl4, SHM (n = 8), IRI 2 hours (n = 11), IRI 4 hours/24 hours (n = 6). For Tnf and Ccl5, SHM (n = 8), IRI 2 hours (n = 10), IRI 4 hours (n = 5), IRI 24 hours (n = 6). (C) Volcano plots (fold change [FC] vs. P value) of gene expression profiles of ICs, isolated by FACS 2 hours after IRI (IRI IC) versus SHAM (CTR IC). Each sample of RNA (n = 3) was obtained from a pool of 2 kidneys from 2 mice per group. Yellow lines show ± 2 FC. Genes upregulated after IRI are shown in red, genes downregulated after IRI in blue. Black dots represent transcripts that were not significantly differentially expressed. Data were analyzed using Student’s t test, 2 tailed.
Figure 3
Figure 3. Inhibition of P2Y14 with PPTN attenuates IC-specific upregulation of proinflammatory chemokines induced by IRI.
(A) Concentration of PPTN, a specific P2Y14 antagonist, in the urine of mice treated with a single i.v. injection corresponding to 0.18 mg/kg (2 hours), or via continuous infusion with ALZET osmotic minipumps implanted s.c. for 24 or 48 hours corresponding to a dose of 4.55 mg/kg/d, versus controls (CTR; treated with vehicle only). PPTN urinary concentration was measured using LC-MS/MS. Data are means ± SEM analyzed using 1-way ANOVA and Dunnett’s test. CTR vs. 4.55 mg/kg/d 24 hours ***P = 0.0007; CTR vs. 4.55 mg/kg/d 48 hours ***P = 0.0006. (B) qPCR analysis of selected chemokines in ICs isolated by FACS 2 hours after IRI versus SHAM. PPTN-treated mice received a dose of 4.55 mg/kg/d through osmotic minipumps, while nontreated mice received vehicle. Data are means ± SEM, analyzed by 1-way ANOVA and Tukey’s test. No difference in chemokine expression was detected between the SHAM-vehicle and SHAM-PPTN groups, which were then combined into a single SHAM group (SHM). Some IRI groups are the same as those shown in Figure 2B (IRI 2 hours). Each dot represents 1 mouse. For Cxcl1, SHM (n = 6), IRI (n = 8), IRI-PPTN (n = 8); **P = 0.0039, ***P = 0.0002, ****P < 0.0001. For Cxcl2, SHM (n = 6), IRI (n = 10), IRI-PPTN (n = 8); *P = 0.013, ****P < 0.0001. For Ccl2, SHM (n = 8), IRI (n = 8), IRI-PPTN (n = 8); **P = 0.0092, ***P = 0.0005. For Il1b, SHM (n = 7) vs. IRI (n = 8) ***P = 0.0006; IRI vs. IRI-PPTN (n = 8) ***P = 0.0006. For Il6, SHM (n = 7), IRI (n = 10), IRI-PPTN (n = 8); *P = 0.042. For Cxcl10, SHM (n = 4), IRI (n = 6), IRI-PPTN (n = 7); *P = 0.015. For Tnf, SHM (n = 9), IRI (n = 10), IRI-PPTN (n = 8). For Il34, SHM (n = 4), IRI (n = 6), IRI-PPTN (n = 7). For Il1f6, SHM (n = 3), IRI (n = 5), IRI-PPTN (n = 6).
Figure 4
Figure 4. IRI induces the renal recruitment of proinflammatory immune cells, and this process is attenuated by PPTN.
(A) Flow cytometry analysis of renal recruitment of live CD45+ immune cells (pink boxes) 2 hours after IRI compared with SHAM. SHM-DMSO (n = 6), IRI-DMSO (n = 8), IRI-PPTN (n = 8); *P = 0.037, **P = 0.004, ****P < 0.0001. (B) Renal recruitment of live neutrophils (CD45+CD11b+Ly6G+) relative to the live renal cell population (pink boxes) 2 hours after IRI compared with SHAM. SHM-DMSO (n = 8), IRI-DMSO (n = 7), IRI-PPTN (n = 8); **P = 0.0013, ***P = 0.0001, ****P < 0.0001. (C) Renal recruitment of live monocytes (CD45+CD11b+Ly6C+Ly6G) relative to the live renal cell population (pink boxes) 2 hours after IRI compared with SHAM (n = 8 mice in each group). *P = 0.048, ***P = 0.0002. (D) Renal recruitment of live neutrophils (CD45+CD11b+Ly6G+) relative to the renal live cell population 24 hours (left, pink boxes) and 48 hours after IRI compared with SHAM. SHM 24 hours DMSO (n = 7), SHM 24 hours PPTN (n = 7), SHM 48 hours DMSO (n = 6), SHM 48 hours PPTN (n = 6), IRI 24 hours DMSO (n = 7), IRI 24 hours PPTN (n = 6), IRI 48 hours DMSO (n = 11), IRI 48 hours PPTN (n = 10); *P = 0.04, **P = 0.0057, ****P < 0.0001. (E) Renal recruitment of live monocytes (CD45+CD11b+Ly6C+Ly6G) relative to the live renal cell population 24 hours (left, pink boxes) and 48 hours after IRI compared with SHAM. SHM 24 hours DMSO (n = 7), SHM 24 hours PPTN (n = 6), SHM 48 hours DMSO (n = 6), SHM 48 hours PPTN (n = 6), IRI 24 hours DMSO (n = 6), IRI 24 hours PPTN (n = 6), IRI 48 hours DMSO (n = 11), IRI 48 hours PPTN (n = 10). *P = 0.039, ****P < 0.0001. In all bar graphs, data are means ± SEM, and each dot represents 1 mouse. (AC) One-way ANOVA and Tukey’s post hoc test. (D and E) Two-way ANOVA and Tukey’s test.
Figure 5
Figure 5. PPTN protects kidney function after IRI.
(A) Serum creatinine (sCr) over time after IRI in vehicle-treated mice (DMSO) versus PPTN. Each dot represents 1 mouse. SHM-DMSO (n = 24), SHM-PPTN (n = 18), IRI 2 hours DMSO (n = 14), IRI 2 hours PPTN (n = 7), IRI 24 hours DMSO (n = 8), IRI 24 hours PPTN (n = 6), IRI 48 hours DMSO (n = 10), IRI 48 hours PPTN (n = 10). **P = 0.0011, ****P < 0.0001. (B) BUN over time after IRI. Each dot represents 1 mouse. SHM-DMSO (n = 24), SHM-PPTN (n = 18), IRI 2 hours DMSO (n = 14), IRI 2 hours PPTN (n = 7), IRI 24 hours DMSO (n = 8), IRI 24 hours PPTN (n = 6), IRI 48 hours DMSO (n = 10), IRI 48 hours PPTN (n = 8). *P = 0.038, ****P < 0.0001. (C) Urine microalbumin/creatinine ratio (mALB/Cre) over time after IRI. Each dot represents urine collection from 3 mice. SHM-DMSO (n = 13, representing 39 mice), SHM-PPTN (n = 9; 27 mice), IRI 2 hours DMSO (n = 7; 21 mice), IRI 2 hours PPTN (n = 5; 15 mice), IRI 24 hours DMSO (n = 7; 21 mice), IRI 24 hours PPTN (n = 6; 18 mice), IRI 48 hours DMSO (n = 4; 12 mice), IRI 48 hours PPTN (n = 4; 12 mice). *P = 0.047, ****P < 0.0001. (D) Urinary concentration of KIM-1 over time after IRI. Each dot represents urine collection from 3 mice. SHM-DMSO (n = 6; 18 mice), SHM-PPTN (n = 6; 18 mice), IRI 24 hours DMSO (n = 6; 18 mice), IRI 48 hours PPTN (n = 3; 9 mice), IRI 48 hours DMSO (n = 4; 12 mice), IRI 48 hours PPTN (n = 3; 9 mice). *P = 0.041, ****P < 0.0001. For all graphs, data are means ± SEM, and 2-way ANOVA followed by Tukey’s test was performed.
Figure 6
Figure 6. PPTN protects kidney structure and renal tubules after IRI.
(A) Kidney sections stained using H&E in SHAM 24 and 48 hours after IRI. Right panels show higher magnification of the regions delineated by the boxes in left panels. Severe alteration of renal tubule morphology is observed 24 and 48 hours after IRI in the DMSO group. Protection of kidney tubules is observed in the PPTN group versus DMSO at both time points after IRI. No effect of PPTN alone was observed in the SHAM group. Scale bar: 1 mm; inset scale bar: 100 μm. (B) Quantification of the percentage of intact tubules (green bars), moderately damaged tubules with detectable cellular structures (blue bars), and very damaged tubules with a complete loss of cell architecture (red bars). SHAM-DMSO (n = 7 mice), SHAM-PPTN (n = 10), IRI 24 hours DMSO (n = 7), IRI 24 hours PPTN (n = 6), IRI 48 hours DMSO (n = 7), IRI 48 hours PPTN (n = 8). IRI 24 hours DMSO vs. IRI 24 hours PPTN, *P = 0.029; IRI 48 hours DMSO vs. IRI 48 hours PPTN, *P = 0.016; by 2-way ANOVA followed by Tukey’s post hoc test. Between 940 and 1700 tubules were analyzed in each group.
Figure 7
Figure 7. PPTN maintains PT polarity after IRI.
(A) Kidney sections labeled for AQP1 showed apical and basolateral localization in PTs from sham-operated mice. Twenty-four hours and 48 hours after IRI, a significant loss of AQP1 polarity was detected. In mice treated with PPTN, several PTs showed intact AQP1 localization at the brush border and basolateral membrane. PPTN alone did not affect AQP1 distribution in sham-operated mice. Scale bar: 1 mm; inset scale bar: 100 μm. (B) Quantification of the number of intact PTs with apical and basolateral AQP1 labeling (green bars), moderately damaged PTs with loss of apical labeling but detectable basolateral labeling (blue bars), and very damaged PTs with a complete loss of AQP1 polarity (red bars). PPTN induced a significant reduction in the number of very damaged PTs (IRI 24 hours DMSO [n = 8] vs. IRI 24 hours PPTN [n = 6] **P = 0.0043, IRI 48 hours DMSO [n = 11] vs. IRI 48 hours PPTN [n = 9] *P = 0.011) together with an increase in the number of intact PTs 24 hours and 48 hours after IRI (IRI 24 hours DMSO vs. IRI 24 hours PPTN *P = 0.026, IRI 48 hours DMSO vs. IRI 48 hours PPTN *P = 0.012, compared with the untreated group; SHAM-DMSO [n = 5], SHM-PPTN [n = 4]). Two-way ANOVA followed by Tukey’s post hoc test was performed. Between 1500 and 3000 PTs were analyzed in each group.
Figure 8
Figure 8. Deletion of P2Y14 in ICs protects kidney function, reduces inflammation, and attenuates damage after IRI.
(A) Left: ICs (CD117+CD45; red dots) were isolated from B1Cre+ P2Y14fl/+ (IC KO) and B1Cre– P2Y14fl/+ (IC F/F; controls) mice. Right: P2ry14 expression by qPCR in IC KO versus IC F/F mice. ****P < 0.0001 by unpaired 2-tailed Student’s t test (n = 4). (B) sCr 24 hours after IRI versus SHAM in F/F and IC KO mice. *P = 0.031, ***P = 0.0008. (C) Recruitment of CD45+CD11b+Ly6G+ live cells 24 hours after IRI in F/F mice versus SHM (***P = 0.0003), and attenuation in IC KO mice (IRI KO vs. IRI F/F; *P = 0.041). (D) Recruitment of CD45+CD11b+Ly6C+Ly6G live cells 24 hours after IRI in F/F versus SHM (****P < 0.0001), and attenuation in IC KO mice (IRI KO vs. IRI F/F; *P = 0.032). **P = 0.0014. (E) H&E staining of kidney of SHM and 24 hours after IRI in F/F and IC KO mice. Bar graph shows reduction of very damaged tubules (red bars; ***P = 0.0002) and increase in intact tubules (green bars; **P = 0.006) 24 hours after IRI in KO versus F/F mice. Scale bar: 50 μm. (F) AQP1 staining of kidney of SHAM and 24 hours after IRI in F/F and IC KO mice. Bar graph shows reduction of very damaged PTs (red bars; **P = 0.0012) and increase in intact PTs (green bars; **P = 0.0093) 24 hours after IRI in IC KO versus F/F. Scale bar: 50 μm; inset: 10 μm. Data are means ± SEM. Each dot represents 1 mouse. (BD) One-way ANOVA followed by Tukey’s test. (E and F) Two-way ANOVA followed by Tukey’s test. (BD) n = 5 for SHM F/F, SHM KO, and IRI KO; n = 6 for IRI F/F. (E) n = 6 for IRI F/F, SHM KO, and IRI KO; n = 7 for SHM F/F. (F) n = 6 mice for SHAM F/F, IRI 24 hours F/F, and IRI 24 hours KO; n = 5 for SHAM KO. Between 1400 and 2500 tubules were analyzed per group (E and F).
Figure 9
Figure 9. Activation of P2Y14 in ICs triggers renal inflammation leading to PT injury.
Renal ischemia induces the release of UDP-Glc from injured cells. UDP-Glc reaches the collecting duct lumen, where it binds P2Y14 located on the apical membrane of ICs. ICs then produce proinflammatory chemokines (PICs), which attract circulating neutrophils and monocytes from the blood vessel into the kidney stroma. Neutrophils and monocytes clog the microvasculature, and extravasated cells attack PT cells, creating additional injury.
Figure 10
Figure 10. Elevated UDP-Glc urinary levels are associated with AKI in ICU and cardiac surgery patients.
(A) Average peak urinary UDP-Glc concentration in ICU patients with AKI (ICU-AKI, n = 12) and without AKI (No AKI, n = 23). Significantly higher UDP-Glc concentration was detected in patients who developed AKI versus patients who did not. (B) Average peak urinary UDP-Glc concentration in cardiac surgery patients with AKI (CS-AKI, n = 6) and without AKI (No AKI, n = 20). Significantly higher UDP-Glc concentration was detected in patients who developed AKI versus patients who did not. (C) Receiver operating characteristic (ROC) curve for the diagnosis of AKI (stages 1, 2, and 3 combined) in ICU patients. Peak UDP-Glc levels versus the higher AKI stage for each patient were compared. (D) ROC curve for the diagnosis of AKI (stages 1, 2, and 3 combined) in cardiac surgery patients. Data are expressed as median ± IQR for continuous variables from a cohort of 35 patients. (A and B) Statistical analysis was performed using Wilcoxon’s rank-sum test, χ2 test, and Fisher exact test. (C and D) A χ2 test was performed to compare the area under the ROC curve (AUC) with that of an intercept-only model, which has an AUC of 0.5. Two-sided P values less than 0.05 were considered statistically significant.

Comment in

Similar articles

Cited by

References

    1. Brown JR, Rezaee ME, Marshall EJ, Matheny ME. Hospital mortality in the United States following acute kidney injury. Biomed Res Int. 2016;2016:4278579. - PMC - PubMed
    1. Kashani K, et al. Quality improvement goals for acute kidney injury. Clin J Am Soc Nephrol. 2019;14(6):941–953. doi: 10.2215/CJN.01250119. - DOI - PMC - PubMed
    1. Hoste EA, et al. Epidemiology of acute kidney injury in critically ill patients: the multinational AKI-EPI study. Intensive Care Med. 2015;41(8):1411–1423. doi: 10.1007/s00134-015-3934-7. - DOI - PubMed
    1. Zuk A, Bonventre JV. Recent advances in acute kidney injury and its consequences and impact on chronic kidney disease. Curr Opin Nephrol Hypertens. 2019;28(4):397–405. doi: 10.1097/MNH.0000000000000504. - DOI - PMC - PubMed
    1. Lameire NH, et al. Acute kidney injury: an increasing global concern. Lancet. 2013;382(9887):170–179. doi: 10.1016/S0140-6736(13)60647-9. - DOI - PubMed

Publication types

MeSH terms