Case Reports
. 2020 Apr;26(4):453-455.
doi: 10.1038/s41591-020-0819-2.

Breadth of concomitant immune responses prior to patient recovery: a case report of non-severe COVID-19

Affiliations
Case Reports

Breadth of concomitant immune responses prior to patient recovery: a case report of non-severe COVID-19

Irani Thevarajan et al. Nat Med. 2020 Apr.
No abstract available


Conflict of interest statement

S.R.L.’s institution received funding for investigator-initiated grants from Gilead Sciences, Merck, Viiv Healthcare and Leidos; and honoraria for advisory boards and educational activities (Gilead Sciences, Merck, Viiv Healthcare and Abbvie).

Figures

Fig. 1
Fig. 1. Emergence of immune responses during non-severe symptomatic COVID-19.
a, Timeline of COVID-19, showing detection of SARS-CoV-2 in sputum, nasopharyngeal aspirates and feces but not urine, rectal swab or whole blood. SARS-CoV-2 was quantified by rRT-PCR; cycle threshold (Ct) is shown. A higher Ct value means lower viral load. Dashed horizontal line indicates limit of detection (LOD) threshold (Ct = 45). Open circles, undetectable SARS-CoV-2. b, Anteroposterior chest radiographs on days 5 and 10 following symptom onset, showing radiological improvement from hospital admission to discharge. c, Immunofluorescence antibody staining, repeated twice in duplicate, for detection of IgG and IgM bound to SARS-CoV-2-infected Vero cells, assessed with plasma (diluted 1:20) obtained at days 7–9 and 20 following symptom onset. df, Frequency (left set of plots) of CD27hiCD38hi ASCs (gated on CD3CD19+ lymphocytes) and activated ICOS+PD-1+ TFH cells (gated on CD4+CXCR5+ lymphocytes) (d), activated CD38+HLA-DR+ CD8+ or CD4+ T cells (e), and CD14+CD16+ monocytes and activated HLA-DR+ natural killer (NK) cells (gated on CD3CD14CD56+ cells) (f), detected by flow cytometry of blood collected at days 7–9 and 20 following symptom onset in the patient and in healthy donors (n = 5; median with interquartile range); gating examples at right. Bottom right histograms and line graphs, staining of granzyme A (GZMA (A)), granzyme B (GZMB (B)), granzyme K (GZMK (K)), granzyme M (GZMM (M)) and perforin (Prf) in parent CD8+ and CD4+ T cells and activated CD38+HLA-DR+ CD8+ and CD4+ T cells. Gating and experimental details are in Extended Data Fig. 3. Source data
Extended Data Fig. 1
Extended Data Fig. 1. Detection of IgG and IgM antibodies in SARS-CoV-2-infected Vero cells.
Immunofluorescence antibody staining for the detection of IgG and IgM bound to SARS-CoV-2-infected vero cells using plasma (diluted 1:20) collected at d7-9 and d20 following onset of symptoms. Immunofluorescence antibody tests for the detection of IgG and IgM were performed using SARS-CoV-2-infected vero cells washed with PBS and methanol/acetone fixed onto glass slides. SARS-CoV-2 was isolated from another COVID patient, and infectivity at cell harvest was ~80%. 10μL of a 1/20 dilution of patient plasma in PBS from days 7, 8, 9 and 20 were incubated on separate wells for 30 mins at 37°C, then washed in PBS and further incubated with 10μL of FITC-conjugated goat anti-human IgG and IgM (Euroimmun, Lűbeck, Germany) before viewing on a EUROStar III Plus fluorescent microscope (Euroimmun). Prior to detection of IgM antibodies, samples were pre-treated with RF-SorboTech (Alere, Rűsselsheim, Germany) to remove IgG antibodies and rheumatoid factors, which may cause false-negative and false-positive IgM results, respectively.
Extended Data Fig. 2
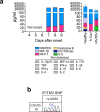
Extended Data Fig. 2. Pro-inflammatory cytokines and chemokines and IFITM3-rs12252 in a patient with COVID-19.
(a) Plasma levels of pro-inflammatory cytokines/chemokines in COVID-19 patient at d7-9, healthy individuals (n=5, mean±SEM), patient with HCoV-229e and influenza-infected patients (n=5). Patient’s plasma was diluted 1:4 before measuring cytokine levels (IL-2, IL-4, IL-6, IL-8, IL-10, IL-12p70, IL-17A, IL-1β, IFN-α, MIP-1α, MIP-1β, MCP-1, CD178/FasL, granzyme B, RANTES, TNF, IFN-γ) using the Human CBA Kit (BD Biosciences, San Jose, California, USA). For RANTES, sera/plasma was also diluted to 1:50. Healthy donors D6-D10 were of a mean age of 32 (range 22-55 years; 40% females). (b) ‘risk’ IFITM3-rs12252 genotyping for the COVID-19 patient. PCR was performed on genomic DNA extracted from patient’s granulocytes (using QIAamp DNA Mini Kit, QIAGEN) to amplify the exon 1 rs12252 region using forward (5′-GGAAACTGTTGAGAAACCGAA-3′) and reverse (5′-CATACGCACCTTCACGGAGT-3′) primers. Source data
Extended Data Fig. 3
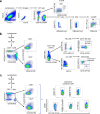
Extended Data Fig. 3. Flow cytometry gating strategy for immune cell subsets.
Gating panels are shown for (a) CD27hiCD38hi ASCs and activated ICOS+PD1+ Tfh cells; (b) activated CD38+HLA-DR+ CD8+ and CD4+ T-cells, activated HLA-DR+ NK cells and CD14+CD16+ monocytes; and (c) granzymes (GZM) A/B/K/M and perforin expression on CD8+/CD4+ T-cells and activated CD38+HLA-DR+ CD8+/CD4+ T-cells. Fresh whole blood (200μl per stain) was used to measure CD4+CXCR5+ICOS+PD1+ follicular T cells (Tfh) and CD3-CD19+CD27hiCD38hi antibody-secreting B cell (ASC; plasmablast) populations as described3 as well as activated HLA-DR+CD38+CD8+ and HLA-DR+CD38+CD4+ T cells, inflammatory CD14+CD16+ and conventional CD14+ monocytes, activated HLA-DR+CD3-CD56+ NK cells. After the whole blood was stained for 20 mins at room temperature (RT) in the dark, samples were lysed with BD FACS Lysing solution, washed and fixed with 1% PFA. Granzymes/perforin staining (patient d20) was performed using the eBioscience Foxp3/Transcription Factor Staining Buffer Set after the lysis step. All the samples were acquired on a LSRII Fortessa (BD). Flow cytometry data were analyzed using FlowJo v10 software. Healthy donors D1-D5 were of a mean age of 35 (range 24-42 years, 40% females).

Similar articles

Cited by

References

    1. McElroy AK, et al. Proc. Natl Acad. Sci. USA. 2015;112:4719–4724. doi: 10.1073/pnas.1502619112. - DOI - PMC - PubMed
    1. Ellebedy AH, et al. Nat. Immunol. 2016;17:1226–1234. doi: 10.1038/ni.3533. - DOI - PMC - PubMed
    1. Koutsakos M, et al. Sci. Transl. Med. 2018;10:eaan8405. doi: 10.1126/scitranslmed.aan8405. - DOI - PubMed
    1. Wang Z, et al. Nat. Commun. 2018;9:824. doi: 10.1038/s41467-018-03243-7. - DOI - PMC - PubMed
    1. Xu Z, et al. Lancet Respir. Med. 2020 doi: 10.1016/S2213-2600(20)30076-X. - DOI - PubMed

MeSH terms