

Sustained mitochondrial biogenesis is essential to maintain caloric restriction-induced beige adipocytes
- PMID: 32275973
- PMCID: PMC7284285
- DOI: 10.1016/j.metabol.2020.154225
Sustained mitochondrial biogenesis is essential to maintain caloric restriction-induced beige adipocytes
Abstract
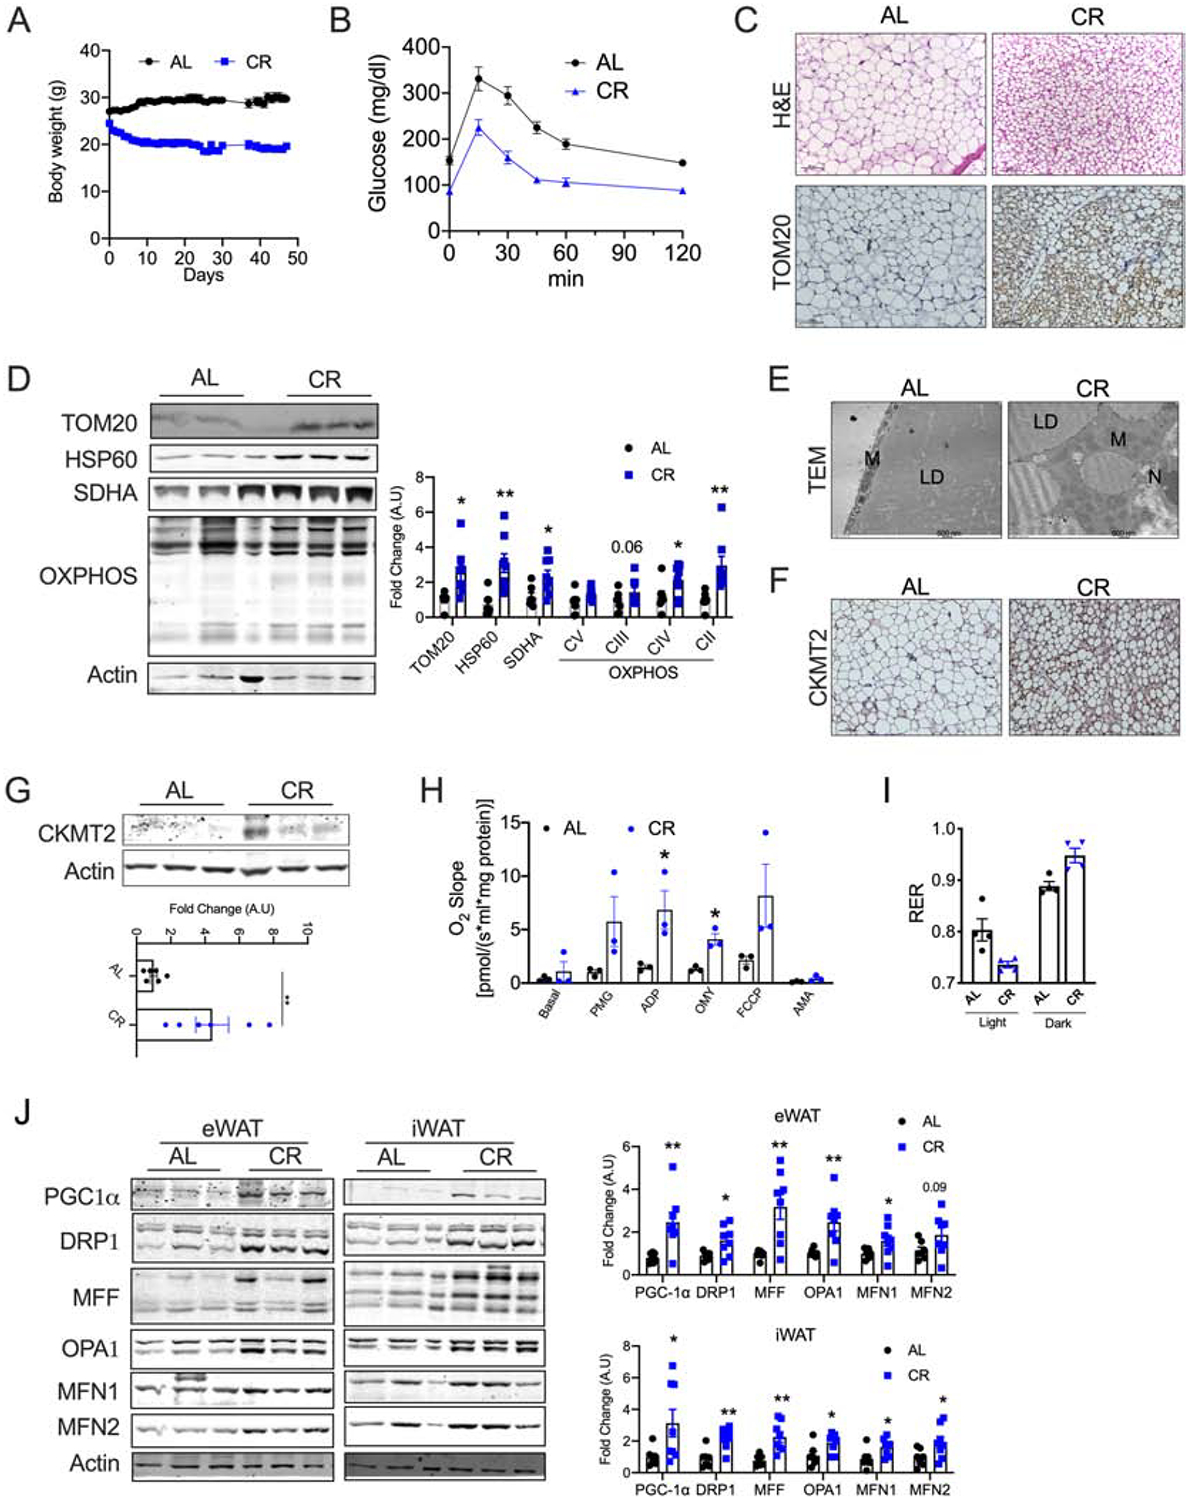
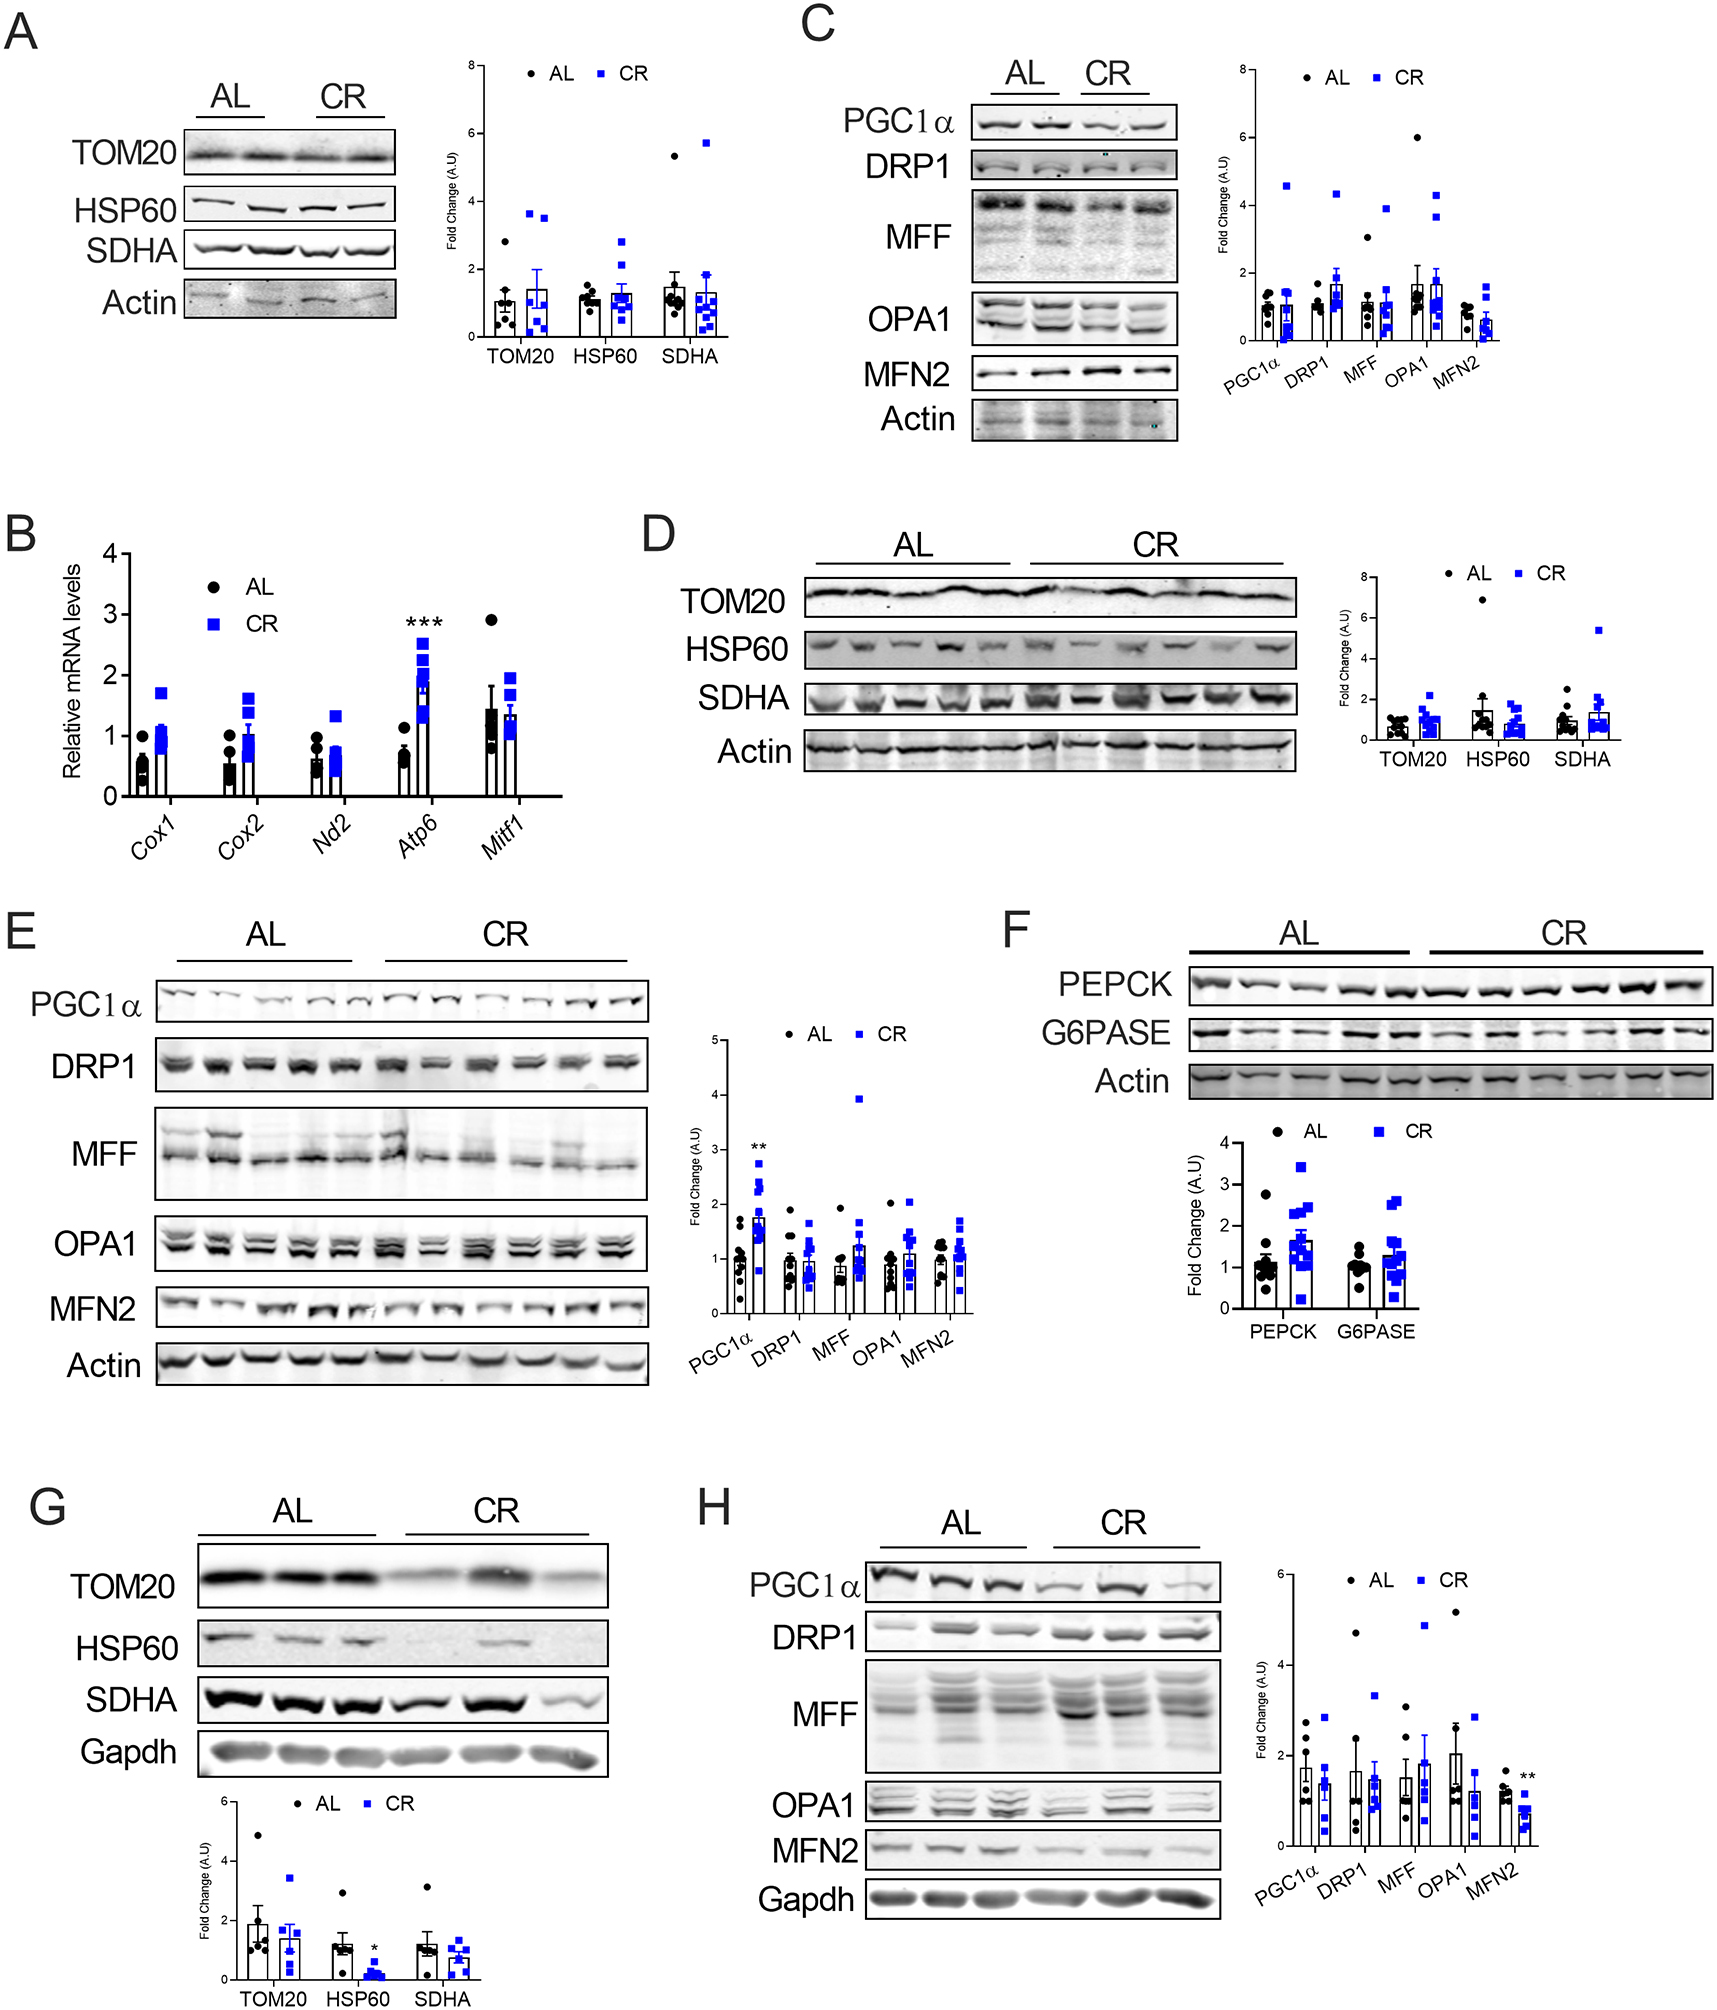
Background: Caloric restriction (CR) delays the onset of metabolic and age-related disorders. Recent studies have demonstrated that formation of beige adipocytes induced by CR is strongly associated with extracellular remodeling in adipose tissue, decrease in adipose tissue inflammation, and improved systemic metabolic homeostasis. However, beige adipocytes rapidly transition to white upon CR withdrawal through unclear mechanisms.
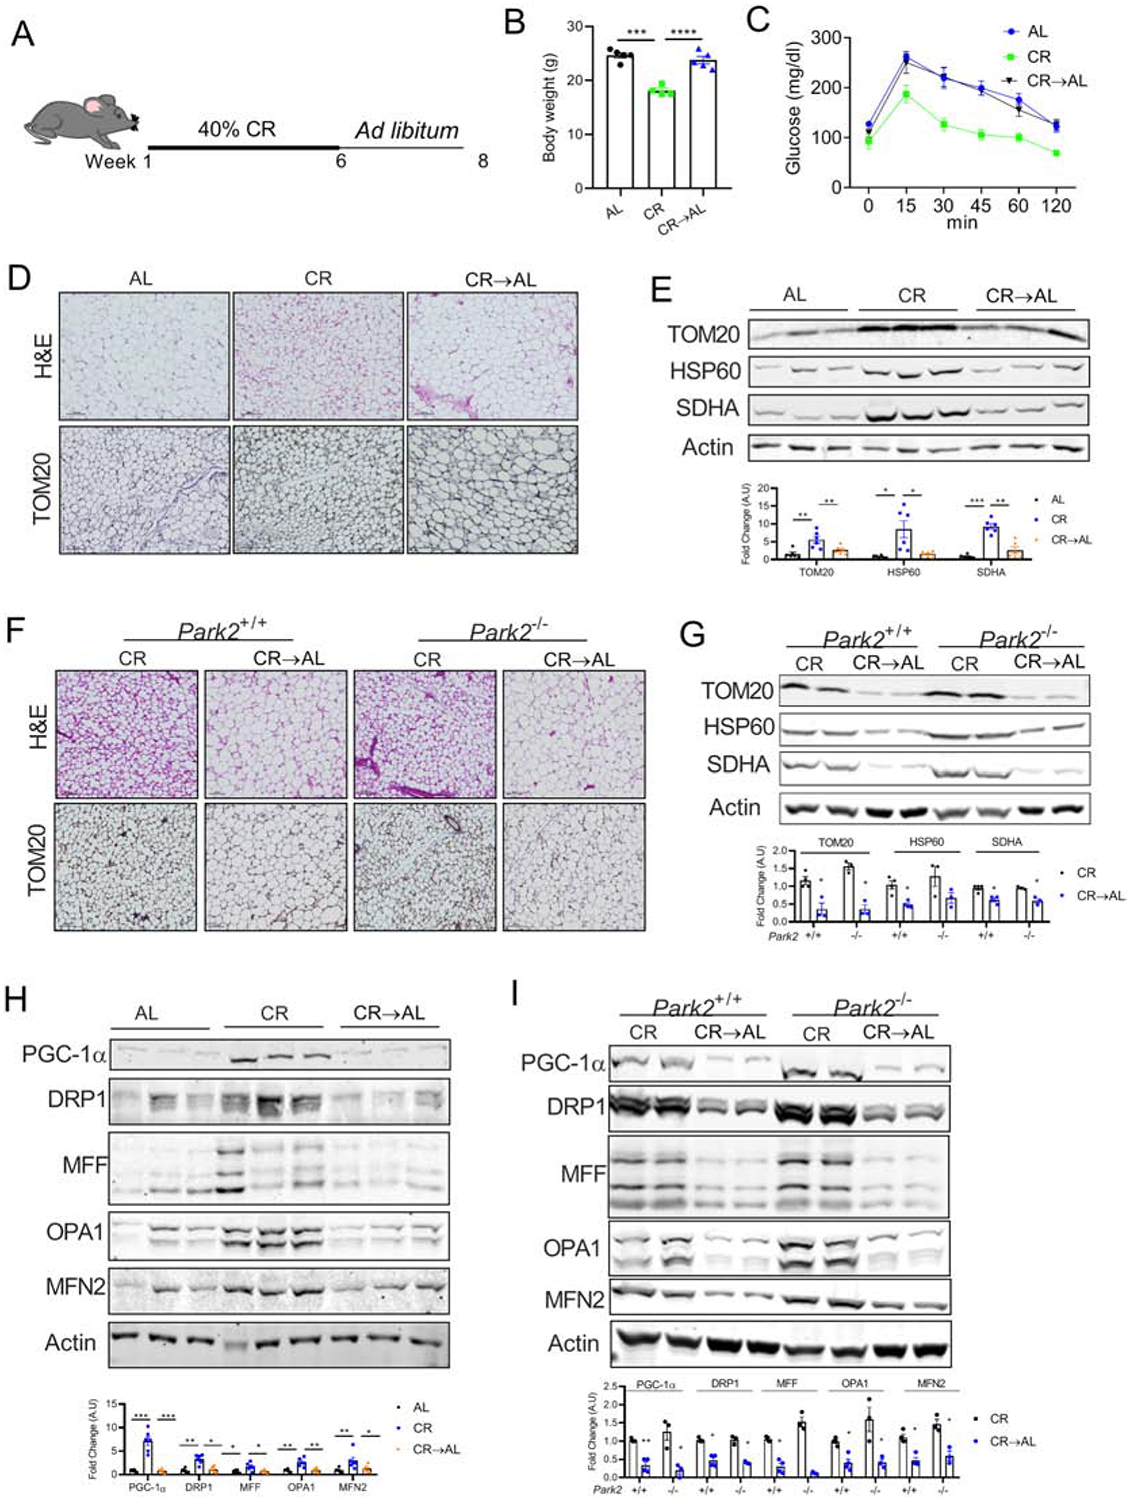
Materials and methods: Six-week old C57BL6 mice were fed with 40% CR chow diet for 6 weeks. Subsequently, one group of mice was switched back to ad libitum chow diet, which was continued for additional 2 weeks. Adipose tissues were assessed histologically and biochemically for beige adipocytes.
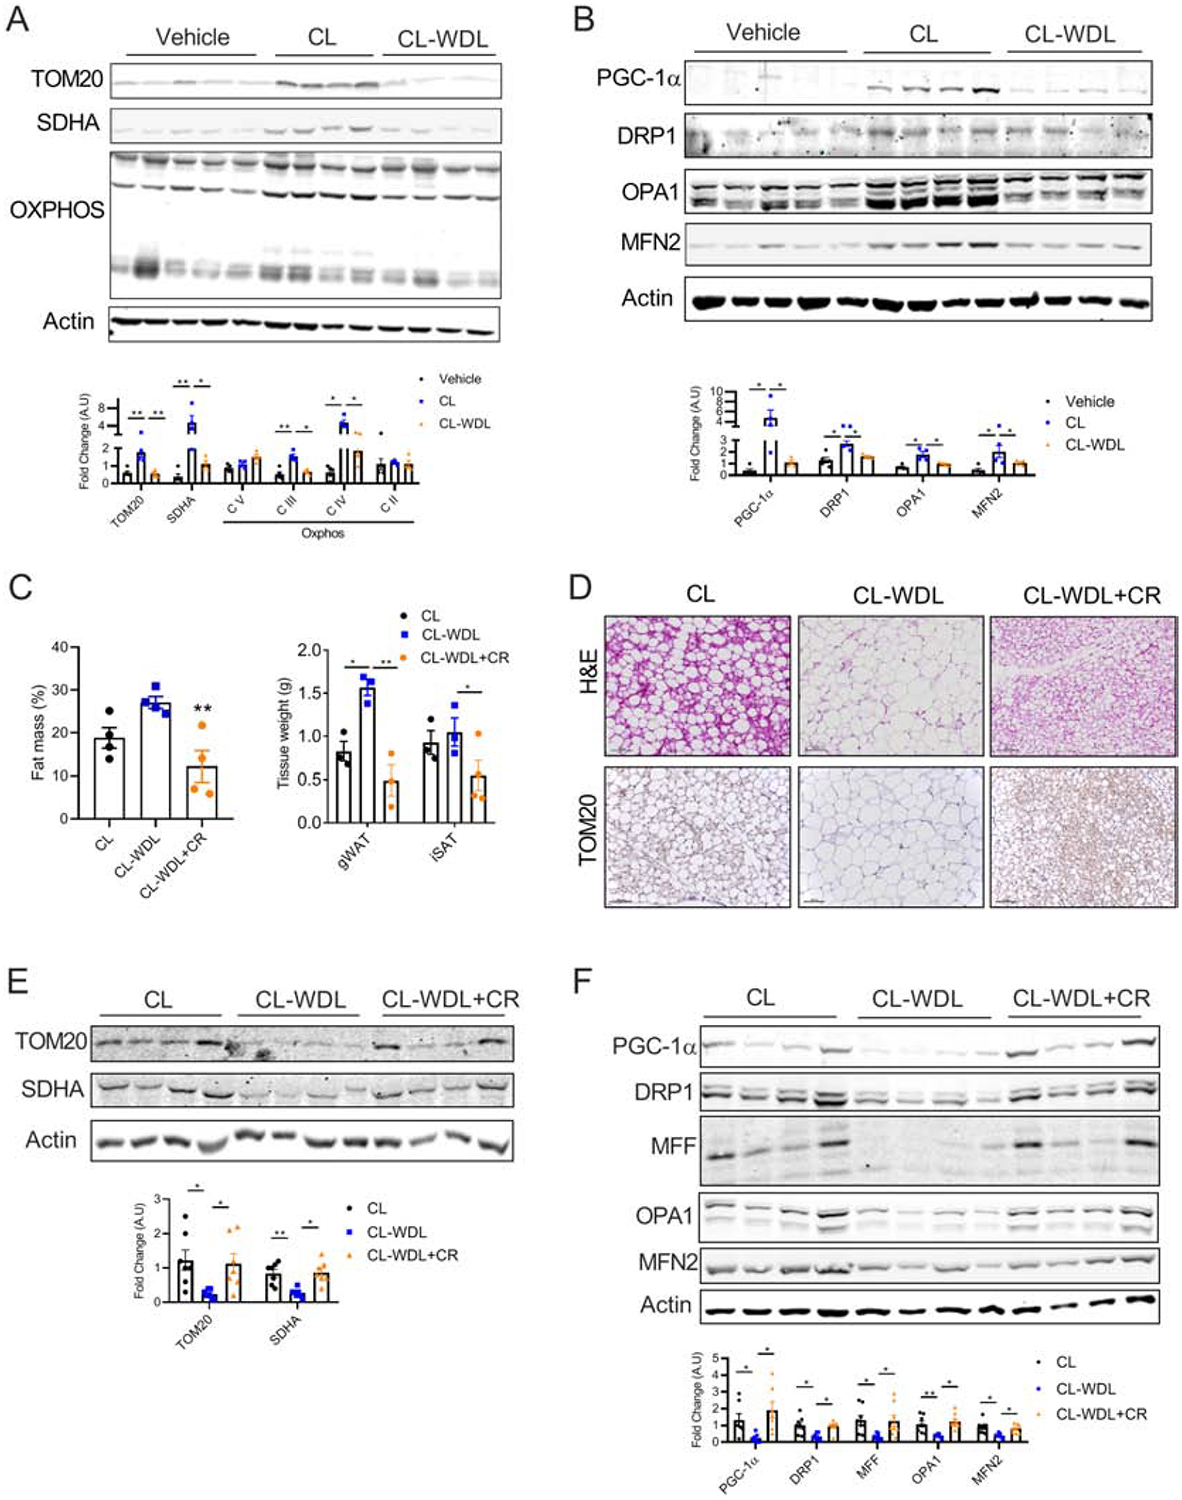
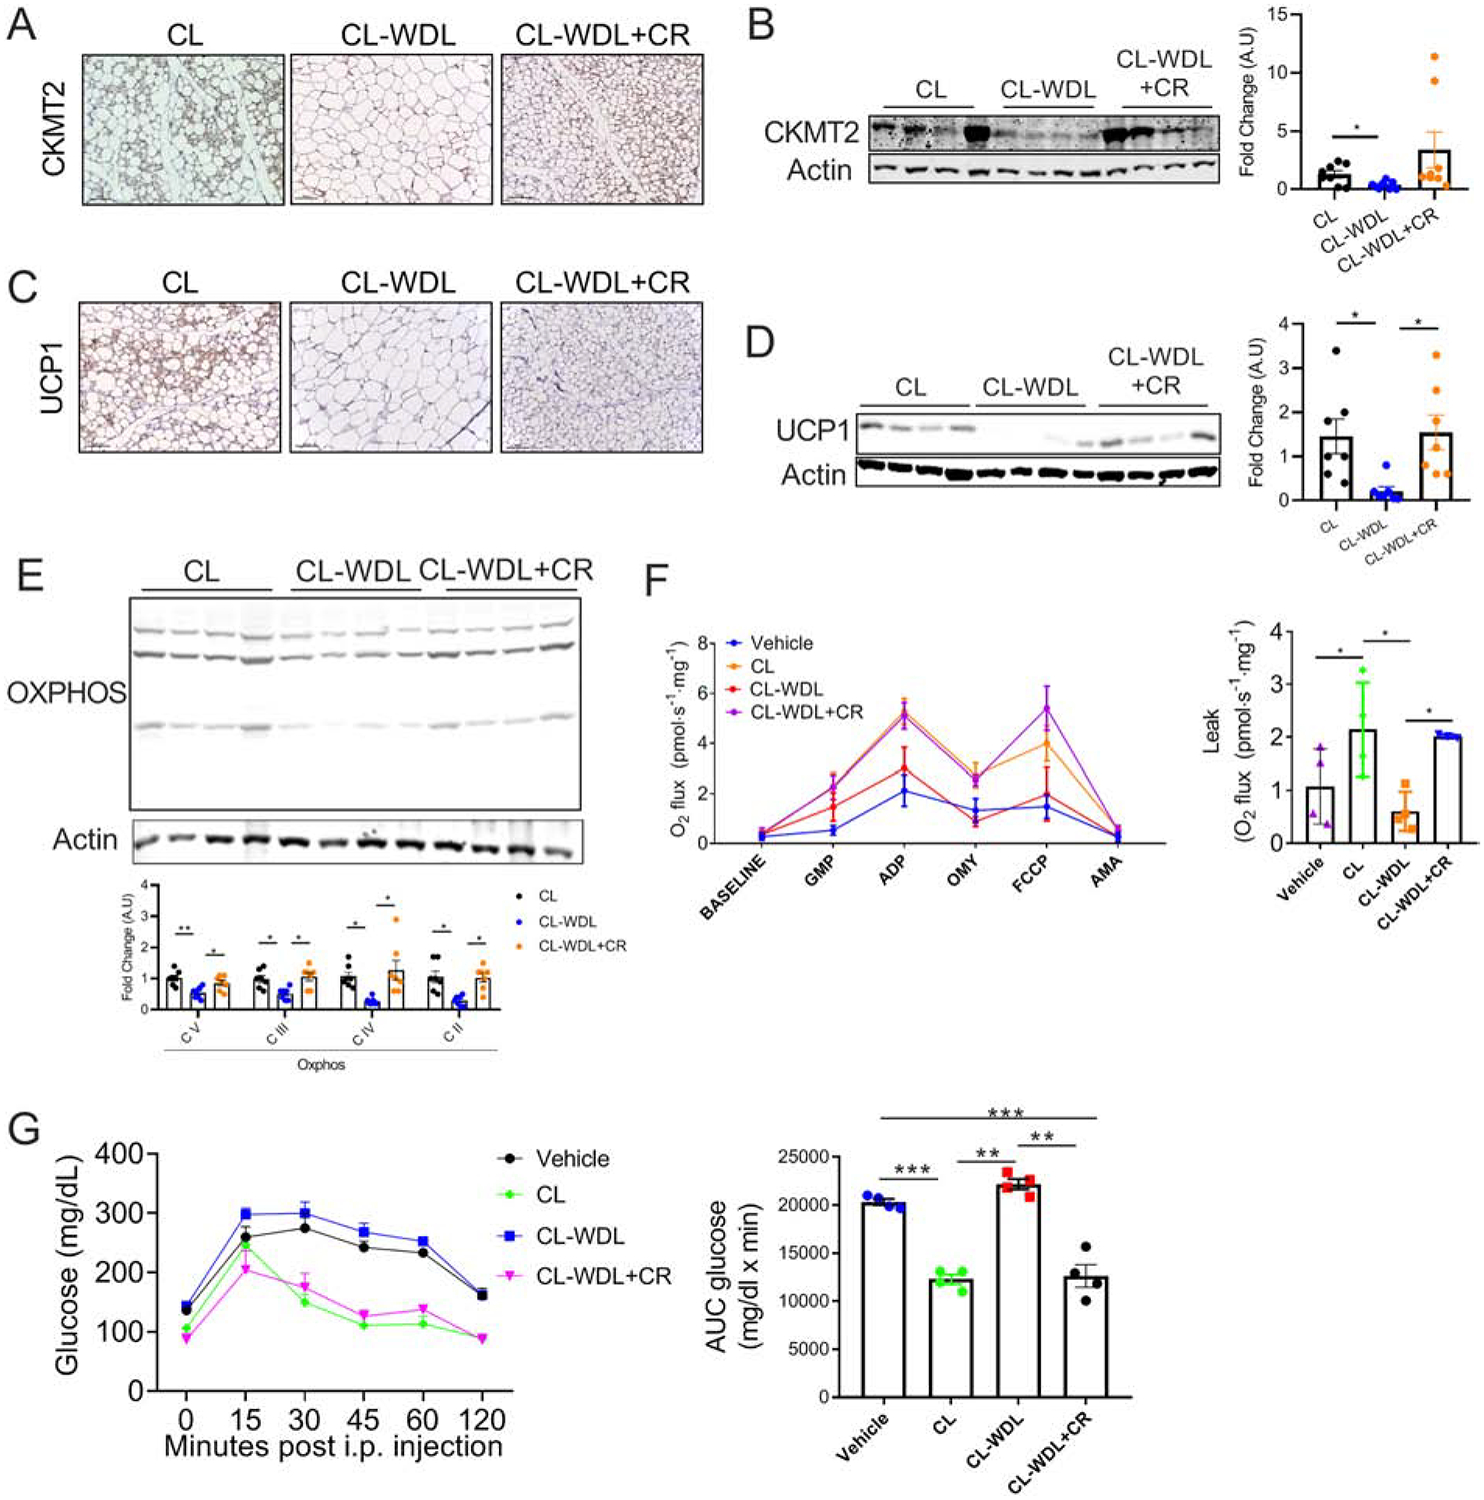
Results: Beige adipocytes induced by CR rapidly transition to white adipocytes when CR is withdrawn independent of parkin-mediated mitophagy. We demonstrate that the involution of mitochondria during CR withdrawal is strongly linked with a decrease in mitochondrial biogenesis. We further demonstrate that beige-to-white fat transition upon β3-AR agonist-withdrawal could be attenuated by CR, partly via maintenance of mitochondrial biogenesis.
Conclusion: In the model of CR, our study highlights the dominant role of mitochondrial biogenesis in the maintenance of beige adipocytes. We propose that loss of beige adipocytes upon β3-AR agonist withdrawal could be attenuated by CR.
Keywords: Beige adipocytes; Caloric restriction; Fission; Fusion; Mitochondrial biogenesis; Mitochondrial dynamics; Mitophagy.
Copyright © 2020 Elsevier Inc. All rights reserved.
Conflict of interest statement
Declaration of competing interest The authors declare no conflict of interests.
Figures
Similar articles
-
Liensinine Inhibits Beige Adipocytes Recovering to white Adipocytes through Blocking Mitophagy Flux In Vitro and In Vivo.Nutrients. 2019 Jul 18;11(7):1640. doi: 10.3390/nu11071640. Nutrients. 2019. PMID: 31323747 Free PMC article.
-
Maintaining mitochondria in beige adipose tissue.Adipocyte. 2019 Dec;8(1):77-82. doi: 10.1080/21623945.2019.1574194. Epub 2019 Feb 20. Adipocyte. 2019. PMID: 30686106 Free PMC article. Review.
-
Calorie restriction prevents diet-induced insulin resistance independently of PGC-1-driven mitochondrial biogenesis in white adipose tissue.FASEB J. 2019 Feb;33(2):2343-2358. doi: 10.1096/fj.201800310R. Epub 2018 Oct 2. FASEB J. 2019. PMID: 30277821
-
Beige Adipocyte Maintenance Is Regulated by Autophagy-Induced Mitochondrial Clearance.Cell Metab. 2016 Sep 13;24(3):402-419. doi: 10.1016/j.cmet.2016.08.002. Epub 2016 Aug 25. Cell Metab. 2016. PMID: 27568548 Free PMC article.
-
From white to beige adipocytes: therapeutic potential of dietary molecules against obesity and their molecular mechanisms.Food Funct. 2019 Mar 20;10(3):1263-1279. doi: 10.1039/c8fo02154f. Food Funct. 2019. PMID: 30735224 Review.
Cited by
-
Emerging Role of Hepatic Ketogenesis in Fatty Liver Disease.Front Physiol. 2022 Jul 4;13:946474. doi: 10.3389/fphys.2022.946474. eCollection 2022. Front Physiol. 2022. PMID: 35860662 Free PMC article. Review.
-
Mitochondrial regulation and white adipose tissue homeostasis.Trends Cell Biol. 2022 Apr;32(4):351-364. doi: 10.1016/j.tcb.2021.10.008. Epub 2021 Nov 19. Trends Cell Biol. 2022. PMID: 34810062 Free PMC article. Review.
-
Epigenetically active chromatin in neonatal iWAT reveals GABPα as a potential regulator of beige adipogenesis.Front Endocrinol (Lausanne). 2024 May 3;15:1385811. doi: 10.3389/fendo.2024.1385811. eCollection 2024. Front Endocrinol (Lausanne). 2024. PMID: 38765953 Free PMC article.
-
The Chinese herbal medicine Dai-Zong-Fang promotes browning of white adipocytes in vivo and in vitro by activating PKA pathway to ameliorate obesity.Front Pharmacol. 2023 May 10;14:1176443. doi: 10.3389/fphar.2023.1176443. eCollection 2023. Front Pharmacol. 2023. PMID: 37251344 Free PMC article.
-
An indispensable role for dynamin-related protein 1 in beige and brown adipogenesis.J Cell Sci. 2020 Sep 15;133(18):jcs247593. doi: 10.1242/jcs.247593. J Cell Sci. 2020. PMID: 32843579 Free PMC article.
References
Publication types
MeSH terms
Substances
Grants and funding
LinkOut - more resources
Full Text Sources
Molecular Biology Databases
Research Materials
