. 2020 May 15;204(10):2722-2733.
doi: 10.4049/jimmunol.1900734. Epub 2020 Mar 30.

Cytomegalovirus Coinfection Is Associated with Increased Vascular-Homing CD57+ CD4 T Cells in HIV Infection

Affiliations

Cytomegalovirus Coinfection Is Associated with Increased Vascular-Homing CD57+ CD4 T Cells in HIV Infection

Bonnie Chen et al. J Immunol. .

Abstract

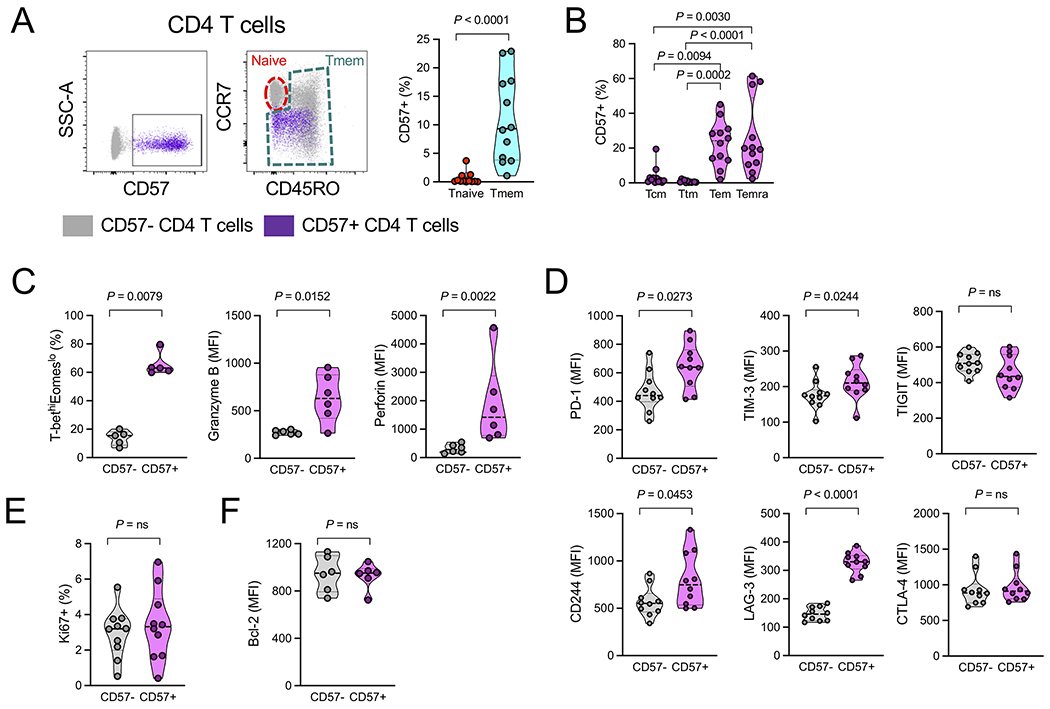
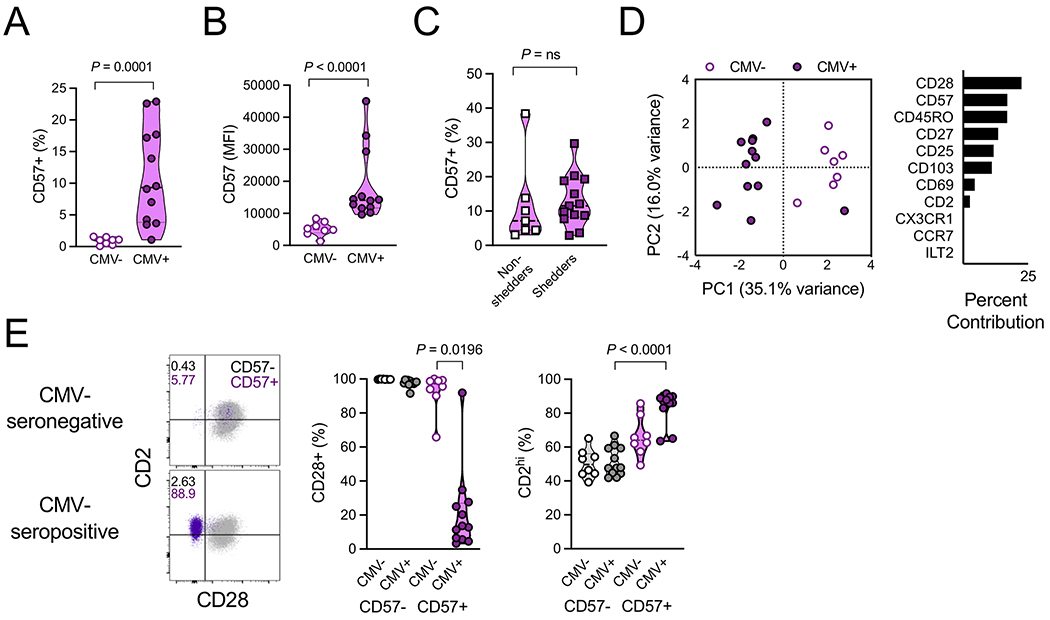
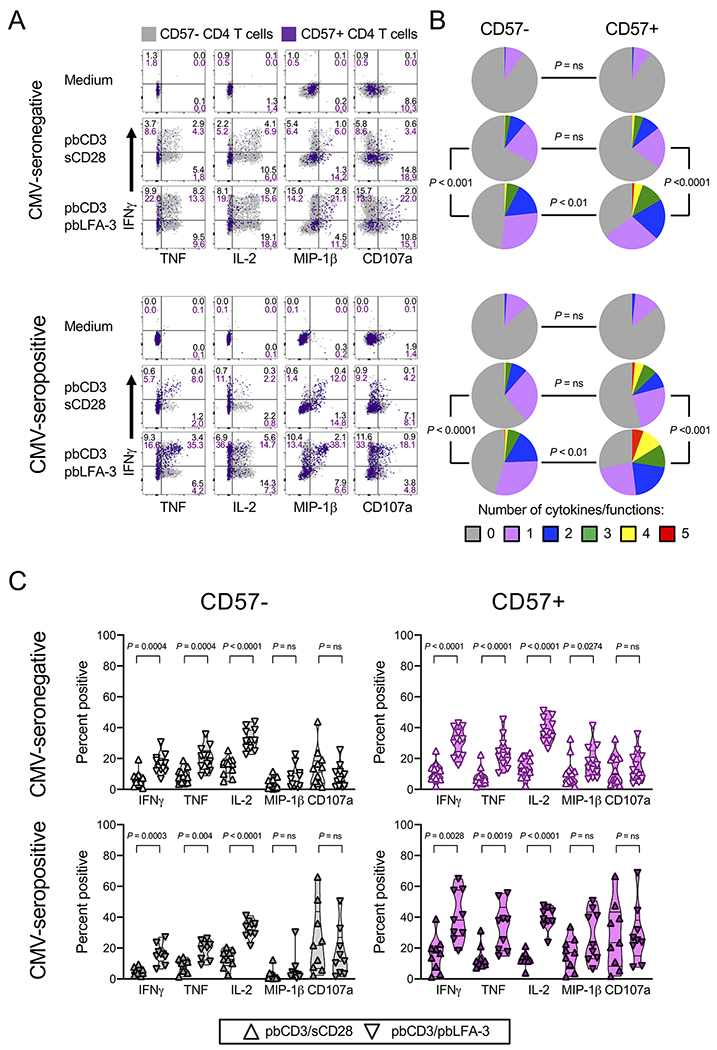
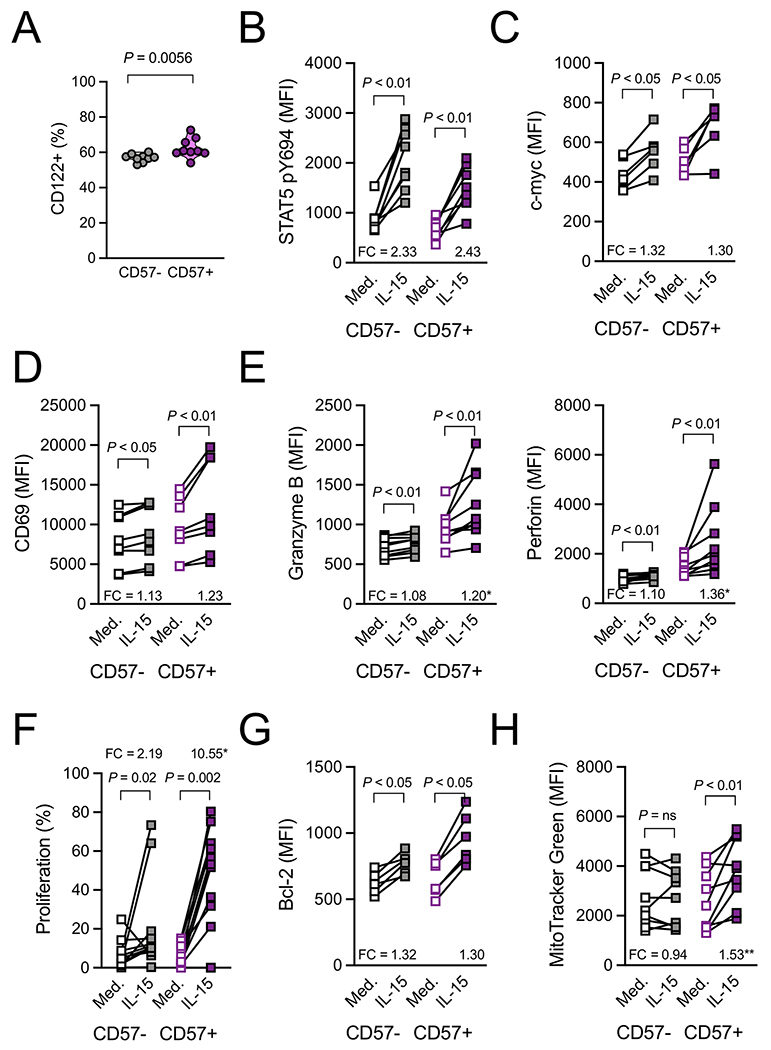
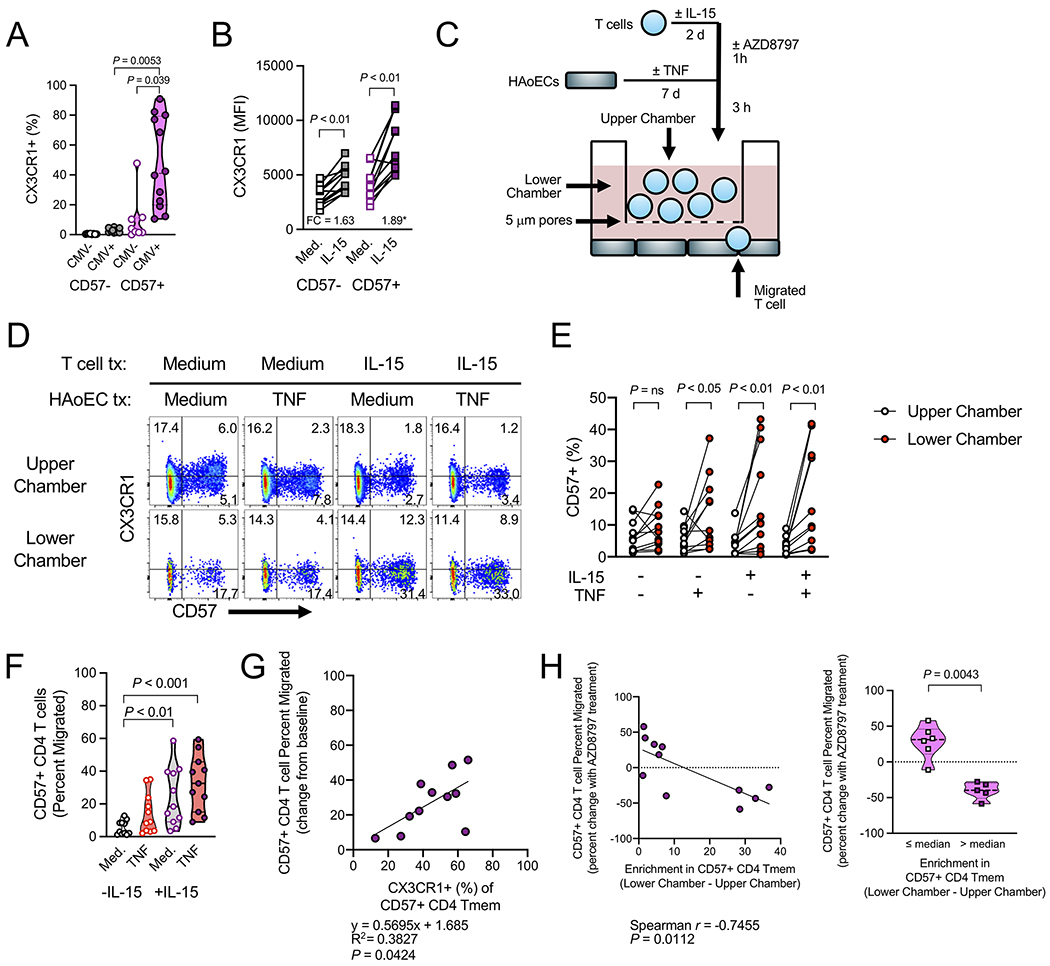
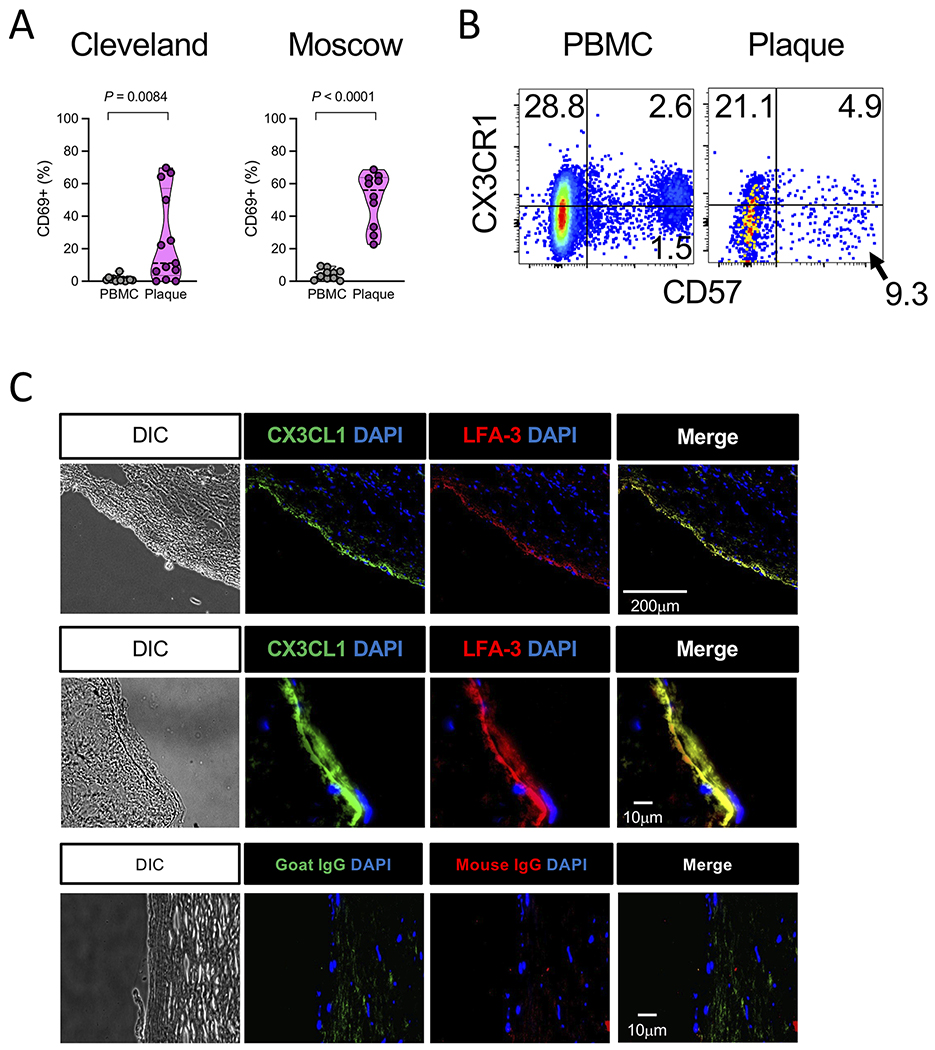
Cytotoxic CD4 T cells are linked to cardiovascular morbidities and accumulate in both HIV and CMV infections, both of which are associated with increased risk of cardiovascular disease (CVD). In this study, we identify CMV coinfection as a major driver of the cytotoxic phenotype, characterized by elevated CD57 expression and reduced CD28 expression, in circulating CD4 T cells from people living with HIV infection, and investigate potential mechanisms linking this cell population to CVD. We find that human CD57+ CD4 T cells express high levels of the costimulatory receptor CD2 and that CD2/LFA-3 costimulation results in a more robust and polyfunctional effector response to TCR signals, compared with CD28-mediated costimulation. CD57+ CD4 T cells also express the vascular endothelium-homing receptor CX3CR1 and migrate toward CX3CL1-expressing endothelial cells in vitro. IL-15 promotes the cytotoxic phenotype, elevates CX3CR1 expression, and enhances the trafficking of CD57+ CD4 T cells to endothelium and may therefore be important in linking these cells to cardiovascular complications. Finally, we demonstrate the presence of activated CD57+ CD4 T cells and expression of CX3CL1 and LFA-3 in atherosclerotic plaque tissues from HIV-uninfected donors. Our findings are consistent with a model in which cytotoxic CD4 T cells contribute to CVD in HIV/CMV coinfection and in atherosclerosis via CX3CR1-mediated trafficking and CD2/LFA-3-mediated costimulation. This study identifies several targets for therapeutic interventions and may help bridge the gap in understanding how CMV infection and immunity are linked to increased cardiovascular risk in people living with HIV infection.


Conflict of interest statement

CONFLICTS OF INTEREST

N.T.F serves as a consultant for Gilead. The work of L.M. was funded by the NICHD Intramural Program. All other authors declare no competing interests.

Figures

Figure 1.
Figure 1.
CD57+ CD4 Tmem have an effector phenotype in PLWH. (A)(Left) Representative dotplots (n = 12) showing CD57 expression on CD4 T cells, and distribution of CD57+ CD4 T cells (purple) within naïve (red) or memory T cell (Tmem, cyan) populations. (Right) Quantification of CD57+ CD4 T cells within naïve or Tmem populations. Significance determined by Mann-Whitney test. (B) Percentage of CD4 Tmem subpopulations that are CD57+. Significance determined by Friedman test. Tcm, CD45RO+CCR7+; Ttm, CD45RO+CCR7−CD27+; Tem, CD45RO+CCR7−CD27−; Temra, CD45RO−CCR7−. (C) Percentage of CD57− or CD57+ CD4 Tmem that are T-bethiEomeslo, and mean fluorescence intensity (MFI) of intracellular granzyme B and perforin expression. Significance determined by Mann-Whitney test. (D) MFI of surface PD-1, TIM-3, TIGIT, CD244 (2B4), LAG-3, and CTLA-4 expression on CD57− and CD57+ CD4 Tmem. Significance determined by Mann-Whitney test. (E) Percentage of CD57− or CD57+ CD4 Tmem that are Ki67+ and (F) MFI of intracellular Bcl-2 expression. Significance determined by Mann-Whitney test.
Figure 2.
Figure 2.
CMV coinfection promotes CD57+CD28−CD2hi CD4 Tmem in PLWH. (A) Percentage of CD4 Tmem expressing CD57 in CMV-seronegative (CMV−; n = 8) and CMV-seropositive (CMV+; n = 12) donors. Significance determined by Mann-Whitney test. (B) Mean fluorescence intensity (MFI) of CD57 expression on CD57+ CD4 Tmem in same donors as in A. Significance determined by Mann-Whitney test. (C) Percentage of CD4 Tmem expressing CD57 in CMV-seropositive PLWH who had previously been characterized for whether they had asymptomatic CMV replication in their seminal plasma (shedders, n = 15) or not (non-shedders, n = 14). Significance determined by Mann-Whitney test. (D) (Left) Principal component analysis of CD57+ CD4 Tmem from donors in A. (Right) Component contributions to principle component 1. (E) (Left) Representative dotplots show CD2 and CD28 expression on CD57− (gray) and CD57+ (purple) CD4 Tmem in same donors as in A. (Right) Percentage of indicated CD4 Tmem populations expressing CD28 or high levels of CD2 (CD2hi). Significance determined by Kruskal-Wallis test with Dunn’s correction for multiple comparisons.
Figure 3.
Figure 3.
CD2/LFA-3 costimulation enhances CD57+ CD4 Tmem polyfunctionality. (A) Representative dotplots showing IFNγ and TNF, IL-2, MIP-1β, or CD107a expression by CD57− (gray) and CD57+ (purple) CD4 Tmem from CMV-seronegative (n = 12, top) and CMV-seropositive (n = 9, bottom) donors after 6h stimulation with medium control; plate-bound anti-CD3, soluble anti-CD28 (pbCD3/sCD28); or plate-bound anti-CD3, plate-bound LFA-3 (pbCD3/pbLFA-3). (B) Cumulative cytokine/functions in the different groups as in A. Significance determined by pie comparisons using SPICE software, with 10,000 permutations per comparison. (C) Percentage of CD57− and CD57+ CD4 Tmem in each donor group that produce the indicated functions after pbCD3sCD28 or pbCD3pbLFA-3 stimulation. Significance determined by Mann-Whitney test.
Figure 4.
Figure 4.
IL-15 activates and arms CD57+ CD4 Tmem. (A) Percentage of CD57− and CD57+ CD4 Tmem from CMV-seropositive donors (n = 9) that express CD122. Significance determined by Mann-Whitney test. (B) Mean fluorescence intensity (MFI) of STAT5 phosphorylated at Y604 on CD57− or CD57+ CD4 Tmem from CMV-seropositive PLWH (n = 8) after 45 minutes of stimulation with medium control or IL-15 (20ng/ml). (C) MFI of intracellular c-myc expression on CD57− or CD57+ CD4 Tmem from CMV-seropositive PLWH (n = 6) after 48h of stimulation with medium control or IL-15 (20ng/ml). (D) MFI of surface CD69 expression and (E) intracellular granzyme B and perforin expression on CD57− or CD57+ CD4 Tmem from HIV-uninfected control donors (n=8-9/group) after 48h of stimulation with medium control or IL-15 (20ng/ml). (F) Percentage of CD57− or CD57+ CD4 Tmem that proliferated (diluted CellTrace Violet dye) from HIV-uninfected control donors (n=12). (G) MFI of intracellular Bcl-2 expression on CD57− or CD57+ CD4 Tmem from CMV-seropositive PLWH donors (n = 6) after 48h of stimulation with medium control or IL-15 (20ng/ml). (H) MFI of MitoTracker Green staining on CD57− or CD57+ CD4 Tmem from HIV-uninfected control donors (n=9) after 48h of stimulation with medium control or IL-15 (20ng/ml). (B-H) Significance determined by Wilcoxon signed rank test. Differences in fold change (FC) determined by Mann-Whitney test. *P ≤ 0.05; **P ≤ 0.01.
Figure 5.
Figure 5.
IL-15 and TNF enhance the chemoattraction of CD57+ CD4 Tmem toward CX3CL1-expressing endothelial cells. (A) Percentage of CD57− and CD57+ CD4 Tmem from CMV-seronegative (n = 8) and CMV-seropositive (n = 12) donors that express CX3CR1. Significance determined by Kruskal-Wallis test with Dunn’s correction for multiple comparisons. (B) MFI of CX3CR1 staining on CD57− or CD57+ CD4 Tmem from HIV-uninfected control donors (n = 12) after 48h of stimulation with medium control or IL-15 (20ng/ml). Significance determined by Wilcoxon signed rank test. Differences in fold change (FC) determined by Mann-Whitney test. *P ≤ 0.05. (C) Schematic diagram of the transwell assay system. Confluent monolayers of human aortic endothelial cells (HAoECs) were cultured in the presence or absence of TNF (10ng/ml) for 7 days in wells of a 24-well plate. Purified T cells from CMV-seropositive PLWH (n = 11) were exposed to IL-15 (20ng/ml) or medium control for 2 days prior to placement in the upper chamber of a 5μm transwell situated onto the HAoEC monolayer. In some cases, T cells were treated with AZD8797 (500nM) for 1 hour prior to co-culture. After 3 hours, T cells were separately harvested from the upper and lower chambers and analyzed by flow cytometry. (D) Representative dotplots showing CX3CR1 and CD57 expression on CD4 T cells in transwell assay from upper and lower chambers in indicated conditions. (E) Percentage of CD4 T cells recovered from the upper and lower chambers expressing CD57 after 3 hours. Significance determined by Wilcoxon signed rank test. (F) Absolute number of CD57+ CD4 T cells in the lower chamber expressed as a percent of total (upper chamber + lower chamber) CD57+ CD4 T cells (“Percent migrated”) in indicated conditions. Significance determined by Kruskal-Wallis test with Dunn’s correction for multiple comparisons. (G) The proportion of CD57+ CD4 Tmem that expresses CX3CR1 predicts the percent migrated of CD57+ CD4 T cells in the assay after IL-15 and TNF co-treatment (minus no treatment baseline). Significance determined by simple linear regression. (H) (Left) Enrichment in the percentage of CD57+ CD4 Tmem (lower chamber minus upper chamber) versus the percentage change in percent migrated following AZD8797 treatment of CD57+ CD4 Tmem in the IL-15 and TNF co-treatment condition. Significance determined by Spearman analysis. (Right) The percentage change in percent migrated following AZD8797 treatment of CD57+ CD4 Tmem in the IL-15 and TNF co-treatment condition for donors whose CD57+ CD4 Tmem enrichment was at the median value or below and those who enrichment was greater than the median value. Significance determined by Mann-Whitney test.
Figure 6.
Figure 6.
Atherosclerotic plaque tissue contains CD57+ CD4 Tmem and CX3CL1 and LFA-3 proteins. (A) Percentage of CD4 T cells expressing CD69 in PBMCs or donor-matched plaque tissue from Cleveland (n = 14) or Moscow (n = 10) cohorts. Significance determined by Mann-Whitney test. (B) Representative dotplots (n = 14) showing surface CD57 expression on CD4 T cells derived from the PBMCs or plaque tissue. (C) Representative images (n = 4) from cryopreserved carotid endarterectomy tissue sections show DAPI, CX3CL1, and LFA-3, or isotype control staining in the carotid endothelium and sub-endothelial regions at low magnification (top row) or high magnification (middle and bottom rows).

Similar articles

Cited by

References

    1. Lederman MM, Funderburg NT, Sekaly RP, Klatt NR, and Hunt PW. 2013. Residual immune dysregulation syndrome in treated HIV infection. Adv Immunol 119: 51–83. - PMC - PubMed
    1. Longenecker CT, Sullivan C, and Baker JV. 2016. Immune activation and cardiovascular disease in chronic HIV infection. Curr Opin HIV AIDS 11: 216–225. - PMC - PubMed
    1. Freeman ML, Lederman MM, and Gianella S. 2016. Partners in Crime: The Role of CMV in Immune Dysregulation and Clinical Outcome During HIV Infection. Curr HIV/AIDS Rep 13: 10–19. - PMC - PubMed
    1. Wang H, Peng G, Bai J, He B, Huang K, Hu X, and Liu D. 2017. Cytomegalovirus Infection and Relative Risk of Cardiovascular Disease (Ischemic Heart Disease, Stroke, and Cardiovascular Death): A Meta-Analysis of Prospective Studies Up to 2016. J Am Heart Assoc 6. - PMC - PubMed
    1. Deeks SG 2011. HIV infection, inflammation, immunosenescence, and aging. Annu Rev Med 62: 141–155. - PMC - PubMed

Publication types