

Pioglitazone ameliorates neuronal damage after traumatic brain injury via the PPARγ/NF-κB/IL-6 signaling pathway
- PMID: 32215295
- PMCID: PMC7083749
- DOI: 10.1016/j.gendis.2019.05.002
Pioglitazone ameliorates neuronal damage after traumatic brain injury via the PPARγ/NF-κB/IL-6 signaling pathway
Abstract
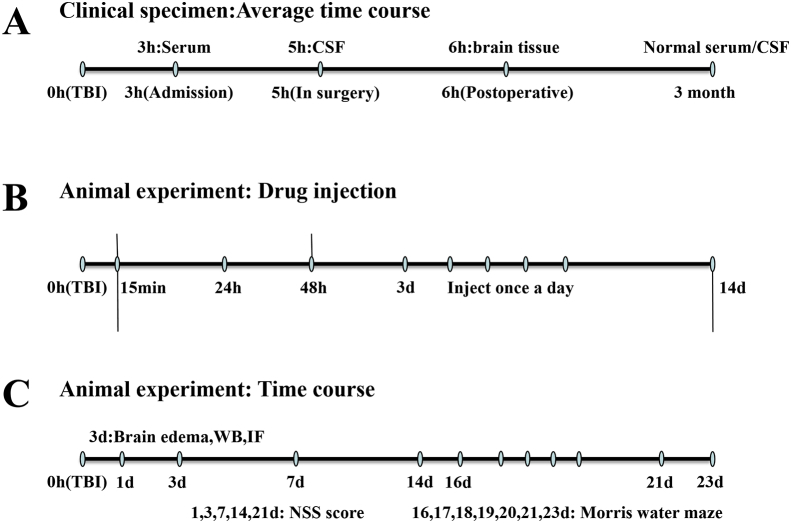
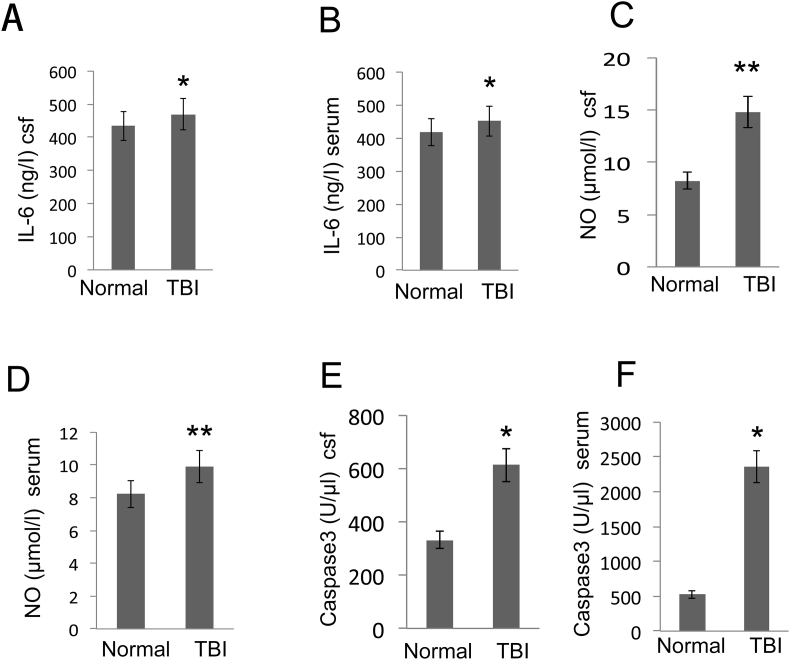
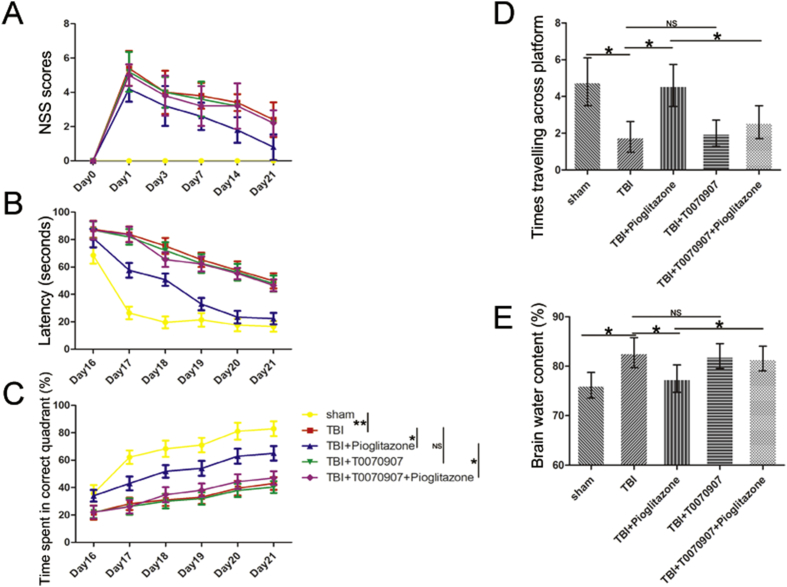
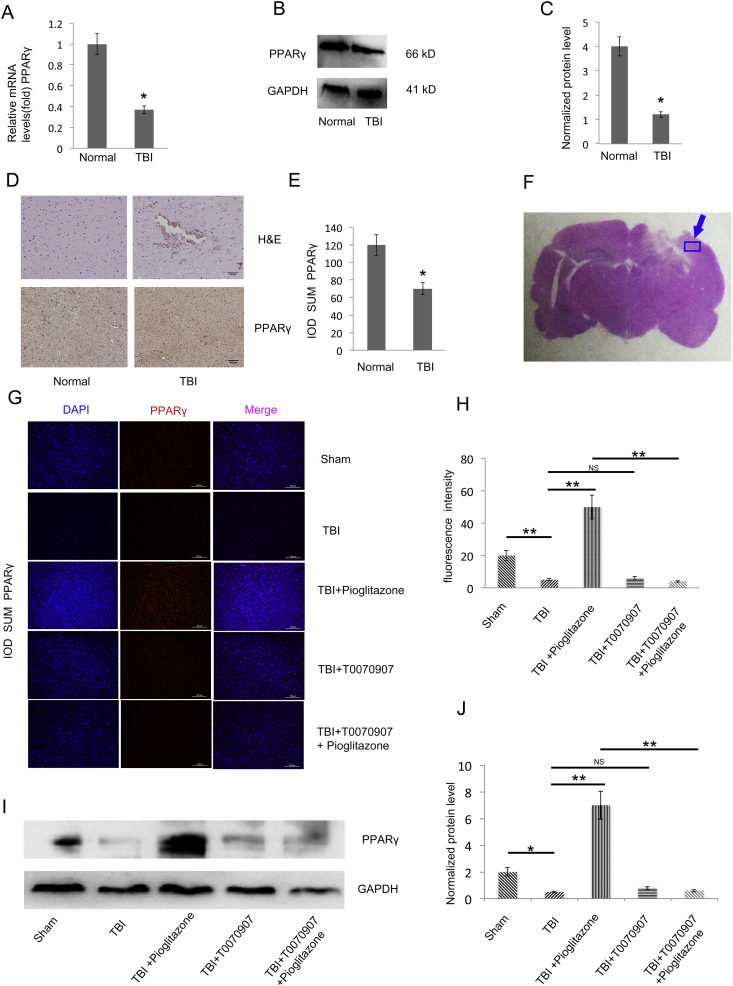
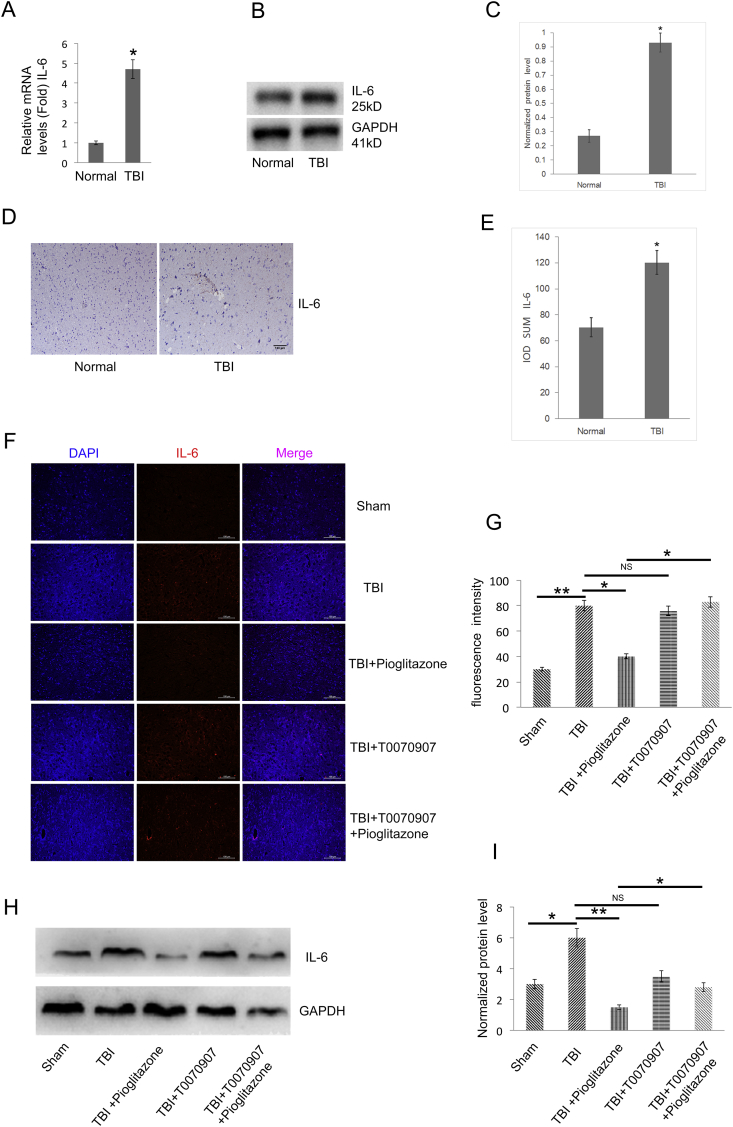
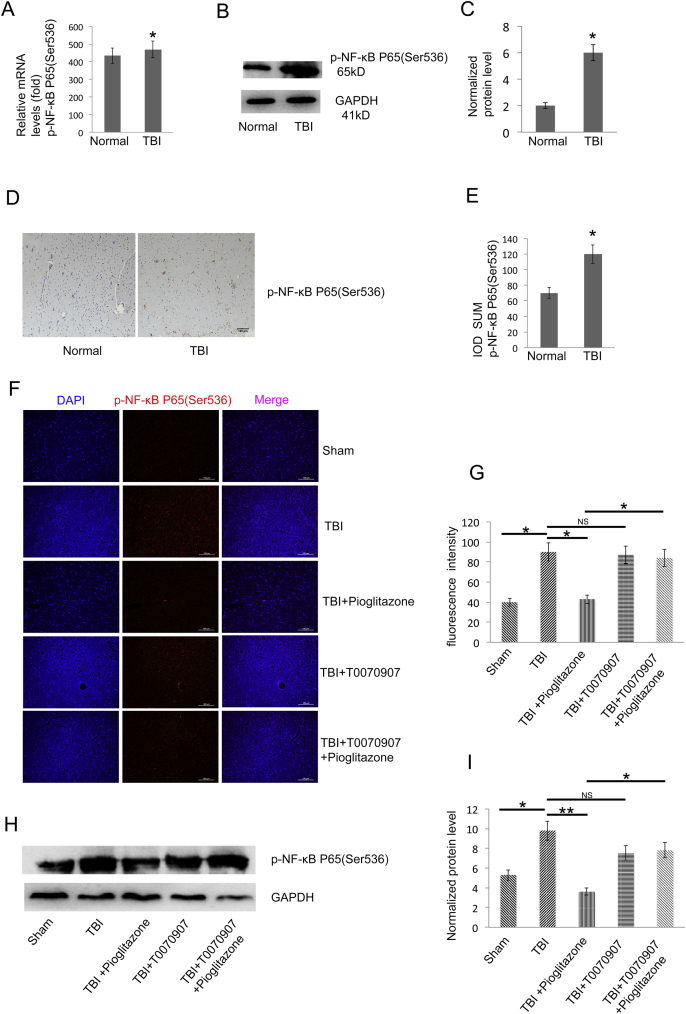
Traumatic brain injury (TBI) is the major cause of high mortality and disability rates worldwide. Pioglitazone is an activator of peroxisome proliferator-activated receptor-gamma (PPARγ) that can reduce inflammation following TBI. Clinically, neuroinflammation after TBI lacks effective treatment. Although there are many studies on PPARγ in TBI animals, only few could be converted into clinical, since TBI mechanisms in humans and animals are not completely consistent. The present study, provided a potential theoretical basis and therapeutic target for neuroinflammation treatment after TBI. First, we detected interleukin-6 (IL-6), nitric oxide (NO) and Caspase-3 in TBI clinical specimens, confirming a presence of a high expression of inflammatory factors. Western blot (WB), quantitative real-time PCR (qRT-PCR) and immunohistochemistry (IHC) were used to detect PPARγ, IL-6, and p-NF-κB to identify the mechanisms of neuroinflammation. Then, in the rat TBI model, neurobehavioral and cerebral edema levels were investigated after intervention with pioglitazone (PPARγ activator) or T0070907 (PPARγ inhibitor), and PPARγ, IL-6 and p-NF-κB were detected again by qRT-PCR, WB and immunofluorescence (IF). The obtained results revealed that: 1) increased expression of IL-6, NO and Caspase-3 in serum and cerebrospinal fluid in patients after TBI, and decreased PPARγ in brain tissue; 2) pioglitazone could improve neurobehavioral and reduce brain edema in rats after TBI; 3) the protective effect of pioglitazone was achieved by activating PPARγ and reducing NF-κB and IL-6. The neuroprotective effect of pioglitazone on TBI was mediated through the PPARγ/NF-κB/IL-6 pathway.
Keywords: IL-6; PPARγ; Pioglitazone; Traumatic brain injury; p-NF-κB.
© 2019 Chongqing Medical University. Production and hosting by Elsevier B.V.
Figures
Similar articles
-
Enriched environment may improve secondary brain injury after traumatic brain injury by regulating the TLR2/NF-κB signaling pathway.J Cent Nerv Syst Dis. 2024 Nov 20;16:11795735241301568. doi: 10.1177/11795735241301568. eCollection 2024. J Cent Nerv Syst Dis. 2024. PMID: 39574429 Free PMC article.
-
Traumatic Brain Injury-Mediated Neuroinflammation and Neurological Deficits are Improved by 8-Methoxypsoralen Through Modulating PPARγ/NF-κB Pathway.Neurochem Res. 2023 Feb;48(2):625-640. doi: 10.1007/s11064-022-03788-6. Epub 2022 Nov 1. Neurochem Res. 2023. PMID: 36319778
-
Neuroprotective effects of pioglitazone in a rat model of permanent focal cerebral ischemia are associated with peroxisome proliferator-activated receptor gamma-mediated suppression of nuclear factor-κB signaling pathway.Neuroscience. 2011 Mar 10;176:381-95. doi: 10.1016/j.neuroscience.2010.12.029. Epub 2010 Dec 24. Neuroscience. 2011. PMID: 21185913
-
Neuroprotective and Anti-inflammatory Effects of Pioglitazone on Traumatic Brain Injury.Mediators Inflamm. 2022 Jun 17;2022:9860855. doi: 10.1155/2022/9860855. eCollection 2022. Mediators Inflamm. 2022. PMID: 35757108 Free PMC article. Review.
-
Docosahexaenoic acid attenuates LPS-stimulated inflammatory response by regulating the PPARγ/NF-κB pathways in primary bovine mammary epithelial cells.Res Vet Sci. 2017 Jun;112:7-12. doi: 10.1016/j.rvsc.2016.12.011. Epub 2017 Jan 5. Res Vet Sci. 2017. PMID: 28095338 Review.
Cited by
-
Transcriptional Factors and Protein Biomarkers as Target Therapeutics in Traumatic Spinal Cord and Brain Injury.Curr Neuropharmacol. 2020;18(11):1092-1105. doi: 10.2174/1570159X18666200522203542. Curr Neuropharmacol. 2020. PMID: 32442086 Free PMC article. Review.
-
Cannabinoids in traumatic brain injury and related neuropathologies: preclinical and clinical research on endogenous, plant-derived, and synthetic compounds.J Neuroinflammation. 2023 Mar 19;20(1):77. doi: 10.1186/s12974-023-02734-9. J Neuroinflammation. 2023. PMID: 36935484 Free PMC article. Review.
-
Interleukin-6 in Traumatic Brain Injury: A Janus-Faced Player in Damage and Repair.J Neurotrauma. 2023 Nov;40(21-22):2249-2269. doi: 10.1089/neu.2023.0135. Epub 2023 Aug 10. J Neurotrauma. 2023. PMID: 37166354 Free PMC article. Review.
-
Discovery of 2-deoxy glucose surfaced mixed layer dendrimer: a smart neuron targeted systemic drug delivery system for brain diseases.Theranostics. 2024 May 19;14(8):3221-3245. doi: 10.7150/thno.95476. eCollection 2024. Theranostics. 2024. PMID: 38855177 Free PMC article.
-
Mild traumatic brain injury increases vulnerability to cerebral ischemia in mice.Exp Neurol. 2021 Aug;342:113765. doi: 10.1016/j.expneurol.2021.113765. Epub 2021 May 13. Exp Neurol. 2021. PMID: 33992581 Free PMC article.
References
-
- Cornelius C., Crupi R., Calabrese V. Traumatic brain injury: oxidative stress and neuroprotection. Antioxid Redox Signal. 2013;19(8):836–853. - PubMed
-
- Kurowska P., Chmielinska J., Ptak A. Expression of peroxisome proliferator-activated receptors is regulated by gonadotropins and steroid hormones in in vitro porcine ovarian follicles. J Physiol Pharmacol – Offic J Pol Physiol Soc. 2017;68(6):823–832. - PubMed
-
- Barbiero J.K., Santiago R., Tonin F.S. PPAR-alpha agonist fenofibrate protects against the damaging effects of MPTP in a rat model of Parkinson's disease. Prog Neuropsychopharmacol Biol Psychiatry. 2014;53:35–44. - PubMed
LinkOut - more resources
Full Text Sources
Research Materials
Miscellaneous
