. 2020 Apr 16;181(2):460-474.e14.
doi: 10.1016/j.cell.2020.02.049. Epub 2020 Mar 18.

A Pan-plant Protein Complex Map Reveals Deep Conservation and Novel Assemblies

Affiliations

A Pan-plant Protein Complex Map Reveals Deep Conservation and Novel Assemblies

Claire D McWhite et al. Cell. .

Abstract

Plants are foundational for global ecological and economic systems, but most plant proteins remain uncharacterized. Protein interaction networks often suggest protein functions and open new avenues to characterize genes and proteins. We therefore systematically determined protein complexes from 13 plant species of scientific and agricultural importance, greatly expanding the known repertoire of stable protein complexes in plants. By using co-fractionation mass spectrometry, we recovered known complexes, confirmed complexes predicted to occur in plants, and identified previously unknown interactions conserved over 1.1 billion years of green plant evolution. Several novel complexes are involved in vernalization and pathogen defense, traits critical for agriculture. We also observed plant analogs of animal complexes with distinct molecular assemblies, including a megadalton-scale tRNA multi-synthetase complex. The resulting map offers a cross-species view of conserved, stable protein assemblies shared across plant cells and provides a mechanistic, biochemical framework for interpreting plant genetics and mutant phenotypes.

Keywords: co-fractionation mass spectrometry (CF-MS); comparative proteomics; cross-linking mass spectrometry (CL-MS); evolution; interaction-to-phenotype; pathogen defense; plants; protein complexes; protein interactions.


Conflict of interest statement

Declaration of Interests The authors declare no competing interests.

Figures
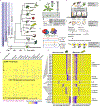
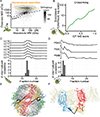
Figure 1.
Figure 1.. Integrative Co-fractionation Mass Spectrometry (CF-MS) Workflow Used to Determine Stable Plant Protein Complexes.
(A) The selected species represent a broad range of evolutionary time (MYA, million years ago (Kumar et al., 2017)). (B) Native extracts are chromatographically separated and the proteins in each fraction identified by mass spectrometry. (C) Co-fractionation of proteins is evidence of physical association. (D) Proteins from each species’ proteome are first assigned to orthologous groups (OGs). (E) Peptides that match more than one orthogroup (light gray text) are not used, however peptides that uniquely match a single orthogroup are used to quantify the abundance of an orthogroup in individual chromatographic fractions. Elution profiles for each orthogroup are shown here as ridgelines or heat maps (blue showing normalized abundance). (F) Heat map of the full dataset of abundance measurements for each of the 23,896 detected orthogroups across all fractionations for the thirteen species. Dashes under heat map delineate each fractionation experiment. (G) Enlarged portions of (F) showing observed strong co-elution for subunits (names at left, see Table S1) of six well-known protein complexes (names at right). Color intensity (blue is positive signal) depicts measured abundances for each orthogroup (labeled at left) in two distinct chromatographic separations (labeled at top) out of the 35 total separations.
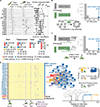
Figure 2.
Figure 2.. Proteomics in High-Ploidy Species Enhanced by Assignment of Proteins to Orthogroups. Also Figure S1
(A) Number of proteins assigned per orthogroup for each plant species in our study colored by ploidy. Shaded ovals at left represent subgenome organization. (B) Fold increase (x-axis) in peptide spectral matches that identify unique orthogroups vs. unique proteins. Each bar represents a single fractionation experiment conducted on the species named at left and color-coded by ploidy as in (A). (C) The number of observed proteins (left plot) or orthogroups (right plot) experimentally observed (in blue) compared to the possible total in the proteome (gray). Note that relative coverage per species is a function of the amount of data collected from that species in this study. (D) Our data set is sufficient to identify the majority of orthogroups possible by this method. Each dot represents the number of orthogroups identified (y-axis) in a subsample of n experiments (x-axis), with sampling repeated ten times per each n. (E) Orthogroups with more than two proteins were approximately equally likely to be represented by a single dominant protein as not, regardless of ploidy. (F) Orthogroups observed by mass spectra (green) represent those with higher mRNA abundances (TPM, transcripts per million, log scale; data from (Panchy et al., 2014)), as shown for Chlamydomonas. Gray represents orthogroups not observed in our study. (G) Log-scale protein abundances (y-axis) show expected correlation with RNA abundances (x-axis, Transcripts per million; same as in (F)) in Chlamydomonas, however with numerous outliers, notably, RuBisCo (green dot).
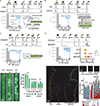
Figure 3.
Figure 3.. Derivation and Global Validation of Protein Co-Complex Interactions. Also Figure S2
(A) Precision-Recall of CF-MS scored protein-protein interactions (PPIs) on 886 known interactions withheld from training. (B) False Discovery Rate (FDR) vs. CF-MS scores for the same withheld set as in (A). (C) PPIs with high CF-MS scores (FDR < 10%) are highly correlated in a species withheld from training (maize). (D) Protein interactions with higher CF-MS scores were more likely to have been identified by affinity purification, 2-hybrid in Arabidopsis, and were more likely to be co-expressed in Arabidopsis and rice. (E) Agreement of the CF-MS protein-protein interactions (yellow) with affinity purification (blue) and 2-hybrid interactions (red) for three protein complexes.
Figure 4.
Figure 4.. Protein Complexes Validated by Calibrated Molecular Mass Determination and Direct Chemical Cross-linking.
(A) Observed mass vs. predicted monomeric mass in a representative Arabidopsis size exclusion chromatography (SEC) fractionation. Shading reflects the number of orthogroups per hexagonal bin. (B) Cross-linked proteins from soy and Chlamydomonas are more likely (green line, log-likelihood) to have high CF-MS scores compared to non-cross-linked observed proteins. (C-D) Inter-subunit cross-links only appear in fractions where complex subunits co-elute. Elution profile and inter-subunit crosslinks for soy T-complex chaperonin (CCT) shown in (C) and Chlamydomonas Photosystem II (PSB) shown in (D) (E-F) 3D homology models of complexes (see STAR methods) with observed inter-subunit cross-links (black lines). Soy CCT (E) is colored by subunit, and Chlamydomonas Photosystem II (E) highlights PSBB, PSBC, and PSBO as blue, red, and yellow, respectively.
Figure 5.
Figure 5.. Overview of Evolutionarily Conserved Plant Protein Complexes. Also Figure S3
Thin concentric circles show the clustering hierarchy of protein-protein interactions into complexes for each of four clustering thresholds. (Table S4 lists complexes and annotations.) Protein orthogroups (filled circles) are colored green for associations previously reported in any species or yellow for those first reported in this study. Bold outlines denote proteins uncharacterized in plants, defined as uncharacterized if all proteins in the orthogroup lack an Arabidopsis gene symbol and a Uniprot Function annotation. Bold complex labels are discussed in the text.
Figure 6.
Figure 6.. Alternative Assemblies in Plant Analogs of Animal Multi-Protein Complexes.
(A) Plant Multi-tRNA Synthetase Complex (MSC). Top left, elution profiles of proteins observed in large molecular weight complexes containing aminoacyl tRNA synthetases in soy and wheat size exclusion fractionations. Top right, the observed molecular mass (circles) for each protein at left in all plant size exclusion separations in our data set compared to the predicted monomeric mass (triangles). Bottom, schematic of the domain structure and organization of MSC proteins in representative eukaryotic lineages. (B) A plant proteasome assembly chaperone complex, with orthology of plant PAC2 to the human analog PAC2 indicated with double-headed black arrow. Right, the CF-MS score for the PAC2-PAC2L interaction (blue arrow) far exceeds that of any other protein interaction score with either PAC2 or PAC2L. Gray bars are binned CF-MS interaction scores for all other protein interactions. (C) A plant transcriptional response module, with orthology of RZ1B/C to the human analog RBMX indicated with double-headed black arrow. Right, the CF-MS score for the RZ1B/C-VRN1 interaction (blue arrow), gray bars as in (B). (D) Novel subunits of chloroplast NADH dehydrogenase-like complex (NDH). Left, heatmap shows coelution (purple) of known NDH subunits along with three novel interactors in specific plant extracts (arrows below). Middle, network diagram with proteins (circles) connected by interaction lines where line thickness reflects CF-MS score. Right, illustration of conserved molecular architecture and use of rhodanese sulfurtransferase subunit modules in electron transport complexes - two plant-specific (NDH, FNR) and one conserved mitochondrial (Complex I). Bottom, median CF-MS scores to all NDH subunits shown for known NDH subunits and all rhodanese-like domain proteins in plants.
Figure 7.
Figure 7.. Connecting Plant Genes to Phenotypes via Their Interactions.
The top section of each lettered panel shows sparklines with sample species and tissues indicated above. Bottom left panel of each lettered panel shows the complex interaction score (CF-MS) between subunits (blue arrow) is far greater than the interaction of either subunit with any other observed protein (gray bars representing binned scores). (A) OSM34 and CHIB form a complex, consistent with co-expression evidence in response to fungal infection (diagram bottom right). (B) PIP and NUDT3 form a complex in plants. Bacterial members of the PIP and NUDT families are injected into plant cells by a Type III secretion system. (C) DOMINO1 and LA1 form a plant-specific ribosomal RNA-binding complex and heterozygotes of each have a similar Arabidopsis T-DNA insertion mutant phenotype of abnormal white seeds containing arrested embryos. Bottom left, representative portions of siliques from genotypes as labeled. Lower right, quantification of visually abnormal seeds in three siliques of each genotype. Ratio of normal to abnormal seeds reflects variable penetrance of the mutant phenotype and presence of homozygous and heterozygous embryos in each silique. (D) Arabidopsis plants homozygous for VDAC2/5 or 3βHSD/D T-DNA insertion mutants show delayed flowering and reduced number of fertile siliques compared to wild type plants of the same stage. Lower panels illustrate fertility defects with main inflorescences at end of flowering. While vdac2 homozygotes produce almost no seeds, 3βhsd/d mutants show a range of fertility levels, ranging from plants with almost no seed-containing siliques to plants in which only early siliques show fertility defects. An enlarged view of wild type and early infertile siliques from plants of the genotypes is shown.

Comment in

Similar articles

Cited by

References

    1. Abdrakhmanova A, Dobrynin K, Zwicker K, Kerscher S, and Brandt U (2005). Functional sulfurtransferase is associated with mitochondrial complex I from Yarrowia lipolytica, but is not required for assembly of its iron–sulfur clusters. FEBS Lett. 579, 6781–6785. - PubMed
    1. Adamiec M, Ciesielska M, Zalaś P, and Luciński R (2017). Arabidopsis thaliana intramembrane proteases. Acta Physiol. Plant. 39, 146.
    1. Ahn H-K, Yoon J-T, Choi I, Kim S, Lee H-S, and Pai H-S (2019). Functional characterization of chaperonin containing T-complex polypeptide-1 and its conserved and novel substrates in Arabidopsis. J. Exp. Bot. 70, 2741–2757. - PMC - PubMed
    1. Arabidopsis Interactome Mapping, C. (2011). Evidence for network evolution in an Arabidopsis interactome map. Science 333, 601–607. - PMC - PubMed
    1. Armero A, Baudouin L, Bocs S, and This D (2017). Improving transcriptome de novo assembly by using a reference genome of a related species: Translational genomics from oil palm to coconut. PloS One 12, e0173300. - PMC - PubMed

Publication types

MeSH terms