. 2020 Jun 2;21(6):506-521.
doi: 10.1080/15384047.2020.1726718. Epub 2020 Mar 13.

Phosphorylated STAT3 (Tyr705) as a biomarker of response to pimozide treatment in triple-negative breast cancer

Affiliations

Phosphorylated STAT3 (Tyr705) as a biomarker of response to pimozide treatment in triple-negative breast cancer

Sundee Dees et al. Cancer Biol Ther. .

Abstract

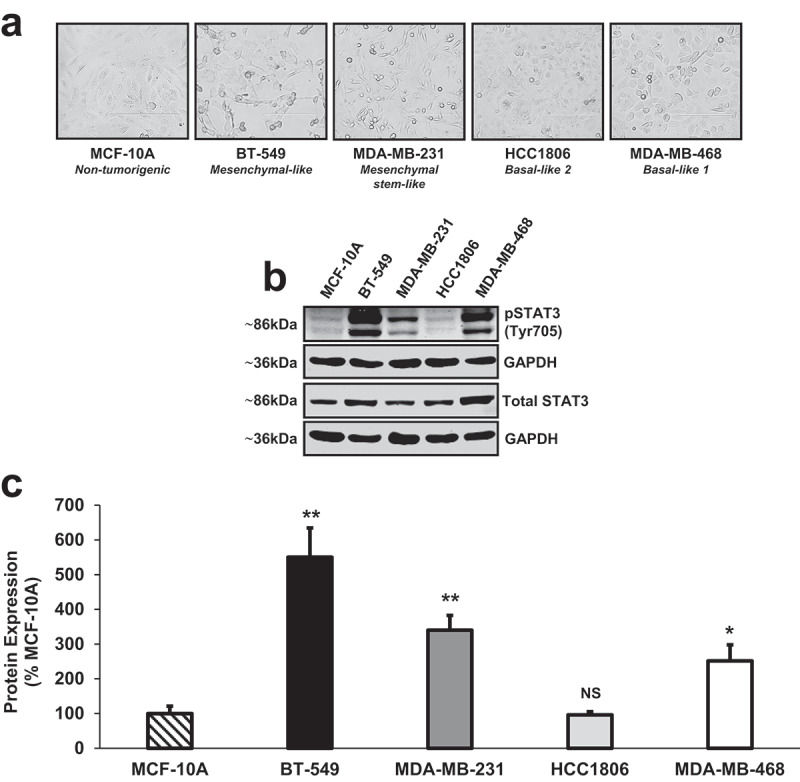
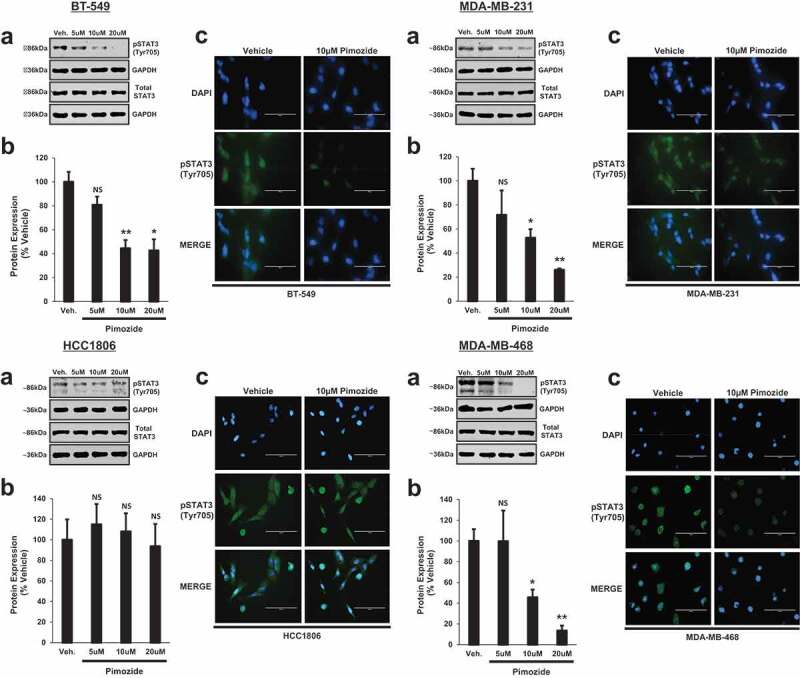
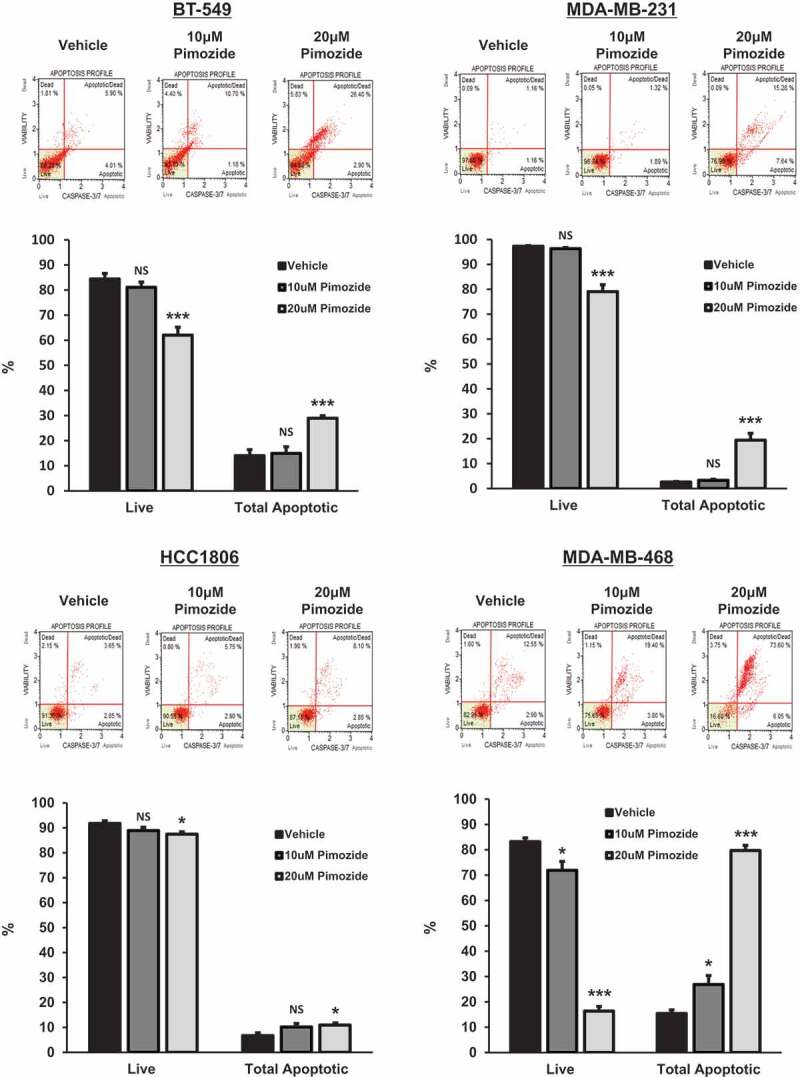
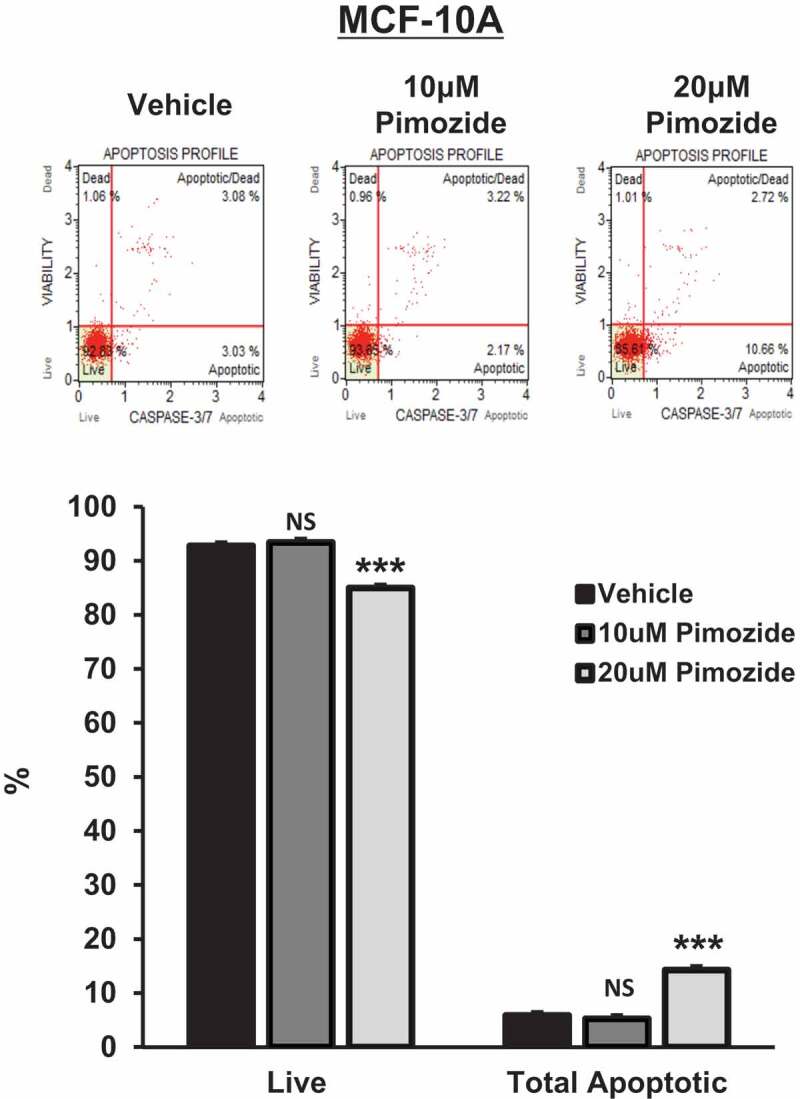
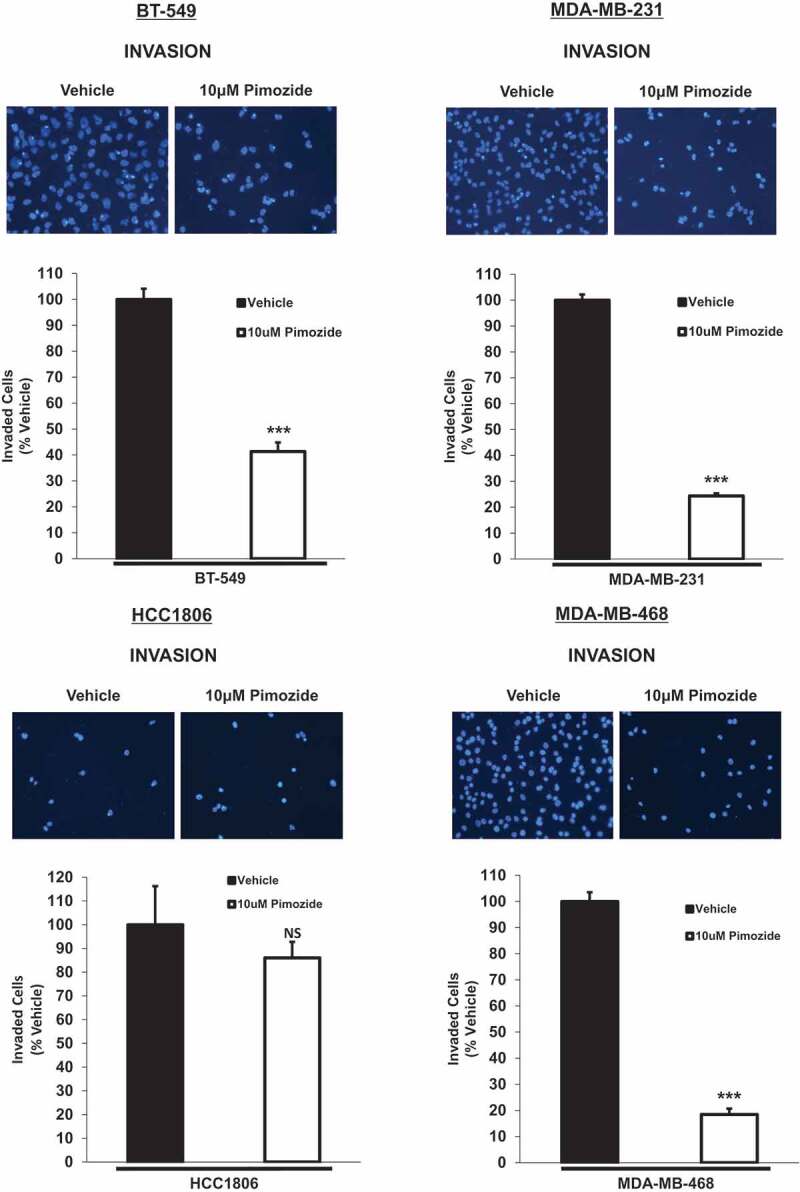
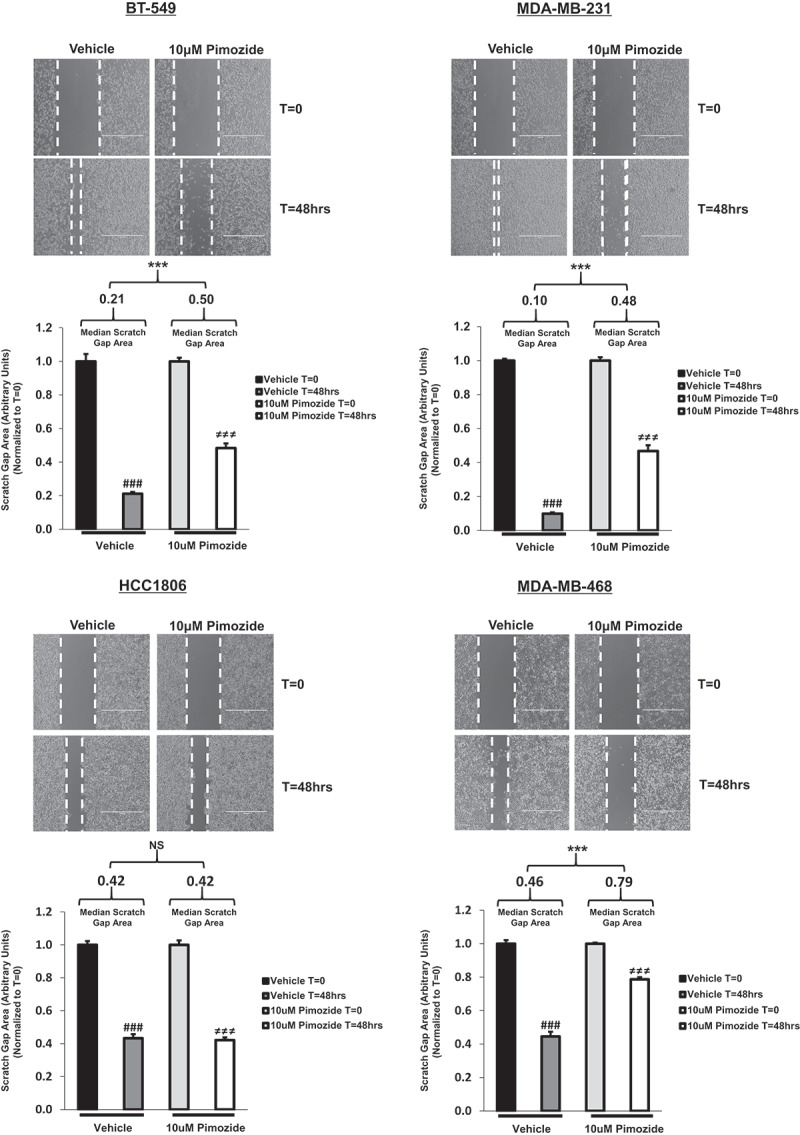
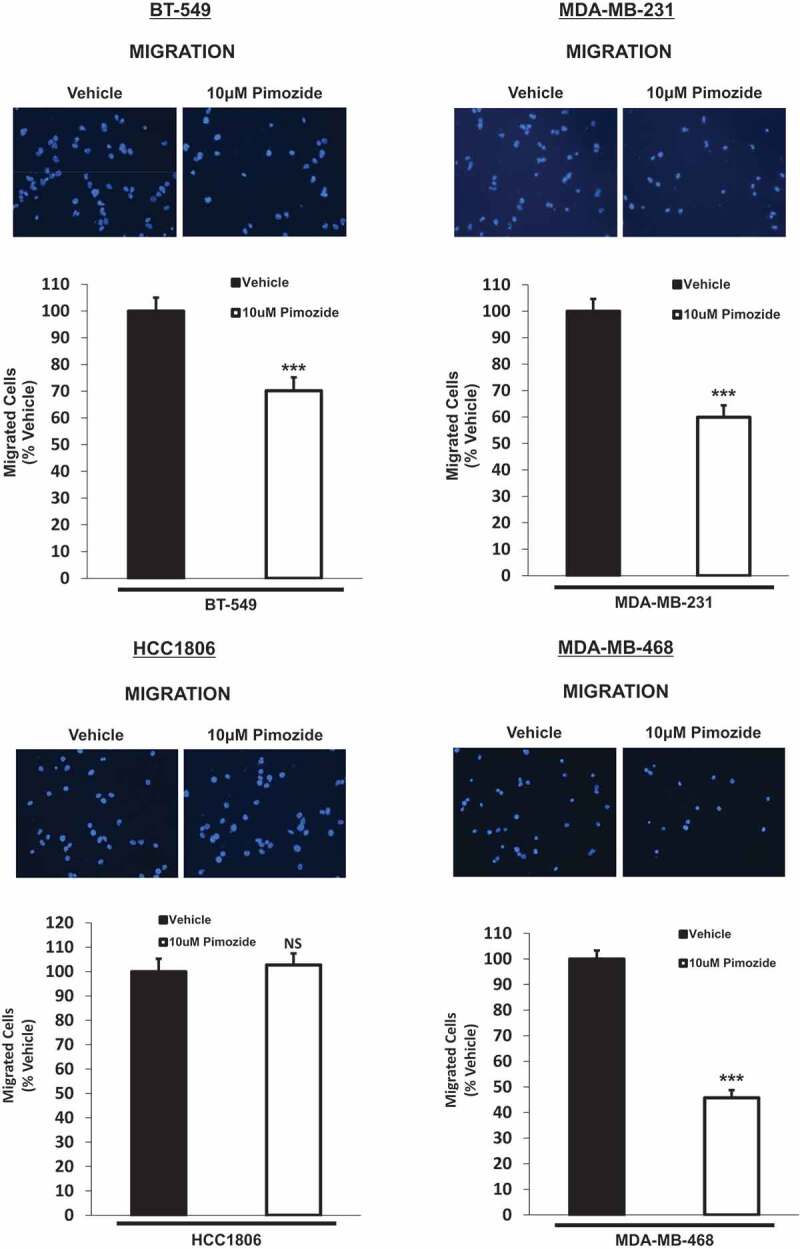
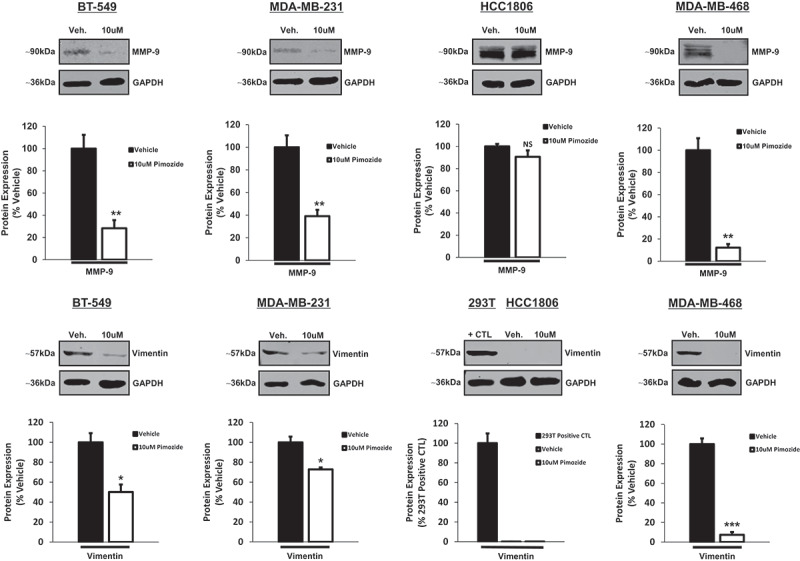
Triple-negative breast cancer (TNBC) displays an aggressive clinical course, heightened metastatic potential, and is linked to poor survival rates. Through its lack of expression of the estrogen receptor (ER), progesterone receptor (PR), and human epidermal growth factor receptor 2 (HER2), this subtype remains unresponsive to traditional targeted therapies. Undesirable and sometimes life-threatening side effects associated with current chemotherapeutic agents warrant the development of more targeted treatment options. Targeting signal transducer and activator of transcription 3 (STAT3), a transcription factor implicated in breast cancer (BCa) progression, has proven to be an efficient approach to halt cancer growth in vitro and in vivo. Currently, there are no FDA-approved STAT3 inhibitors for TNBC. Although pimozide, a FDA-approved antipsychotic drug, has been attributed a role as a STAT3 inhibitor in several cancers, its role on this pathway remains unexplored in TNBC. As a "one size fits all" approach cannot be applied to TNBC therapies due to the heterogeneous nature of this aggressive cancer, we hypothesized that STAT3 could be a novel biomarker of response to guide pimozide therapy. Using human cell lines representative of four TNBC subtypes (basal-like 1, basal-like 2, mesenchymal-like, mesenchymal stem-like), our current report demonstrates that pimozide significantly reduced their invasion and migration, an effect that was predicted by STAT3 phosphorylation on tyrosine residue 705 (Tyr705). Mechanistically, phosphorylated STAT3 (Tyr705) inhibition resulting from pimozide treatment caused a downregulation of downstream transcriptional targets such as matrix metalloproteinase-9 (MMP-9) and vimentin, both implicated in invasion and migration. The identification of biomarkers of response to TNBC treatments is an active area of research in the field of precision medicine and our results propose phosphorylated STAT3 (Tyr705) as a novel biomarker to guide pimozide treatment as an inhibitor of invasion and migration.

Keywords: STAT3; biomarker; drug repurposing; pimozide; precision Medicine; triple-negative breast cancer.


Figures

Figure 1.
Figure 1.
Endogenous STAT3 expression levels across four different TNBC subtypes: BT-549 (mesenchymal-like), MDA-MB-231 (mesenchymal stem-like), HCC1806 (basal-like 2), MDA-MB-468 (basal-like 1). (a) Phase contrast images captured at 20x objective using the EVOS FL microscope (transmitted setting) depict the morphologies of a non-tumorigenic human mammary epithelial cell line (MCF-10A) and four human TNBC cell lines representative of different molecular subtypes: BT-549 (mesenchymal-like), MDA-MB-231 (mesenchymal stem-like), HCC1806 (basal-like 2), MDA-MB-468 (basal-like 1). (b) Western blot analysis revealed that endogenous phosphorylated STAT3 (Tyr705) protein levels were constitutively activated in three of the four human TNBC cell lines examined (BT-549, MDA-MB-231, MDA-MB-468) as compared to non-tumorigenic breast epithelial cells (MCF-10A). Basal expression of phosphorylated STAT3 (Tyr705) in HCC1806 TNBC cells was not significantly different from phosphorylated STAT3 (Tyr705) expression in MCF-10A cells. GAPDH is shown as a control for equal loading. (c) Densitometry analysis was performed using a LI-COR imager. Quantitatively, phosphorylated STAT3 (Tyr705) and total STAT3 were each normalized to their respective loading controls (GAPDH). Then, a ratio of phosphorylated STAT3 (Tyr705) to total STAT3 was calculated. Data are reported as % MCF-10A. All TNBC cell lines, except HCC1806 cells, showed a significant increase in phosphorylated STAT3 (Tyr705) protein expression when compared to non-tumorigenic mammary epithelial cells (BT-549: 5.5-fold, p < .01, n = 3), (MDA-MB-231: 3.4-fold, p < .01, n = 3), (HCC1806: NS, p = .878, n = 3), (MDA-MB-468: 2.5-fold, p < .05, n = 3).
Figure 2.
Figure 2.
Inhibition of phosphorylated STAT3 (Tyr705) by pimozide, a FDA-approved antipsychotic. (a) Western blot analysis shows phosphorylated (Tyr705) and total STAT3 protein expression in BT-549, MDA-MB-231, HCC1806, MDA-MB-468 TNBC cells upon treatment with vehicle (DMSO), 5 μM, 10 μM, or 20 μM pimozide for 24 h. Final DMSO concentration was kept at less than 0.2%. GAPDH is shown as a loading control. (b) Using a LI-COR imager, densitometry was used to quantitate the inhibition of STAT3 by pimozide. The ratio of phosphorylated STAT3 (Tyr705) to total STAT3 was calculated upon normalizing to respective loading controls. Data are reported as % vehicle. Significant inhibition of STAT3 phosphorylation (Tyr705) in BT-549, MDA-MB-231, and MDA-MB-468 cell lines was observed at 10 μM and 20 μM doses of pimozide as compared to vehicle-treated counterparts. No change in STAT3 phosphorylation (Tyr705) was observed in HCC1806 cells with pimozide treatment (BT-549: 5 μM Pimozide, NS, p = .151, n = 3; 10 μM Pimozide, 2.2-fold, p < .01, n = 3; 20 μM Pimozide, 2.3-fold, p < .05, n = 3), (MDA-MB-231: 5 μM Pimozide, NS, p = .281, n = 3; 10 μM Pimozide, 1.9-fold, p < .05, n = 3; 20 μM Pimozide, 3.8-fold, p < .01, n = 3), (HCC1806: 5 μM Pimozide, NS, p = .622, n = 3; 10 μM Pimozide, NS, p = .780, n = 3; 20 μM Pimozide, NS, p = .838, n = 3), (MDA-MB-468: 5 μM Pimozide, NS, p = .994, n = 3; 10 μM Pimozide, 2.2-fold, p < .05, n = 3; 20 μM Pimozide, 7.4-fold, p < .01, n = 3). (c) Qualitatively, immunofluorescence analysis demonstrated a reduction in phosphorylated STAT3 (Tyr705) nuclear expression in response to 10 μM pimozide treatment compared to vehicle treatment in BT-549, MDA-MB-231, and MDA-MB-468 cells. Nuclear expression of phosphorylated STAT3 (Tyr705) was unchanged in HCC1806 cells upon treatment with pimozide. Images were captured at 40x objective using the EVOS FL microscope (blue: DAPI immunostaining; green: phosphorylated STAT3 (Tyr705) immunostaining). DAPI was used as a nuclear counterstain. Immunofluorescence experiments were performed in triplicate on cells derived from three independent passages.
Figure 3.
Figure 3.
Dose-dependent cytotoxicity of pimozide in TNBC cells: a 10 μM dose of pimozide is non-cytotoxic to non-tumorigenic mammary epithelial cells. Top panels show caspase-3/7 activation profiles for BT-549, MDA-MB-231, HCC1806, and MDA-MB-468 TNBC cells and MCF-10A non-tumorigenic mammary epithelial cells treated with vehicle (DMSO), 10 μM, or 20 μM pimozide for 48 h. The raw percentage of live, (early) apoptotic, (late) apoptotic/dead, and dead cells in each sample are displayed. Bottom graphs represent quantitatively live and apoptotic populations. Cell lines dosed with 20 μM pimozide for 48 h showed elevated levels of caspase-3/7 activation compared to vehicle-treated counterparts, as evidenced by decreases in live cells and increases in total apoptotic cell populations. A lower 10 μM dose of pimozide was non-cytotoxic to normal MCF-10A cells and all TNBC cell lines when compared to vehicle, with the exception of MDA-MB-468 cells, which showed only minor cytotoxicity. Total apoptotic cell populations refer to the sum of (early) apoptotic and (late) apoptotic/dead cells (BT-549: 10 μM Pimozide, live cells, NS, p = .298, n = 3; total apoptotic cells, NS, p = .803, n = 3; 20 μM Pimozide, live cells, 1.4-fold, p < .001, n = 3; total apoptotic cells, 2.1-fold, p < .001, n = 3), (MDA-MB-231: 10 μM Pimozide, live cells, NS, p = .089, n = 3; total apoptotic cells, NS, p = .154, n = 3; 20 μM Pimozide, live cells, 1.2-fold, p < .001, n = 3; total apoptotic cells, 7.5-fold, p < .001, n = 3), (HCC1806: 10 μM Pimozide, live cells, NS, p = .121, n = 3; total apoptotic cells, NS, p = .078, n = 3; 20 μM Pimozide, live cells, 1.1-fold, p < .05, n = 3; total apoptotic cells, 1.6-fold, p < .05, n = 3), (MDA-MB-468: 10 μM Pimozide, live cells, 1.2-fold, p < .05, n = 3; total apoptotic cells, 1.7-fold, p < .05, n = 3; 20 μM Pimozide, live cells, 5.1-fold, p < .001, n = 3; total apoptotic cells, 5.2-fold, p < .001, n = 3), (MCF-10A: 10 μM Pimozide, live cells, NS, p = .297, n = 3; total apoptotic cells, NS, p = .313, n = 3; 20 μM Pimozide, live cells, 1.1-fold, p < .001, n = 3; total apoptotic cells, 2.4-fold, p < .001, n = 3).
Figure 3.
Figure 3.
(Continued).
Figure 4.
Figure 4.
Pimozide inhibits the invasive potential of BT-549, MDA-MB-231, and MDA-MB-468 TNBC cells in vitro, an effect predicted by phosphorylated STAT3 (Tyr705) inhibition. Qualitatively, transwell invasion assay results depict DAPI-stained invaded cells after 24 h treatment with vehicle (DMSO) or 10 μM pimozide (top images). Images of the invaded cells were captured using the DAPI channel on the EVOS FL microscope at 20x objective. Quantitatively (bottom graphs), the number of invaded cells in five representative fields of view were averaged for each membrane. Data are reported as % vehicle. All TNBC cell lines except HCC1806 cells showed a significant decrease in invasion when treated with 10 μM pimozide for 24 h in comparison to vehicle-stimulated cells (BT-549: 2.4-fold, p < .001, n = 3), (MDA-MB-231: 4.1-fold, p < .001, n = 3), (HCC1806: NS, p = .446, n = 3), (MDA-MB-468: 5.4-fold, p < .001, n = 3).
Figure 5.
Figure 5.
Pimozide prevents scratch gap closure of BT-549, MDA-MB-231, and MDA-MB-468 TNBC cells in an in vitro wound-healing migration assay. Using the transmitted setting on the EVOS FL microscope, phase contrast images captured at 4x objective depict wound-healing migration assay results (top images). Upon inducing a scratch on a monolayer of confluent cells, TNBC cells were treated with vehicle (DMSO) or 10 μM pimozide for 48 h. Closure of the scratch gap for each treatment condition was monitored over time. The area contained within the scratch gap was measured using the “polygon selections” tool in Image J software. Data are displayed as scratch gap area in arbitrary units, normalized to T = 0 measurements (bottom graphs). Quantitatively, the scratch gap area at T = 48 h relative to T = 0 was calculated independently for each treatment group and reported as median scratch gap area (displayed in graph) with an interquartile range (IQR) (BT-549: Vehicle (T = 48/T = 0), 0.21 median, 0.05 IQR, p < .001, n = 3; Pimozide (T = 48/T = 0), 0.50 median, 0.02 IQR, p < .001, n = 3), (MDA-MB-231: Vehicle (T = 48/T = 0), 0.10 median, 0.02 IQR, p < .001, n = 3; Pimozide (T = 48/T = 0), 0.48 median, 0.05 IQR, p < .001, n = 3), (HCC1806: Vehicle (T = 48/T = 0), 0.42 median, 0.07 IQR, p < .001, n = 3; Pimozide (T = 48/T = 0), 0.42 median, 0.07 IQR, p < .001, n = 3), (MDA-MB-468: Vehicle (T = 48/T = 0), 0.46 median, 0.10 IQR, p < .001, n = 3; Pimozide (T = 48/T = 0), 0.79 median, 0.05 IQR, p < .001, n = 3). In BT-549, MDA-MB-231, and MDA-MB-468 cells, a significant difference in median scratch gap area at T = 48 h relative to T = 0 was found between vehicle and pimozide treated groups (BT-549: p < .01, n = 3), (MDA-MB-231: p < .01, n = 3), (MDA-MB-468: p < .01, n = 3). In HCC1806 cells, no significant difference in median scratch gap area at T = 48 h relative to T = 0 was observed between vehicle- and pimozide-treated groups (HCC1806: p = .936, n = 3). Furthermore, upon observing each treatment condition independently over time, vehicle-treated cells showed a significant difference in scratch gap area from T = 0 to T = 48 h (###p < .001, n = 3) and pimozide-treated cells showed a significant difference in scratch gap area from T = 0 to T = 48 h (≠≠≠p < .001, n = 3).
Figure 6.
Figure 6.
Pimozide suppresses the migratory potential of BT-549, MDA-MB-231, and MDA-MB-468 TNBC cellsin vitro. Qualitatively, transwell migration assay results depict DAPI-stained migrated cells after 16-h treatment with vehicle (DMSO) or 10 μM pimozide (top images). Images of the migrated cells were captured using the DAPI channel on the EVOS FL microscope at 20x objective. Note: HCC1806 cells (5.0 × 104) were treated with vehicle or 10 μM pimozide for an extended timepoint of 48 h to ensure a reasonable number of migrated cells for quantitative analysis. Quantitatively, the number of migrated cells in five representative fields of view were averaged for each membrane (bottom graphs). Data are reported as % vehicle. All TNBC cell lines except HCC1806 cells showed a significant decrease in migration when treated with 10 μM pimozide in comparison to vehicle-stimulated cells (BT-549: 1.4-fold, p < .001, n = 3), (MDA-MB-231: 1.7-fold, p < .001, n = 3), (HCC1806: NS, p = .707, n = 3), (MDA-MB-468: 2.2-fold, p < .001, n = 3).
Figure 7.
Figure 7.
Pimozide inhibits downstream STAT3 transcriptional targets involved in metastatic progression in BT-549, MDA-MB-231, and MDA-MB-468 TNBC cells. Western blot analysis shows MMP-9 and vimentin protein expression in BT-549, MDA-MB-231, HCC1806, MDA-MB-468 TNBC cells treated with vehicle (DMSO) or 10 μM pimozide for 24 h. 293T cells were utilized as a positive control for vimentin expression in HCC1806 cells. GAPDH is shown as a control for equal loading. Using a LI-COR imager, densitometry analysis was used to quantitate Western bands. Each marker was normalized to its respective loading control. Data are displayed as % vehicle or % positive control (for vimentin expression in HCC1806 cells). Both MMP-9 and vimentin protein expression were significantly suppressed in BT-549, MDA-MB-231, and MDA-MB-468 cell lines after 24-h treatment with a 10 μM dose of pimozide as compared to vehicle-treated counterparts. No change in MMP-9 protein expression was observed in HCC1806 cells treated with vehicle or pimozide. Basal protein expression of vimentin was undetectable in HCC1806 cells (293T cells were used as a positive control for vimentin expression) (BT-549: MMP-9, 3.5-fold, p < .01, n = 3; Vimentin, 2.0-fold, p < .05, n = 3), (MDA-MB-231: MMP-9, 2.6-fold, p < .01, n = 3; Vimentin, 1.4-fold, p < .05, n = 3), (HCC1806: MMP-9, NS, p = .204, n = 3; Vimentin, undetectable expression, n = 3), (MDA-MB-468: MMP-9, 8.2-fold, p < .01, n = 3; Vimentin, 13.5-fold, p < .001, n = 3).

Similar articles

Cited by

References

    1. Ismail-Khan R, Bui MM.. A review of triple-negative breast cancer. Cancer Control. 2010;17:173–176. doi:10.1177/107327481001700305. - DOI - PubMed
    1. Uscanga-Perales GI, Santuario-Facio SK, Ortiz-Lopez R. Triple negative breast cancer: deciphering the biology and heterogeneity. Med Universitaria. 2016;18:105–114. doi:10.1016/j.rmu.2016.05.007. - DOI
    1. Foulkes WD, Smith IE, Reis-Filho JS. Triple-negative breast cancer. N Engl J Med. 2010;363:1938–1948. doi:10.1056/NEJMra1001389. - DOI - PubMed
    1. Dent R, Trudeau M, Pritchard KI, Hanna WM, Kahn HK, Sawka CA, Lickley LA, Rawlinson E, Sun P, Narod SA. Triple-negative breast cancer: clinical features and patterns of recurrence. Clin Cancer Res. 2007;13:4429–4434. doi:10.1158/1078-0432.CCR-06-3045. - DOI - PubMed
    1. Wahba HA, El-Hadaad HA. Current approaches in treatment of triple-negative breast cancer. Cancer Biol Med. 2015;12:106–116. doi:10.7497/j.issn.2095-3941.2015.0030. - DOI - PMC - PubMed

MeSH terms