. 2020 Mar;26(3):398-407.
doi: 10.1038/s41591-020-0781-z. Epub 2020 Mar 11.

A soluble phosphorylated tau signature links tau, amyloid and the evolution of stages of dominantly inherited Alzheimer's disease

Collaborators, Affiliations

A soluble phosphorylated tau signature links tau, amyloid and the evolution of stages of dominantly inherited Alzheimer's disease

Nicolas R Barthélemy et al. Nat Med. 2020 Mar.

Abstract

Development of tau-based therapies for Alzheimer's disease requires an understanding of the timing of disease-related changes in tau. We quantified the phosphorylation state at multiple sites of the tau protein in cerebrospinal fluid markers across four decades of disease progression in dominantly inherited Alzheimer's disease. We identified a pattern of tau staging where site-specific phosphorylation changes occur at different periods of disease progression and follow distinct trajectories over time. These tau phosphorylation state changes are uniquely associated with structural, metabolic, neurodegenerative and clinical markers of disease, and some (p-tau217 and p-tau181) begin with the initial increases in aggregate amyloid-β as early as two decades before the development of aggregated tau pathology. Others (p-tau205 and t-tau) increase with atrophy and hypometabolism closer to symptom onset. These findings provide insights into the pathways linking tau, amyloid-β and neurodegeneration, and may facilitate clinical trials of tau-based treatments.


Conflict of interest statement

Competing interests

R.J.B. has equity ownership interest in C2N Diagnostics and receives royalty income based on technology (stable isotope labeling kinetics and blood plasma assay) licensed by Washington University to C2N Diagnostics. R.J.B. receives income from C2N Diagnostics for serving on the scientific advisory board. Washington University, with R.J.B., E.M. and N.R.B. as co-inventors, has submitted the US nonprovisional patent application ‘Cerebrospinal fluid (CSF) tau rate of phosphorylation measurement to define stages of Alzheimer’s disease and monitor brain kinases/phosphatases activity’. R.J.B. has received honoraria from Janssen and Pfizer as a speaker, and from Merck and Pfizer as an advisory board member. E.M. has received royalty payments for an educational program supported by Eli Lilly and as a member of a scientific advisory board for Eli Lilly.

Figures

Extended Data Fig. 1 |
Extended Data Fig. 1 |. Individual longitudinal changes of different phosphorylated-tau sites and total tau highlights differences in the time of increase relative to disease onset.
Individual, z-transformed, longitudinal changes in the ratio of phosphorylation of a, pT217/T217, b, pT181/T181 c, total tau, d, pT205/T205, and e, pS202/S202 for mutation carriers (orange = asymptomatic mutation carriers, (n = 152), red = symptomatic mutation carriers (n = 77)) and non-carriers (blue, (n = 141)) across the estimated years to symptom onset (EYO). The vertical dashed line is the point of expected symptom onset, the vertical green line represents the model estimated time when the rate of change for each p-tau isoform becomes greater for mutation carriers compared to non-carriers.
Extended Data Fig. 2 |
Extended Data Fig. 2 |. Individual longitudinal changes of different unphosphorylated-tau sites.
Individual, z-transformed, longitudinal changes in the unphosphorylated levels of a, T217, b, T181 c, T205 for mutation carriers (orange = asymptomatic mutation carriers, (n = 152), red = symptomatic mutation carriers (n = 77)) and non-carriers (blue, (n = 141)) across the estimated years to symptom onset (EYO). The solid line represents a LOESS fit to cross-sectional and longitudinal data. The vertical dashed line is the point of expected symptom onset. Compared to the phosphorylation ratios of each site (Extended Data Fig. 1), the increase in the unphosphorylated levels appears to be more similar over the progression of disease.
Extended Data Fig. 3 |
Extended Data Fig. 3 |. Change in tau phosphorylation state is site dependent and related to amyloid PET and disease stage in DIAD and sAD.
Bar charts illustrating the proportion of participants that have p-tau ratios and total tau levels that exceed the normal values (biomarker + (red)) (a- d) as the stage of disease progresses from cognitively normal/PiB-PET normal to cognitively normal/PiB-PET positive then to mild dementia (CDR 0.5) and greater (CDR >0.5). The top row is DIAD (n = 210) and the bottom row sAD (n = 83). The figure demonstrates very similar patterns for each phosphorylation ratio and total tau levels across the progression of disease and indicate a similar ordering in DIAD and SAD, generalizing these findings to AD.
Extended Data Fig. 4 |
Extended Data Fig. 4 |. Elevated levels of tau phosphorylation decline in some sites with atrophy of hippocampal volumes in contrast to a continued rise in total tau.
Estimated individual annual rates of change of p-tau isoforms and total tau, standardized by the mean and standard deviation of the estimated rate of change for all mutation carriers, (y-axis) for mutation carriers were correlated with the annual change in hippocampal volumes (a-d). The linear regression was fit to those with no dementia (CDR 0, black circle, n = 48) and dementia (CDR > 0, red triangle, n = 27). A decline in pT217/T217 (a), r = 0.74(p < 0.0001), pT181/T181 (b), r = 0.84 (p < 0.0001) and pT205/T205, r = 0.25 (p = 0.03) phosphorylation rate was associated with hippocampal volume decline. For total tau there was an inverse correlation with atrophy (d), r = −0.79(p < 0.0001). (e) A linear fit for all mutation carriers demonstrates there are distinct associations between declining cognition and changes in the different p-tau isoforms and total tau: with decreases in pT217/T217 and pT181/T181 and an increase in total tau associated with cognitive decline; and no associations with pT205/T205 or pS202/S202. This suggests that soluble tau species are not equivalent in AD (pS202/S202) is shown here to demonstrate the lack of association with cognition, r = −0.07 (p = 0.57). Statistical significance of the correlations was calculated using z test.
Extended Data Fig. 5 |
Extended Data Fig. 5 |. Elevated levels of tau phosphorylation decline in some sites with atrophy of precuneus cortex in contrast to a continued rise in total tau.
Estimated individual annual rates of change of p-tau isoforms and total tau, standardized by the mean and standard deviation of the estimated rate of change for all mutation carriers, (y-axis) for mutation carriers were correlated with the annual change in hippocampal volumes (a-d). The linear regression was fit to those with no dementia (CDR 0, black circle, n = 48) and dementia (CDR > 0, red triangle, n = 27). A decline in pT217/T217 (a), r = 0.75 (p < 0.0001), pT181/T181 (b), r = 0.83 (p < 0.0001) and pT205/T205, r = 0.19 (p = 0.09) phosphorylation rate was associated with precuneus cortical decline. For total tau there was an inverse correlation with atrophy (d), r = −0.77(p < 0.0001). (e) A linear fit for all mutation carriers demonstrates there are distinct associations between declining cognition and changes in the different p-tau isoforms and total tau: with decreases in p-T217 and p-T181 and an increase in total tau associated with cognitive decline; and no associations with pT205/T205 or pS202/S202. This suggests that soluble tau species are not equivalent in AD (pS202/S202 is shown here to demonstrate the lack of association with cognition, r = −0.04 (p = 0.72). Statistical significance of the correlations was calculated using two-sided t tests.
Extended Data Fig. 6 |
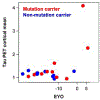
Extended Data Fig. 6 |. Tau PET increases near symptom onset in DIAD mutation carriers.
The mean cortical standardized unit value ratio (SUVR), y-axis, for mutation carriers (red, n = 12) and non-carriers (blue, n = 9) over estimated years to symptom onset (EYO), x-axis, for those participants with a longitudinal CSF evaluation preceding the time of tau-PET. The plot shows that for mutation carriers there is little elevation in tau-PET until the point of estimated symptom onset (EYO=0). This figure shows that the neurofibrillary tangle (NFT) pathology detected by AV-1451 occurs much later than the increase in multiple soluble phosphotau sites suggesting that these soluble markers of tau are likely a marker of NFT pathology, but rather might predispose to the development of the hyperphosphorylated, insoluble tau deposits characteristic of AD pathology.
Extended Data Fig. 7 |
Extended Data Fig. 7 |. Longitudinal change in tau and tau phosphorylation sites are differentially related to neurofibrillary tau (tau-PET) in dominantly inherited AD.
Individual, rates of change of phosphorylation and total tau (y-axis) in mutation carriers only leading up to the time of tau-PET scan (x-axis) (n = 12). The vertical line is an SUVR of 1.22 and represents a conservative estimate of the point when cortical tau-PET is considered elevated for tau aggregates compared to non-carriers. The plots suggest that increases in soluble tau and p-T205 are associated with higher levels of aggregated tau, whereas the rate of phosphorylation at p-T217 and p-T181 decrease as levels of aggregated tau increase. These findings suggest that there are differences between increasing levels of tau and phosphorylation at different sites and may indicate that, in some instances, soluble p-tau maybe sequestered as the burden of hyperphosphorylated aggregates increase with the spreading of tau pathology. They also suggest that with the increase in aggregated tau there is a rise in soluble tau levels which could represent either passive or active release with greater burden of aggregated tau pathology.
Extended Data Fig. 8 |
Extended Data Fig. 8 |. Spearman correlation of the cross-sectional association of p-tau phosphorylation, total tau (y-axis) and tau PET (x-axis) for mutation carriers (n = 12).
The vertical line is an SUVR of 1.22 and represents a conservative estimate of the point when cortical tau-PET is considered elevated for tau aggregates compared to non-carriers.
Fig. 1 |
Fig. 1 |. Stages of tau pathology.
Tau pathophysiology evolves through distinct phases in DIAD. Measures of four different soluble tau species and aggregated tau in DIAD show, over the course of 35 years, that tau sequentially changes by stage of disease related to amyloid plaques, cortical atrophy and metabolism. Starting with the development of fibrillar amyloid pathology, levels of pT217 (purple) and pT181 (blue) begin to increase. Then, with the increase in neuronal dysfunction (decreased cortical metabolism), levels of pT205 (green) begin to increase, along with soluble t-tau (orange). Lastly, with the onset of neurodegeneration (based on cortical atrophy and clinical decline), tau-PET tangles (red) begin to develop, while pT217 and pT181 decrease. Together, the dynamic and diverging patterns of soluble and aggregated tau begin in close relationship with amyloid pathology and change over the course of the disease.
Fig. 2 |
Fig. 2 |. Longitudinal changes of different p-tau sites are specific to disease stage and change in opposite directions as AD progresses in dominantly inherited mutation carriers.
LME model-estimated annual rates of change for each site of phosphorylation, based on the standardized mutation carrier data (n = 370), plotted by EYO along with PiB-PET (black dashed line; n = 304) and cognitive decline (aqua dashed line; n = 356). The solid circles represent the points at which the rate of change for each variable first become different for mutation carriers compared with non-carriers. This highlights the pattern of change for p-tau isoforms over the course of the AD spectrum and the close association between amyloid plaque growth and the increase in pT217/T217, with plaques beginning to increase at −21 EYO and hyperphosphorylation of T217 (purple) also beginning at −21 EYO, followed by an increase in hyperphosphorylation of T181 (blue) at −19 EYO and a decrease in the phosphorylation rate at these two sites associated with a decline in cognition. In contrast, phosphorylation of T205 (green) continues increasing throughout disease progression and t-tau levels (orange) increase at an increased rate near the time of symptom onset. Levels of pS202 do not increase throughout the disease course.
Fig. 3 |
Fig. 3 |. Specific soluble tau phosphorylation sites are differentially associated with amyloid plaques in DIAD and sAD.
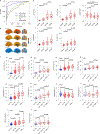
a, Receiver operating characteristics of tau phosphorylation with Aß pathology based on Aβ PiB-PET (SUVR cutoff of 1.25) in DIAD (n = 252). There is a near-perfect association with Aβ pathology for pT217/T217 (purple; AUC = 0.97). AUC values for the other phosphorylation ratios were: 0.89 (pT181/T181; blue); 0.74 (pT205/T205; green); 0.72 (t-tau; orange) and 0.69 (pS202/S202; gray). b, Standardized (z score) phosphorylation ratios (pT217/T217, pT181/T181, pS202/S202 and pT205/T205) and t-tau levels by Aβ PiB-PET quartile (n = 47 for Q1; n = 48 for Q2; n = 48 for Q3; n = 48 for Q4) for mutation carriers suggest site-specific differences in phosphorylation with increasing Aβ PiB-PET levels. pT217, pT181, pT205 and t-tau increase as Aβ PiB-PET increases. There was a significant decrease in the phosphorylation of S202 at the highest Aβ PiB-PET quartiles relative to the lowest (Wilcoxon rank-sum test). c, Change in phosphorylation rates and t-tau levels for DIAD (n = 209) and sAD (n = 86) across the spectrum of clinical progression (blue = cognitively normal/amyloid negative). For DIAD, there is evidence of a higher ratio of phosphorylation, and in both DIAD and sAD, the phosphorylation of T217 and T181 increases once amyloid pathology begins, followed by a plateau. In contrast, pT205 and t-tau levels increase at later stages of disease progression. For S202 in both DIAD and sAD, there is minimal change in the phosphorylation rate across the disease spectrum (Mann–Whitney U-test). For the box plots in b and c, the middle line represents the median; the upper and lower notches show the median ± 1.58× the interquartile range/square root(number of observations); and the upper (and lower) whiskers represent the largest observation greater (or less than or equal to) the upper (or lower) hinge + 1.58× the IQR. d, Cross-sectional, bivariate correlations between cortical and subcortical Aβ PiB-PET SUVR and site-specific phosphorylation for asymptomatic mutation carriers (n = 152). Colors represent correlations, with positive correlations in yellow/red and negative correlations in blue. P values for the correlations were derived from a z-test using the covariance matrix of the bivariate LME models. All correlations represent statistically significant values surviving a false discovery rate (P < 0.05) with Benjamini–Hochberg correction. They are arranged by correlation strength from top to bottom. CN, cognitively normal; MS, mass spectrometry.
Fig. 4 |
Fig. 4 |. Tau phosphorylation positions are differentially related to brain atrophy and hypometabolism in DIAD.
a, Bivariate correlations between cortical and subcortical atrophy and site-specific phosphorylation ratios in asymptomatic mutation carriers (n = 152) demonstrate an increases in pT205/T205 and pT217/T217, followed by t-tau, and less for pT181/T181. b, Bivariate correlations between cortical and subcortical brain metabolism, as measured by FDG-PET, and site-specific phosphorylation ratios in asymptomatic mutation carriers (n = 152) demonstrate an increase in pT205/T205 associated with a decrease in most cortical and subcortical regions, but not for the other p-tau sites or t-tau. P values for the correlations were calculated using chi-squared tests based on the bivariate LME models, with Benjamini–Hochberg correction for multiple comparisons.
Fig. 5 |
Fig. 5 |. In DIAD, elevated levels of tau phosphorylation decline in some sites with the onset of dementia, in contrast with a continued rise in t-tau.
ad, Individual estimated annualized rates of change of pT217/T217 (a), pT181/T181 (b), pT205/T205 (c) and t-tau (d), standardized for all mutation carriers, correlated with the annualized change in global cognitive function. The lines represent simple linear regression and the shaded areas represent 95% CIs. Each point is an individual-level correlation between measures, with Pearson’s r shown for all data. The linear regression was fit to those with no dementia (CDR = 0; black triangles; n = 49) and those with dementia (CDR > 0; red circles; n = 27). Declines in pT217/T217 (r = 0.711; P < 0.0001), pT181/T181 (r = 0.798; P < 0.0001) and pT205/T205 ( r = 0.219; P = 0.06) were associated with cognitive decline after symptom onset (red). For t-tau, there was an inverse correlation with cognition (r = −0.788; P < 0.0001). e, A linear fit for all mutation carriers demonstrates that there are distinct associations between declining cognition and changes in the different p-tau isoforms and t-tau: with decreases in pT217/T217 and pT181/T181, there is an increase in t-tau associated with cognitive decline, but no associations with pT205/T205 or pS202/S202. This suggests that soluble tau species are not equivalent in AD (pS202/S202 is shown here to demonstrate the lack of association with cognition (r = −0.09; P = 0.39). Statistical significance for all of the correlations was based on two-sided t-test.

Similar articles

Cited by

References

    1. Goedert M, Spillantini MG, Jakes R, Rutherford D & Crowther RA Multiple isoforms of human microtubule-associated protein tau: sequences and localization in neurofibrillary tangles of Alzheimer’s disease. Neuron 3, 519–526 (1989). - PubMed
    1. Grundke-Iqbal I et al. Abnormal phosphorylation of the microtubule-associated protein τ (tau) in Alzheimer cytoskeletal pathology. Proc. Natl Acad. Sci. USA 83, 4913–4917 (1986). - PMC - PubMed
    1. Kimura T, Sharma G, Ishiguro K &Hisanaga S Phospho-tau bar code: analysis of phosphoisotypes of tau and its application to tauopathy. Front. Neurosci 12, 44 (2018). - PMC - PubMed
    1. Crowther RA Straight and paired helical filaments in Alzheimer disease have a common structural unit. Proc. Natl Acad. Sci. USA 88, 2288–2292 (1991). - PMC - PubMed
    1. Fitzpatrick AWP et al. Cryo-EM structures of tau filaments from Alzheimer’s disease. Nature 547, 185–190 (2017). - PMC - PubMed

Publication types

MeSH terms