. 2020 Mar 26;5(6):e133267.
doi: 10.1172/jci.insight.133267.

Single cell transcriptomics identifies focal segmental glomerulosclerosis remission endothelial biomarker

Affiliations

Single cell transcriptomics identifies focal segmental glomerulosclerosis remission endothelial biomarker

Rajasree Menon et al. JCI Insight. .

Abstract

To define cellular mechanisms underlying kidney function and failure, the KPMP analyzes biopsy tissue in a multicenter research network to build cell-level process maps of the kidney. This study aimed to establish a single cell RNA sequencing strategy to use cell-level transcriptional profiles from kidney biopsies in KPMP to define molecular subtypes in glomerular diseases. Using multiple sources of adult human kidney reference tissue samples, 22,268 single cell profiles passed KPMP quality control parameters. Unbiased clustering resulted in 31 distinct cell clusters that were linked to kidney and immune cell types using specific cell markers. Focusing on endothelial cell phenotypes, in silico and in situ hybridization methods assigned 3 discrete endothelial cell clusters to distinct renal vascular beds. Transcripts defining glomerular endothelial cells (GEC) were evaluated in biopsies from patients with 10 different glomerular diseases in the NEPTUNE and European Renal cDNA Bank (ERCB) cohort studies. Highest GEC scores were observed in patients with focal segmental glomerulosclerosis (FSGS). Molecular endothelial signatures suggested 2 distinct FSGS patient subgroups with α-2 macroglobulin (A2M) as a key downstream mediator of the endothelial cell phenotype. Finally, glomerular A2M transcript levels associated with lower proteinuria remission rates, linking endothelial function with long-term outcome in FSGS.

Keywords: Bioinformatics; Cell Biology; Chronic kidney disease; Nephrology; endothelial cells.


Conflict of interest statement

Conflict of interest: MK serves on the advisory boards of JDRF, Astra-Zeneca, NovoNordisc, Eli Lilly, Gilead, Goldfinch Bio, Merck, Chan Zuckerberg Initiative, Janssen, Boehringer-Ingelheim, Elpidera, European Union Innovative Medicine Initiative. MK and WJ hold a patent Biomarkers for CKD progression (encompassing urinary EGF as biomarker of CKD progression). OT serves on the Scientific Advisory Boards of Caris Life Sciences and Goldfinch Bio; OT served on Scientific Advisory Boards, received grants or honoraria from UBC, Google, and Renaissance Technologies LLC. LM reports grant funding from Boehringer-Ingelheim and serves as an advisory board member for Reata Pharmaceuticals. WJ has received support for diabetic kidney disease–associated research from the Joint Institute for Translational and Clinical Research (PUUMA). CCB has received support for IgA nephropathy-associated research from the Joint Institute for Translational and Clinical Research (PUUMA). JBH reports grants from Astra-Zeneca, Gilead, and Moderna.

Figures

Figure 1
Figure 1. Analysis workflow showing the generation of adult kidney single cell clusters.
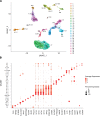
Combined processing of 24 samples including 16 tumor-nephrectomy, 5 surveillance, and 3 preperfusion biopsies using the scRNAseq protocol yielded 22,268 cells (4690 from surveillance biopsies; 14,744 from tumor-nephrectomies; and 2834 cells from preperfusion biopsies) and resulted in 31 distinct clusters. Seurat R package was used for the unsupervised clustering of the single cell data.
Figure 2
Figure 2. Analysis workflow showing the integration of single cell with bulk mRNAseq data.
The glomerular endothelial-specific transcripts identified from scRNAseq analyses were used to identify distinct subgroups within FSGS using mRNAseq profiles available from NEPTUNE.
Figure 3
Figure 3. Unsupervised clustering of cells derived from adult kidney tissue.
(A) UMAP plot from unsupervised clustering of 22,268 cells and number of cells in each of the 31 clusters. (B) Expression levels of the top differentially expressed gene from each cluster across all clusters. Differential gene expression analyses, to identify cell type specific genes, were performed using the nonparametric Wilcoxon rank sum test. The cell type–specific genes with FDR < 0.05 were considered as differentially expressed. UMAP, Uniform Manifold Approximation and Projection.
Figure 4
Figure 4. UMAP plot showing the distribution of the single cells from the 24 samples used in the study.
(A) UMAP plot showing the distribution of the cells in the 31 clusters resulted from the unsupervised clustering of the scRNAseq data from tumor-nephrectomy, surveillance, and preperfusion biopsies. (B) UMAP plot of the 14,744 cells from the 16 tumor-nephrectomy samples. (C) UMAP plot of the 4690 cells from the 5 surveillance transplant biopsy samples. (D) UMAP plot of the 2834 cells from the 3 preperfusion biopsy samples.
Figure 5
Figure 5. Cell type markers of clusters 19 and 30.
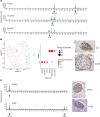
(A) Violin plots of PC and IC cell markers: FXYD4 expression in PC (cluster 27); SLC26A7 in ICA cells (cluster 18); SLC4A9 in ICB (cluster 17); and all 3 in transitional PC-IC cells (cluster 19). (B) tSNE plot of the 2 subclusters of cluster 30; dot plot of relative expression levels and HPA antibody staining of parietal endothelial cells (CRB2, CLDN1, and WT1 in subcluster 0) and LOH cell markers (SPP1, TACSTD2, and SLC128A1 in subcluster 1). (C) Violin plot shows the specific NPHS2 expression in cluster 2 (podocytes). HPA antibody staining of NPHS2 confirms its specific expression in podocytes. Violin plot of CRB2 expression shows that this gene is expressed in clusters 2 and 30. HPA antibody staining of CRB2 shows that it is expressed in podocytes and parietal epithelial cells. The HPA antibody stainings are from normal human kidneys, and figures indicate scale of 20 μm; additional details in Supplemental Figure 6). PC, principal cells; IC, intercalated; PEC, parietal epithelial cells; LOH, Loop of Henle; HPA, Human Protein Atlas.
Figure 6
Figure 6. Validation of cell cluster assignment.
(A) Heatmap of correlation between the average expression of genes in cell types identified in human developing kidney and adult kidney scRNASeq data (columns, developing kidney; rows, adult kidney). (B) Heatmap showing correlation between the average expression of genes in cell types identified in scRNAseq (rows) and snRNASeq (columns) analyses. Row-wise Z-score scaling of gene expression was used for heatmap visualization.
Figure 7
Figure 7. Endothelial cell types.
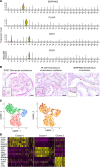
(A) Violin plots with cluster-specific expression of SERPINE2 in arteriolar endothelial cells (cluster 6), PLVAP in peritubular endothelial cells (cluster 7), and EHD3 in glomerular endothelial cells (cluster 8). (B) Validation using ISH for the specific expression of SOST, PLVAP, and SERPINE2 in glomerular endothelial, peritubular capillary endothelial, and arteriolar endothelial cells, respectively. SERPINE2 and SOST images have magnification of 400×. Scale bars: 20 μm. The PVLAP image has magnification of 200×. Scale bar: 50 μm. (C) UMAP plot showing the clusters from the integrated analysis of human and mouse endothelial cells. Unsupervised clustering using Seurat R package at a resolution of 0.1 resulted in 3 distinct clusters. Cells from both human and mouse scRNAseq data were found in the 3 clusters. (D) Heatmap of the top 5 markers for each of the 3 clusters from the integrated analysis of human and mouse endothelial cells. Differential gene expression analyses, to identify cell type–specific genes, were performed using the nonparametric Wilcoxon rank sum test. The cell type–specific genes that were differentially expressed with FDR < 0.05 were considered.
Figure 8
Figure 8. Analysis of glomerular endothelial marker genes.
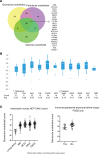
(A) Venn diagram intersect of endothelial-specific clusters from scRNAseq data highlighted 30 genes specific to all 3 endothelial clusters. (B and C) Glomerular endothelial cell (GEC) scores, derived based on 78 genes selective for glomerular endothelial cells (yellow), were calculated for patients and compared across the kidney disease spectrum in the European renal cDNA bank cohort (ERCB) (B) and the NEPTUNE cohort (C). GEC scores were elevated in disease groups compared with those of living donors. The GEC scores in FSGS patients with exposure to immunosuppressants prior to time of biopsy was substantially lower compared with those with no prior exposure. AAV, ANCA-associated vasculitis; DN, diabetic nephropathy; FSGS, focal segmental glomerulosclerosis; HTN, hypertensive nephropathy; IgAN, IgA nephropathy; MCD, minimal change disease; MN-MGN, membranous glomerulonephritis; SLE, systemic lupus erythematosus; TMD, thin basement membrane disease; LD, living donor; TNx, unaffected parts of tumor-nephrectomy.
Figure 9
Figure 9. Integrated analysis of scRNAseq and bulk mRNAseq data.
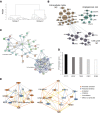
(A) Two distinct groups from the hierarchical clustering of the 78 glomerular endothelial cell defining mRNA transcripts in isolated glomeruli of FSGS biopsy samples from the NEPTUNE cohort. (B) Kidney-specific functional module gene interaction network (https://hb.flatironinstitute.org). The figure shows the 3 significant functional modules and their interactions. (C) Protein interaction network generated using STRING for the top 100 genes that were substantially overexpressed in group 2 versus group 1. (D) Top upstream regulators predicted by IPA. The bar plots show the activation scores predicted by IPA for the top 5 upstream regulators (P < 0.05 by Fisher’s exact test). (E) The regulatory interaction of the top 2 regulators, VEGF growth factor, and STAT1 show A2M as a downstream target. FSGS, focal segmental glomerulosclerosis.
Figure 10
Figure 10. α-2-Macroglobulin (A2M) expression.
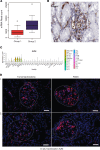
(A) Box plot showing average glomerular RNAseq read count of A2M transcripts in samples from the GEC group 1 and group 2. (B) Human Protein Atlas antibody staining of A2M in normal human kidney. Scale bar: 50 μm. (Supplemental Figure 6 contains specific information on HPA immunostaining of A2M). (C) Violin plot showing the cell type scRNAseq expression of A2M transcripts in adult human kidney. (D) In situ hybridization fluorescence images showing the glomerular signal of A2M probes in 2 unaffected parts of tumor-nephrectomy (left panel) and FSGS (right panel) kidney tissue sections. Glomeruli are encircled by thin white lines. The images are at 200× magnification. Scale bar: 50 μm.
Figure 11
Figure 11. A2M expression in FSGS.
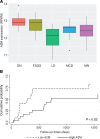
(A) Box plot showing the expression of A2M mRNA in different kidney diseases in ERCB cohort: DN, FSGS, MCD, MN, LD. (D) Kaplan-Meier curves by A2M mRNA expression levels at baseline biopsy for the first complete remission event in NEPTUNE FSGS patients. Two-sided Student’s t test showed that high A2M mRNA expression at the time of initial biopsy was associated with poor prognosis, as evidenced by the longer time to reach complete remission of proteinuria in NEPTUNE study participants (P < 0.02). DN, diabetic nephropathy; FSGS, focal segmental glomerulosclerosis; MCD, minimal change disease; MN, membranous nephropathy; and LD, living donor.

Similar articles

Cited by

References

    1. Devarajan P. Neutrophil gelatinase-associated lipocalin: a promising biomarker for human acute kidney injury. Biomark Med. 2010;4(2):265–280. doi: 10.2217/bmm.10.12. - DOI - PMC - PubMed
    1. Ju W, et al. Tissue transcriptome-driven identification of epidermal growth factor as a chronic kidney disease biomarker. Sci Transl Med. 2015;7(316):316ra193. doi: 10.1126/scitranslmed.aac7071. - DOI - PMC - PubMed
    1. Berthier CC, et al. Enhanced expression of Janus kinase-signal transducer and activator of transcription pathway members in human diabetic nephropathy. Diabetes. 2009;58(2):469–477. doi: 10.2337/db08-1328. - DOI - PMC - PubMed
    1. Tuttle KR, et al. JAK1/JAK2 inhibition by baricitinib in diabetic kidney disease: results from a Phase 2 randomized controlled clinical trial. Nephrol Dial Transplant. 2018;33(11):1950–1959. doi: 10.1093/ndt/gfx377. - DOI - PMC - PubMed
    1. Schröppel B, Huber S, Horster M, Schlöndorff D, Kretzler M. Analysis of mouse glomerular podocyte mRNA by single-cell reverse transcription-polymerase chain reaction. Kidney Int. 1998;53(1):119–124. doi: 10.1046/j.1523-1755.1998.00742.x. - DOI - PubMed

Publication types

MeSH terms