

Joint profiling of chromatin accessibility and CAR-T integration site analysis at population and single-cell levels
- PMID: 32094195
- PMCID: PMC7071901
- DOI: 10.1073/pnas.1919259117
Joint profiling of chromatin accessibility and CAR-T integration site analysis at population and single-cell levels
Abstract
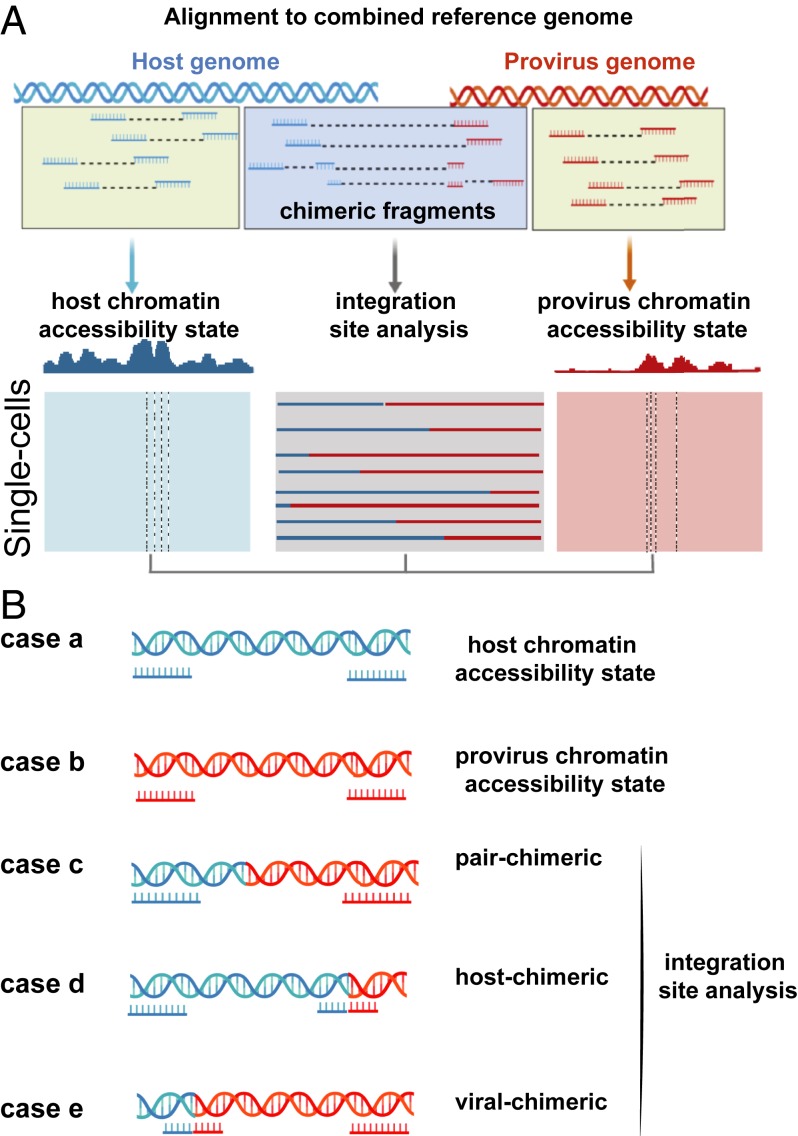
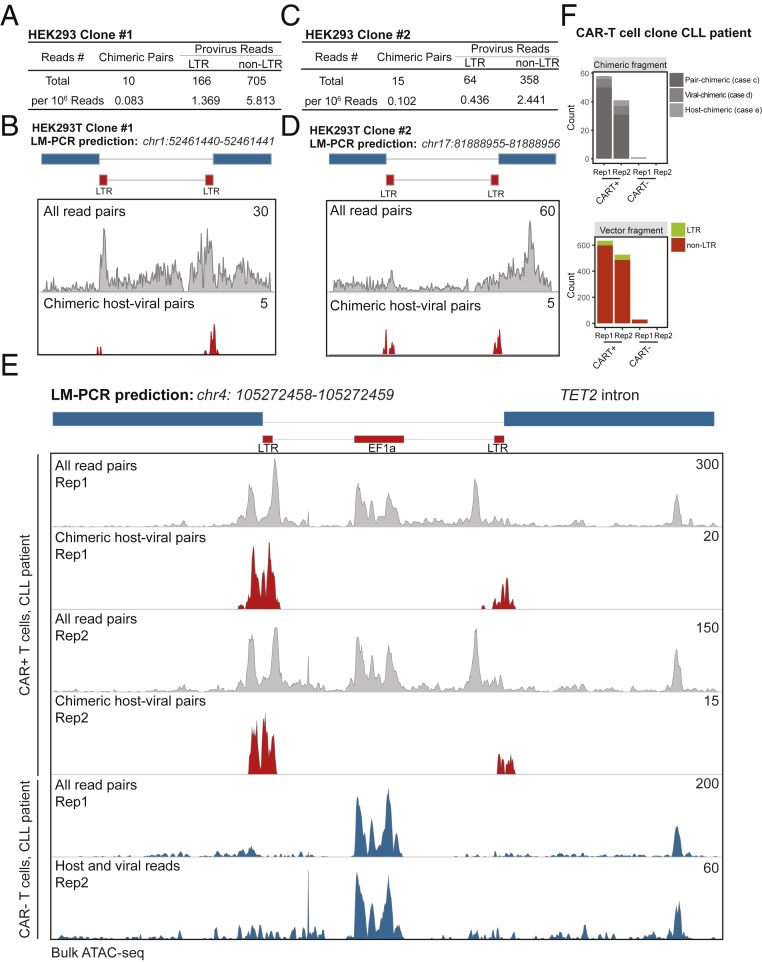
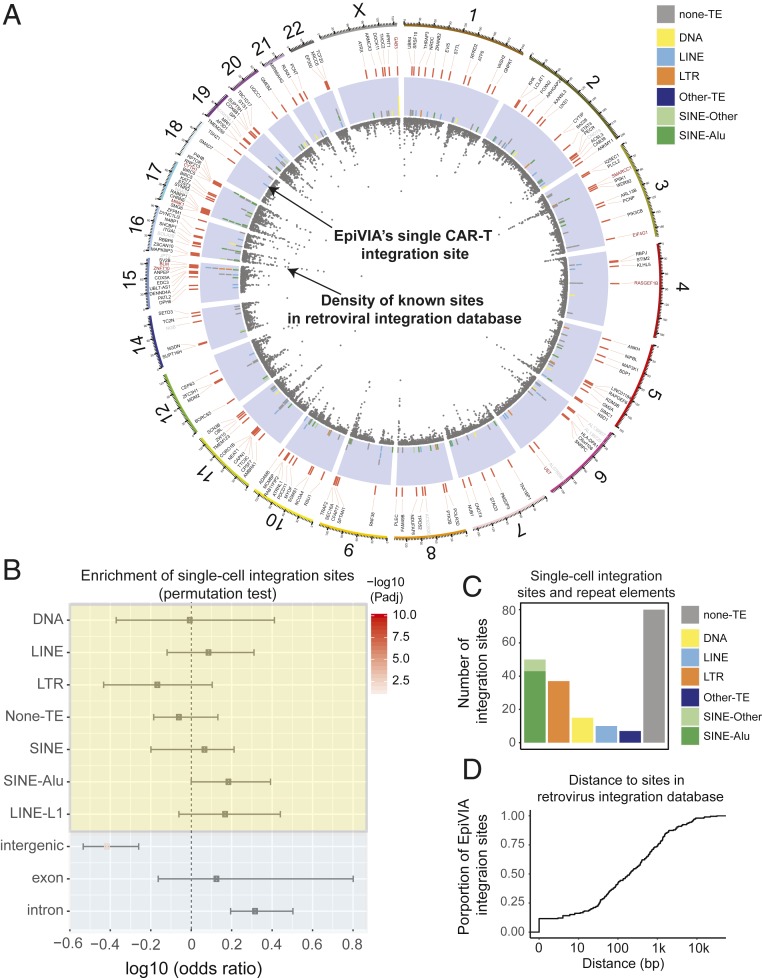
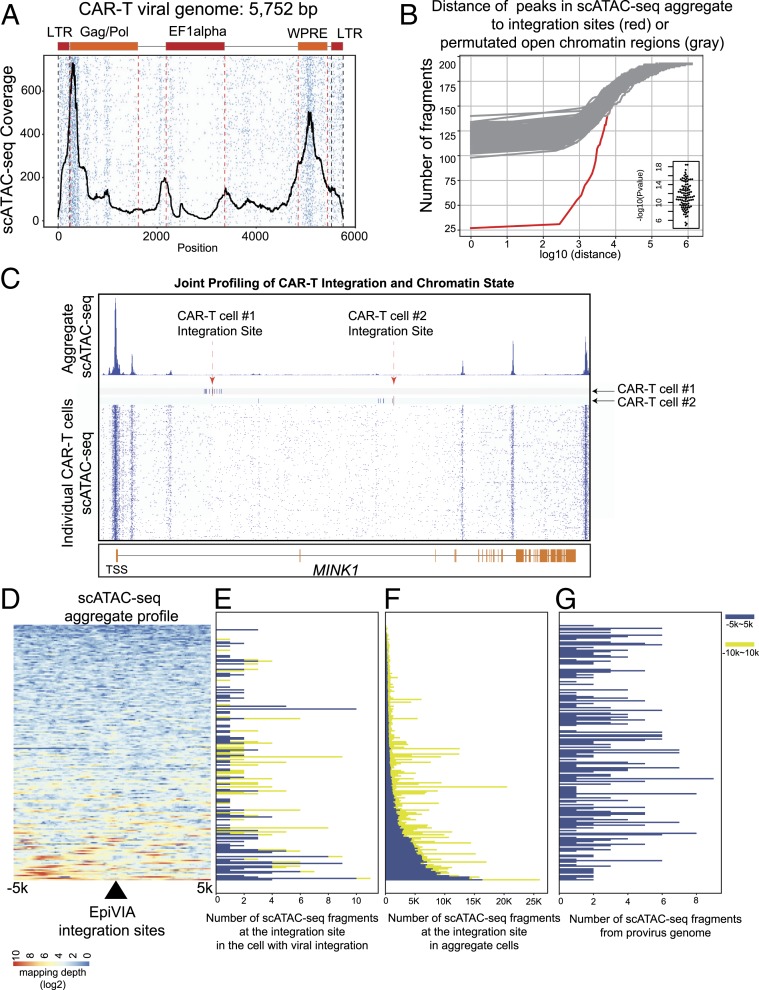
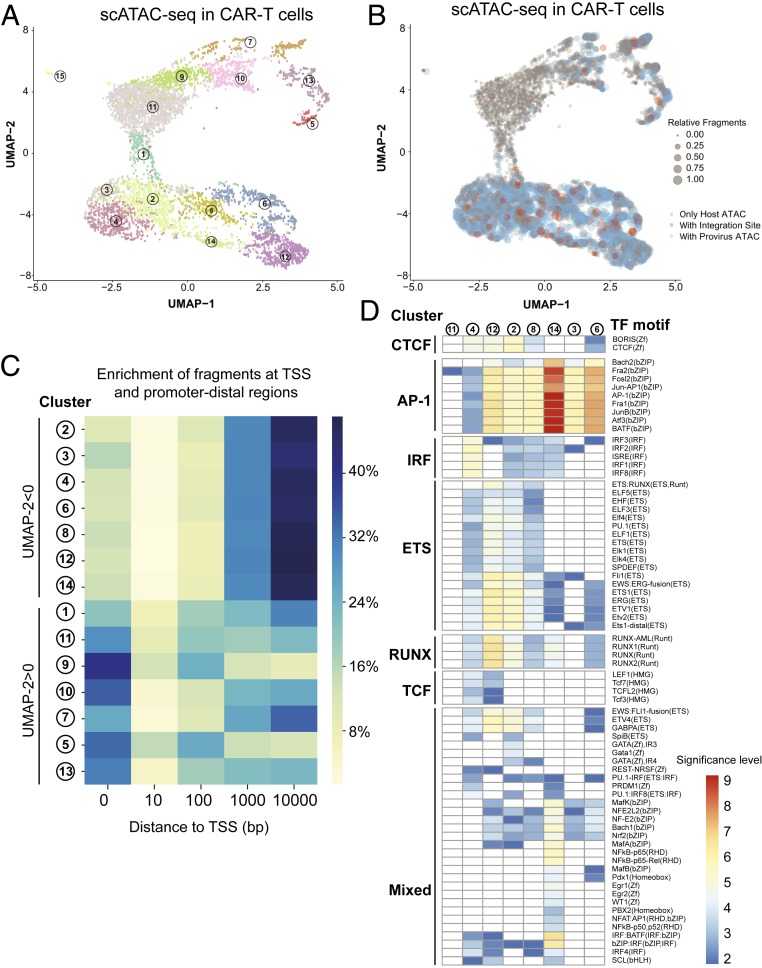
Chimeric antigen receptor (CAR)-T immunotherapy has yielded impressive results in several B cell malignancies, establishing itself as a powerful means to redirect the natural properties of T lymphocytes. In this strategy, the T cell genome is modified by the integration of lentiviral vectors encoding CAR that direct tumor cell killing. However, this therapeutic approach is often limited by the extent of CAR-T cell expansion in vivo. A major outstanding question is whether or not CAR-T integration itself enhances the proliferative competence of individual T cells by rewiring their regulatory landscape. To address this question, it is critical to define the identity of an individual CAR-T cell and simultaneously chart where the CAR-T vector integrates into the genome. Here, we report the development of a method called EpiVIA (https://github.com/VahediLab/epiVIA) for the joint profiling of the chromatin accessibility and lentiviral integration site analysis at the population and single-cell levels. We validate our technique in clonal cells with previously defined integration sites and further demonstrate the ability to measure lentiviral integration sites and chromatin accessibility of host and viral genomes at the single-cell resolution in CAR-T cells. We anticipate that EpiVIA will enable the single-cell deconstruction of gene regulation during CAR-T therapy, leading to the discovery of cellular factors associated with durable treatment.
Keywords: CAR-T cell; epigenetics; lentiviral integration site; single-cell genomics.
Copyright © 2020 the Author(s). Published by PNAS.
Conflict of interest statement
The authors declare no competing interest.
Figures
Similar articles
-
Genome-wide profiling of retroviral DNA integration and its effect on clinical pre-infusion CAR T-cell products.J Transl Med. 2022 Nov 8;20(1):514. doi: 10.1186/s12967-022-03729-5. J Transl Med. 2022. PMID: 36348415 Free PMC article.
-
A tandem CD19/CD20 CAR lentiviral vector drives on-target and off-target antigen modulation in leukemia cell lines.J Immunother Cancer. 2017 May 16;5:42. doi: 10.1186/s40425-017-0246-1. eCollection 2017. J Immunother Cancer. 2017. PMID: 28515942 Free PMC article.
-
Disruption of TET2 promotes the therapeutic efficacy of CD19-targeted T cells.Nature. 2018 Jun;558(7709):307-312. doi: 10.1038/s41586-018-0178-z. Epub 2018 May 30. Nature. 2018. PMID: 29849141 Free PMC article.
-
Production of CAR T-cells by GMP-grade lentiviral vectors: latest advances and future prospects.Crit Rev Clin Lab Sci. 2019 Sep;56(6):393-419. doi: 10.1080/10408363.2019.1633512. Epub 2019 Jul 17. Crit Rev Clin Lab Sci. 2019. PMID: 31314617 Review.
-
Challenges in HIV-1 Latent Reservoir and Target Cell Quantification in CAR-T Cell and Other Lentiviral Gene Modifying HIV Cure Strategies.Viruses. 2023 May 9;15(5):1126. doi: 10.3390/v15051126. Viruses. 2023. PMID: 37243212 Free PMC article. Review.
Cited by
-
Harnessing the Transcriptional Signatures of CAR-T-Cells and Leukemia/Lymphoma Using Single-Cell Sequencing Technologies.Int J Mol Sci. 2024 Feb 19;25(4):2416. doi: 10.3390/ijms25042416. Int J Mol Sci. 2024. PMID: 38397092 Free PMC article. Review.
-
The third-generation anti-CD30 CAR T-cells specifically homing to the tumor and mediating powerful antitumor activity.Sci Rep. 2022 Jun 21;12(1):10488. doi: 10.1038/s41598-022-14523-0. Sci Rep. 2022. PMID: 35729339 Free PMC article.
-
Advancing T cell-based cancer therapy with single-cell technologies.Nat Med. 2022 Sep;28(9):1761-1764. doi: 10.1038/s41591-022-01986-x. Nat Med. 2022. PMID: 36127419 No abstract available.
-
The Chimeric Antigen Receptor Detection Toolkit.Front Immunol. 2020 Aug 11;11:1770. doi: 10.3389/fimmu.2020.01770. eCollection 2020. Front Immunol. 2020. PMID: 32849635 Free PMC article. Review.
-
Relapse after CAR-T cell therapy in B-cell malignancies: challenges and future approaches.J Zhejiang Univ Sci B. 2022 Oct 15;23(10):793-811. doi: 10.1631/jzus.B2200256. J Zhejiang Univ Sci B. 2022. PMID: 36226535 Free PMC article. Review.
References
-
- Schröder A. R., et al. , HIV-1 integration in the human genome favors active genes and local hotspots. Cell 110, 521–529 (2002). - PubMed
-
- Schmidt M., et al. , High-resolution insertion-site analysis by linear amplification-mediated PCR (LAM-PCR). Nat. Methods 4, 1051–1057 (2007). - PubMed
-
- Mueller P. R., Wold B., In vivo footprinting of a muscle specific enhancer by ligation mediated PCR. Science 246, 780–786 (1989). - PubMed
Publication types
MeSH terms
Substances
Grants and funding
LinkOut - more resources
Full Text Sources
Other Literature Sources
Molecular Biology Databases
