. 2020 Feb 19;9(2):480.
doi: 10.3390/cells9020480.

Permanent Pro-Tumorigenic Shift in Adipose Tissue-Derived Mesenchymal Stromal Cells Induced by Breast Malignancy

Affiliations

Permanent Pro-Tumorigenic Shift in Adipose Tissue-Derived Mesenchymal Stromal Cells Induced by Breast Malignancy

Jana Plava et al. Cells. .

Abstract

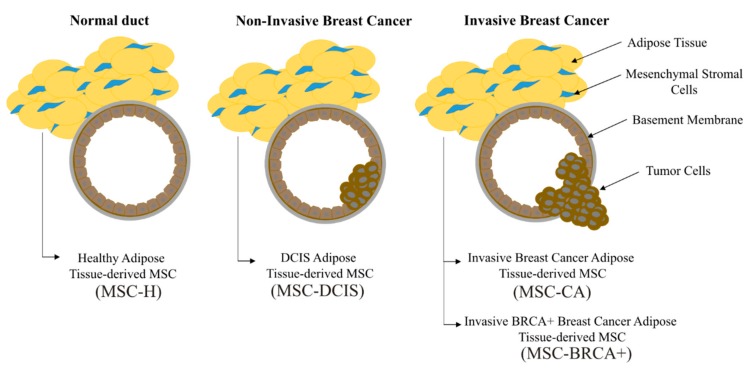
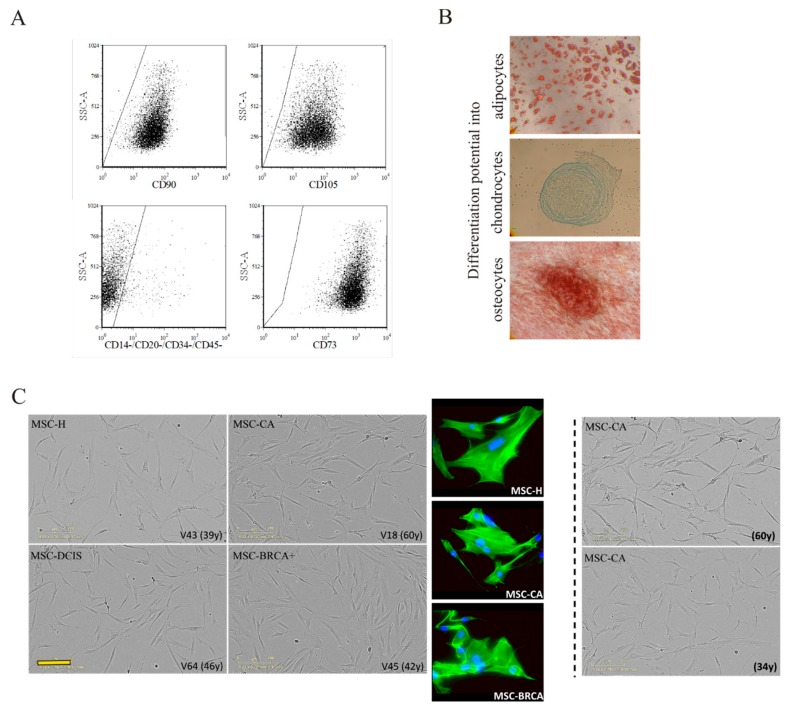
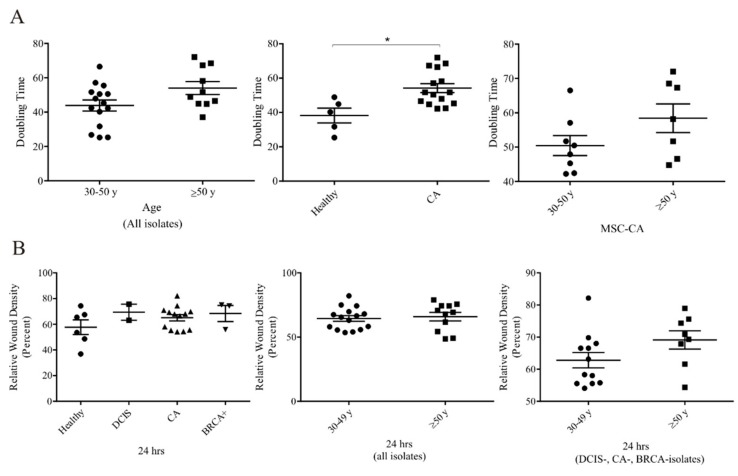
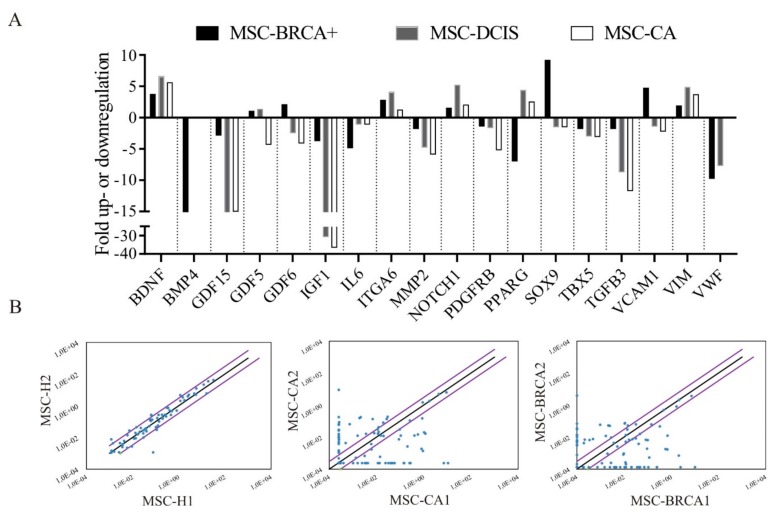
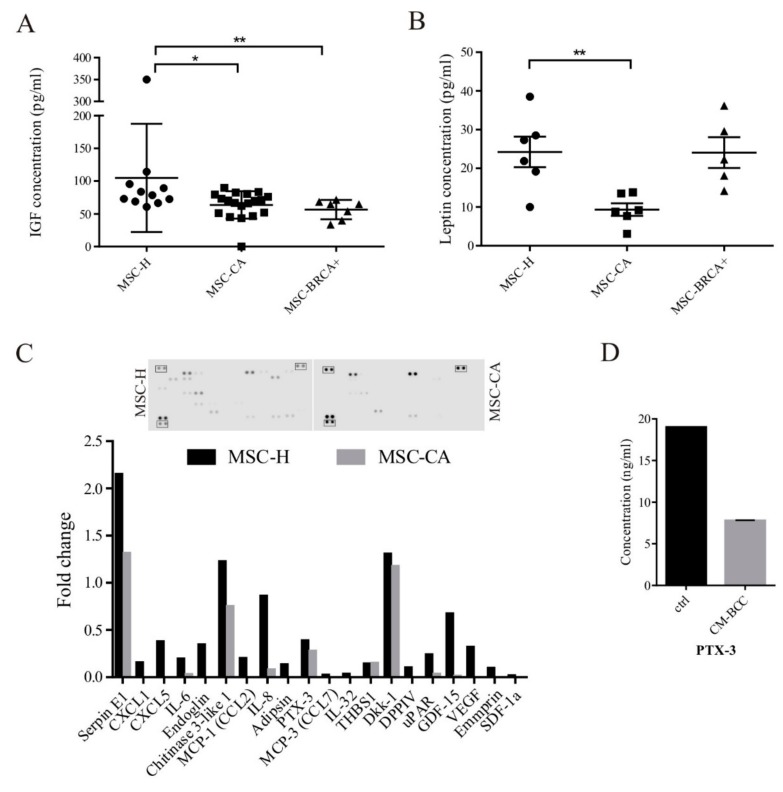
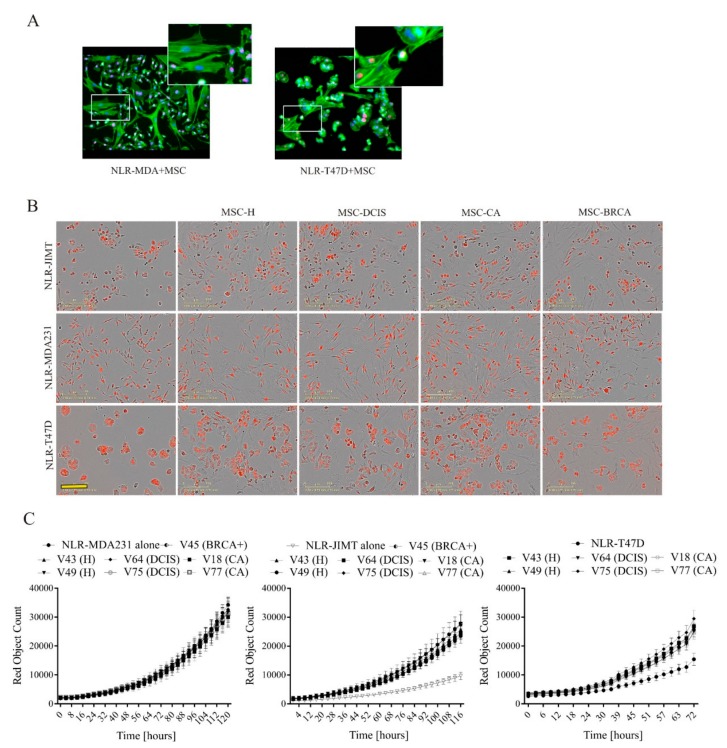
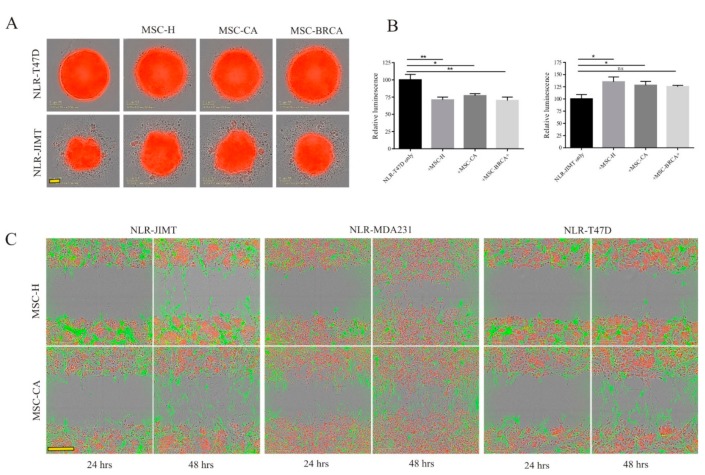
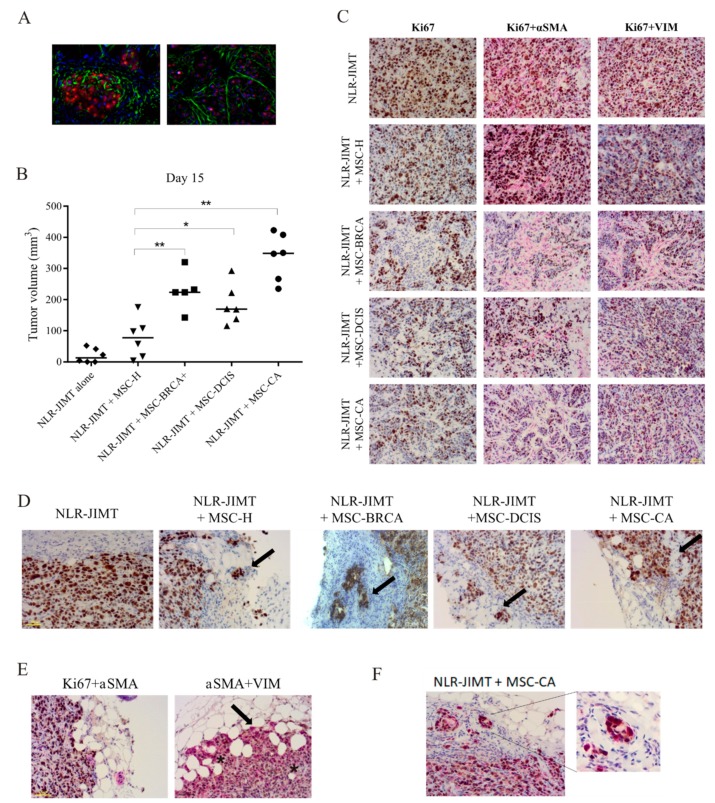
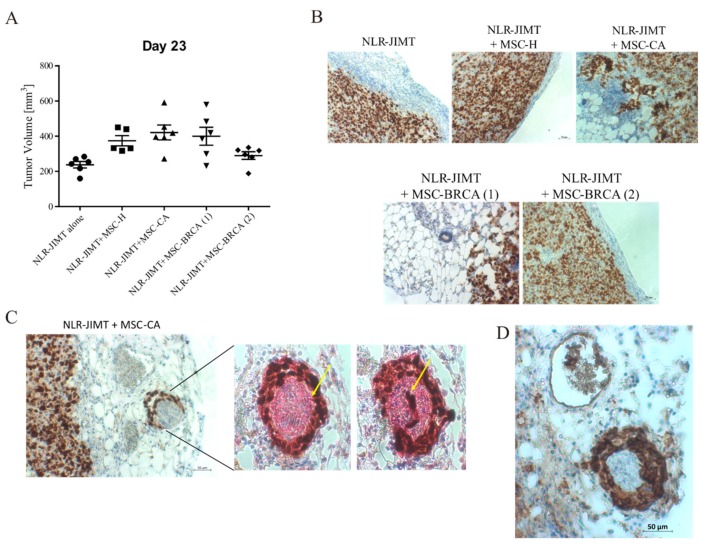
During cancer progression, breast tumor cells interact with adjacent adipose tissue, which has been shown to be engaged in cancer aggressiveness. However, the tumor-directed changes in adipose tissue-resident stromal cells affected by the tumor-stroma communication are still poorly understood. The acquired changes might remain in the tissue even after tumor removal and may contribute to tumor relapse. We investigated functional properties (migratory capacity, expression and secretion profile) of mesenchymal stromal cells isolated from healthy (n = 9) and tumor-distant breast adipose tissue (n = 32). Cancer patient-derived mesenchymal stromal cells (MSCs) (MSC-CA) exhibited a significantly disarranged secretion profile and proliferation potential. Co-culture with MDA-MB-231, T47D and JIMT-1, representing different subtypes of breast cancer, was used to analyze the effect of MSCs on proliferation, invasion and tumorigenicity. The MSC-CA enhanced tumorigenicity and altered xenograft composition in immunodeficient mice. Histological analysis revealed collective cell invasion with a specific invasive front of EMT-positive tumor cells as well as invasion of cancer cells to the nerve-surrounding space. This study identifies that adipose tissue-derived mesenchymal stromal cells are primed and permanently altered by tumor presence in breast tissue and have the potential to increase tumor cell invasive ability through the activation of epithelial-to-mesenchymal transition in tumor cells.

Keywords: adipose tissue; breast cancer; mesenchymal stromal cells; perineural invasion; tumor microenvironment.


Conflict of interest statement

The authors declare no conflict of interest.

Figures

Figure 1
Figure 1
Mesenchymal stromal cells (MSCs) were isolated from four breast adipose tissue origins; healthy donors (MSC-H), breast cancer patients with non-invasive (MSC-DCIS) or invasive tumors (MSC-CA), and BRCA+ breast cancer patients (MSC-BRCA+). In breast cancer patients, adipose tissue at a distance of 1.5-2 cm from the tumor was used.
Figure 2
Figure 2
(A) MSC-specific marker expression was analyzed by flow cytometry. MSCs expressed CD73, CD90 and CD105 on their surface, but lacked hematopoietic/endothelial marker expression. (B) MSC multipotency was analyzed by their differentiation potential into adipocytes, osteocytes, and chondrocytes. Magnification 100×. (C) MSC phenotype was documented by IncuCyte ZOOM™ kinetic imaging system and actin immunofluorescent staining (actin - green, DAPI - blue). The morphology of MSCs obtained from donors with different diagnosis (left) or age (right) did not differ over the analyzed period. Scale bar 200 µm. One representative picture from each group is shown.
Figure 3
Figure 3
Functional changes in cancer patient adipose tissue-derived MSCs (A) Left: MSC doubling-time in all MSC isolates had increasing tendency in older donors, but this tendency was not statistically significant. Middle: Based on the diagnosis of MSC donors, we observed significantly longer doubling-time in MSCs isolated from patients with invasive cancer compared to healthy MSCs (* p < 0.05; Mann-Whitney test). Right: The trend of increased doubling-time was present also in the MSC-CA group. (B) MSC migration potential analysis based on diagnosis (left), age in all MSC groups (middle) or age in solely cancer patients (right) showed no statistically significant differences. MSCs used for analysis did not exceed 10th passage.
Figure 4
Figure 4
Expression profiles of healthy and cancer patient adipose tissue-derived MSCs. (A) RT2 Profiler™ PCR human mesenchymal stem cells array of individual MSC isolates used in in vivo study revealed several gene expression changes. (B) Scatter plot of mesenchymal stem cell gene expression at the mRNA level comparing two different healthy (left), cancer (middle) and BRCA+ isolates (right). Lateral diagonal lines indicate a 2-fold increase or decrease. Results were obtained using the RT2 Profiler PCR Array Data Analysis software (at Qiagen data analysis web portal). MSCs used for analysis did not exceed 10th passage.
Figure 5
Figure 5
Secretion profile of cancer patient adipose tissue-derived MSCs is halted by tumor cell-secreted factors. (A) Decreased expression of IGF1 correlated with decreased IGF1 concentration detected in MSC-CA cell media (* p < 0.05; ** p < 0.01; Mann–Whitney test). (B) Leptin concentration in MSC-CA was also lower compared to MSC-H. The IGF1 and leptin concentration was measured by ELISA test in MSC medium after 48 h of culture (* p < 0.05; ** p < 0.01; Mann–Whitney test). (C) Cytokine analysis revealed a decreased release of cytokines and chemokines in MSC-CA isolate. The relative change in analyte level between MSC groups was determined by subtraction of each pair of capture antibody from the reference spot signal on the corresponding membrane. (D) The PTX3 concentration was decreased in healthy MSCs cultured for 2 weeks in NLR-MDA231 conditioned media. The concentration of PTX3 was measured by ELISA test in MSC medium after 48 h. MSCs used for analysis did not exceed 10th passage.
Figure 6
Figure 6
MSC–tumor cell interactions in 2D in vitro conditions. (A) Thin plasma membrane structures are formed between cancer cells and MSCs in co-culture allowing cell-to-cell communication and signaling. Magnification 200×. Cytoplasmic actin was stained green, nuclei were stained with DAPI (blue). The nuclei of tumor cells also expressed red fluorescent protein, therefore they appear as magenta colored. (B) MSC co-culture with tumor cells expressing red fluorescent nuclear protein resulted in more mesenchymal-like cell morphology of co-cultured NLR-T47D and NLR-JIMT cells. Scale bar: 200 µm. (C) Direct 7-day co-culture of NLR-JIMT and NLR-T47D breast cancer cells with MSCs of different origins highlighted the supportive role of MSCs in tumor cell proliferation, but no diagnosis-specific effects on proliferation were observed. NLR-MDA231 proliferation was not enhanced by the presence of MSCs.
Figure 7
Figure 7
Faster invading cancer patient-derived MSCs are followed by more rapidly invading tumor cells. (A) Monoculture vs. co-culture in 3D non-adherent culture conditions showed less compact NLR-T47D-MSC spheroids and bigger NLR-JIMT-MSC spheroids, but no difference between MSC isolates was observed. Scale bar: 100 µm. Breast cancer cells—red color, MSCs—unstained. (B) Luminometric measurement of spheroid cultures after 7 days revealed significantly lower ATP amount in NLR-T47D-MSC co-culture and higher ATP amount in NLR-JIMT-MSC co-culture (* p < 0.05; ** p < 0.01; Mann–Whitney test). In the control group (only breast cancer cells without MSC), 8 samples were analyzed. In each group with MSC, 4 spheroids were analyzed. (C) MSC-CA exhibited increased invasion potential in Scratch wound invasion assay after 24 or 48 h. The invasion of tumor cells was also increased in co-culture with MSC-CA compared to MSC-H (1 × 10⁴ MSCs + 2 × 10⁴ NLR-MDA231/NLR-T47D and 1.5 × 10⁴ MSCs + 3 × 10⁴ NLR-JIMT were seeded on Matrigel coated 96-well plates and covered with 50% Matrigel). Scale bar: 200 µm. MSCs used for analysis did not exceed 10th passage. MSCs were stained with Vybrant™ CFDA SE Cell Tracer Kit (green color), breast cancer cell lines expressed red fluorescent protein.
Figure 8
Figure 8
Cancer patient adipose tissue-derived MSCs showed a pro-tumorigenic effect on subcutaneous tumor xenografts in vivo. (A) Actin immunofluorescence staining of mice xenograft cryosection shows xenograft composition formed by tumor cells and MSCs (left—xenograft periphery, right—xenograft center; red—cancer cell nuclei, green—actin cytoplasm staining, blue - nuclei staining with DAPI. Magnification 630×.) (B) 5 × 10⁵ MSCs of different origin were subcutaneously co-injected with 1 × 10⁶ NLR-JIMT cells in immuno-compromised SCID/Beige mice. Tumor volume examination on Day 15 revealed profound supportive effect of MSCs on tumor growth in the co-injected xenografts. Xenografts composed solely of tumor cells failed to induce significant tumor volume in the analyzed period. Tumor volume was calculated by formula: volume = (length × width2)/2 (* p < 0.05, ** p < 0.01, Man-Whitney test). The significantly most supportive effect was observed in mice injected with NLR-JIMT + MSC-CA. (C) Detection of Ki67, αSMA and VIM markers by immuno-histochemistry in tumor tissue sections. Mice were sacrificed when the tumor xenograft reached 1 cm3. Xenografts were fixed with formaldehyde, embedded in paraffin and processed for immuno-histochemical staining with monoclonal antibodies. Representative images of tumors formed by NLR-JIMT co-injected with cancer patient-derived MSCs (BRCA+, DCIS, CA) showed lower Ki67 positivity in the tumor center than in NLR-JIMT co-injected with healthy donor-derived MSC-H. The αSMA and Vimentin (VIM) staining showed that mainly the MSC-CA and MSC-BRCA+ attempted to form aligned pathway-like structures around the tumor cells. Magnification 200×. (D) Representative Ki67-stained pictures of xenograft periphery showed clusters of tumor cells invading surrounding stroma in tumors formed by NLR-JIMT co-injected with MSCs (MSC-H, -DCIS, -BRCA) and collective cell migration with a distinguishable invasive front was observed in the group co-injected with MSC-CA. (E) Immuno-histochemical staining of αSMA and Vimentin revealed up-regulation in tumor cells located in the invasive front of the xenografts co-injected with MSC-CA. This suggests the epithelial-to-mesenchymal transition of tumor cells. Asterisks identify smaller adipocytes with dilated inter-cellular spaces near the tumor invasive front. (F) Detail of the xenograft periphery showing Vimentin positivity in tumor cells.
Figure 9
Figure 9
Pro-tumorigenic effect of MSC-CA in orthotopic mouse model. (A) Mixture of 5 × 10⁵ NLR-JIMT cells and 2.5 × 10⁵ MSCs in 100 μL serum-free DMEM diluted 1:1 with ECM gel (Sigma-Aldrich) was injected bilaterally into mammary fat pad of SCID/Beige mice. The animals were divided into five groups according to the type of injected MSC: control group of NLR-JIMT alone (n = 6), MSC-H (n = 6), MSC-CA (n = 6), MSC-BRCA (2) (n = 6) obtained from breast tissue where prophylactic mastectomy was performed and MSC-BRCA (1) (n = 6) from contralateral breast of the same patient with confirmed relapsed invasive ductal carcinoma. Tumor volume was calculated according to the formula: volume = (length × width2)/2. The animals were sacrificed when the tumor volume exceeded 1 cm3. The most supportive effect was observed in mice injected with NLR-JIMT + MSC-CA and MSC-BRCA (1). (B) Ki67 staining of xenograft periphery showed collective cell invasion in the group co-injected with MSC-CA. This manner of invasion was also observed in the MSC-BRCA (1), but was lacking in the MSC-BRCA (2) co-injected group. While both MSC-BRCA isolates come from the same patient, the former were isolated from a breast with relapsed ductal carcinoma and the later from a contralateral healthy breast where prophylactic mastectomy was performed. MSCs derived from breast adipose tissue with confirmed presence of tumor (MSC-BRCA (1)) increased the invasion of tumor cells in xenograft periphery. (C) Nerve fibers were detected in serial sections of NLR-JIMT + MSC-CA orthotopic xenografts using IHC staining with specific neuronal marker PGP9.5. The perineural and intraneural tumor cell invasion (yellow arrow pointing at invading single tumor cell in the left picture and group of tumor cells in the right picture) was present only in the MSC-CA group. (D) CK7 antibody (breast cancer marker) staining confirmed the presence of tumor cells in the perineural space and also inside the blood vessel.

Similar articles

Cited by

References

    1. Jena M.K., Janjanam J. Role of extracellular matrix in breast cancer development: A brief update. F1000Research. 2018;7:274. doi: 10.12688/f1000research.14133.2. - DOI - PMC - PubMed
    1. Cozzo A.J., Fuller A.M., Makowski L. Contribution of Adipose Tissue to Development of Cancer. Compr. Physiol. 2017;8:237–282. - PMC - PubMed
    1. Martins D., Schmitt F. Microenvironment in breast tumorigenesis: Friend or foe? Histol. Histopathol. 2018;34:18021. - PubMed
    1. Kidd S., Spaeth E., Watson K., Burks J., Lu H., Klopp A., Andreeff M., Marini F.C. Origins of the tumor microenvironment: Quantitative assessment of adipose-derived and bone marrow-derived stroma. PLoS ONE. 2012;7:e30563. doi: 10.1371/journal.pone.0030563. - DOI - PMC - PubMed
    1. Turley S.J., Cremasco V., Astarita J.L. Immunological hallmarks of stromal cells in the tumour microenvironment. Nat. Rev. Immunol. 2015;15:669–682. doi: 10.1038/nri3902. - DOI - PubMed

Publication types