Review
. 2021 May;599(10):2673-2697.
doi: 10.1113/JP279024. Epub 2020 Mar 13.

Structure and function of the calcium-selective TRP channel TRPV6

Affiliations
Review

Structure and function of the calcium-selective TRP channel TRPV6

Maria V Yelshanskaya et al. J Physiol. 2021 May.

Abstract

Epithelial calcium channel TRPV6 is a member of the vanilloid subfamily of TRP channels that is permeable to cations and highly selective to Ca2+ ; it shows constitutive activity regulated negatively by Ca2+ and positively by phosphoinositol and cholesterol lipids. In this review, we describe the molecular structure of TRPV6 and discuss how its structural elements define its unique functional properties. High Ca2+ selectivity of TRPV6 originates from the narrow selectivity filter, where Ca2+ ions are directly coordinated by a ring of anionic aspartate side chains. Divalent cations Ca2+ and Ba2+ permeate TRPV6 pore according to the knock-off mechanism, while tight binding of Gd3+ to the aspartate ring blocks the channel and prevents Na+ from permeating the pore. The iris-like channel opening is accompanied by an α-to-π helical transition in the pore-lining transmembrane helix S6. As a result of this transition, the intracellular halves of the S6 helices bend and rotate by about 100 deg, exposing different residues to the channel pore in the open and closed states. Channel opening is also associated with changes in occupancy of the transmembrane domain lipid binding sites. The inhibitor 2-aminoethoxydiphenyl borate (2-APB) binds to TRPV6 in a pocket formed by the cytoplasmic half of the S1-S4 transmembrane helical bundle and shifts open-closed channel equilibrium towards the closed state by outcompeting lipids critical for activation. Ca2+ inhibits TRPV6 via binding to calmodulin (CaM), which mediates Ca2+ -dependent inactivation. The TRPV6-CaM complex exhibits 1:1 stoichiometry; one TRPV6 tetramer binds both CaM lobes, which adopt a distinct head-to-tail arrangement. The CaM C-terminal lobe plugs the channel through a unique cation-π interaction by inserting the side chain of lysine K115 into a tetra-tryptophan cage at the ion channel pore intracellular entrance. Recent studies of TRPV6 structure and function described in this review advance our understanding of the role of this channel in physiology and pathophysiology and inform new therapeutic design.

Keywords: TRP channels; X-ray crystallography; calcium; cryo-EM; gating; ion channels; lipids; structure.


Conflict of interest statement

Additional information

Competing interests

The authors declare no competing interests.

Figures

Figure 1.
Figure 1.. Role in epithelial Ca2+ transport and functional properties of TRPV6.
a, TRPV6 mediates the absorption of Ca2+ from the intestine as a component of the transcellular epithelial Ca2+ transport. Following entry from the intestinal lumen into the epithelial cell through TRPV6, Ca2+ bound to calbindin diffuses to the basolateral membrane, where it is extruded to the interstitial space adjacent to the blood vessel by means of ATP-dependent Ca2+-ATPase PMCA1 and Na2+/Ca2+ exchanger NCX1. b, TRPV6 expression in the rat duodenum. Shown is a bright-field micrograph of a cryosection hybridized to a digoxigenin-labeled TRPV6 antisense cRNA probe (M, muscle layer; V, villi; C, crypt; L, lumen). TRPV6 is expressed in enterocytes lining the villi, with the highest mRNA concentrations at the villi tips. Originally published in (Peng et al., 1999). c-d, Functional characterization of hTRPV6 using ratiometric fluorescence measurements. c, Fluorescence curves recorded from HEK 293 cells expressing hTRPV6 in response to the application of Ca2+ (arrow) at different concentrations. d, Ca2+ dose-response curve for the maximal value of fluorescence fitted with the logistic equation. Calculated IC50 is the mean ± SEM (n = 3). e, Whole-cell patch-clamp recording from HEK 293 cells expressing wild type hTRPV6. Shown is a leak-subtracted current in response to the voltage ramp protocol illustrated above the recording. Adapted from (McGoldrick et al., 2018).
Figure 2.
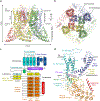
Figure 2.. Architecture and domain organization of TRPV6.
a-b, Side (a) and top (b) views of the human TRPV6 tetramer (PDB ID: 6BO8), with each subunit shown in different color. c, Domain organization diagram of the TRPV6 subunit. d, A single human TRPV6 subunit, with domains colored similarly to c. The diagram in (c) and the overall design are adapted from (Saotome et al., 2016).
Figure 3.
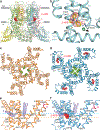
Figure 3.. Cation binding sites in the TRPV6 pore.
a-b, Central slice (a) and top (b) views of crystal structure of rat TRPV6 (PDB ID: 5IWK) in surface representation, colored by electrostatic potential, with blue being positively charged, red negatively charged, and white neutral. c-h, Side (c,e,g) and top (d,f,h) views of the TRPV6 pore (the channel portion indicated by green dashed rectangles in a-b), with residues important for cation binding shown in stick representation. Front and back subunits in c, e and g are removed for clarity. Green, blue and pink mesh shows anomalous difference electron density for Ca2+ (c-d, 38–4.59 Å, 2.7σ; PDB ID: 5IWP), Ba2+ (e-f, 38–4.59 Å, 3.5σ; PDB ID: 5IWR) and Gd3+ (g-h, 38–4.59 Å, 7σ; PDB ID: 5IWT) and ions are shown as spheres of the corresponding color. Purple mesh shows simulated-annealing FO-FC electron density maps contoured at 4σ for Ca2+ (50–3.65 Å), 3σ for Ba2+ (50–3.85 Å) and 3.5σ for Gd3+ (50–3.80 Å). Adapted from (Saotome et al., 2016).
Figure 4.
Figure 4.. Knock-off mechanism of Ca2+ permeation.
a, Side view of rat TRPV6 (PDB ID: 5IWK) pore, with front and back subunits removed for clarity. Residues that surround or contribute to cation binding sites are shown as sticks, and Ca2+ ions at Sites 1, 2 and 3 are shown as green spheres. The interatomic distances illustrated by dashed lines suggest that Ca2+ is directly coordinated by D541 side chains at Site 1, while a hydrated Ca2+ ion indirectly interacts with the pore at Sites 2 and 3. b-f, Molecular dynamics simulation of calcium permeation through the selectivity filter. b-d, Sequential representative positions of Ca2+ ions in its initial (b, #1), transition (c, #2) and final (d, #3) configurations. Blue, magenta and mustard colored spheres represent an incoming, intermediate and leaving Ca2+ ions, respectively. Residues D541, T538, and M569 are shown in stick representation. e, Positions of ions along the z-axis. The positions #1, #2 and #3 correspond to the configurations of ions shown in b, c and d, respectively. f, Spaces occupied by each of the three calcium ions throughout the entire simulation, shown as mesh surfaces colored similarly to ions in b-d. Adapted from (Saotome et al., 2016) (a) and (Sakipov et al., 2018) (b-f).
Figure 5.
Figure 5.. Putative lipid densities.
a-b, Side (a) and top (b) views of hTRPV6 tetramer (PDB ID: 6BO8), with each subunit (A-D) shown in different color. Putative lipid densities are illustrated by purple mesh and numbered. c, Expanded view of the putative lipid densities per hTRPV6 subunit. Adapted from (McGoldrick et al., 2018).
Figure 6.
Figure 6.. Ion channel pore in the closed, open and inactivated states.
a-c, Ion conduction pathway (grey) in the closed (a, hTRPV6-R470E; PDB ID: 6BOA; blue), open (b, hTRPV6; PDB ID: 6BO8; orange) and inactivated (c, hTRPV6-CaM; PDB ID: 6E2F; green) states, with residues lining the selectivity filter and around the gate shown as sticks. Only two of four subunits are shown, with the front and back subunits removed for clarity. The segment of S6 that undergoes the α-to-π helical transition is highlighted in pink. d-f, Intracellular view of the S6 bundle crossing in the closed (d), open (e) and inactivated (f) states, with the surface shown in the corresponding color. g-i, Close-up view on putative lipid densities 1 and 2 shown as a purple mesh in the closed (g), open (h) and inactivated (i) states. Residues involved in TRPV6 gating and regulation are shown as sticks. Black dashed lines indicate bonds between residues D489 and T581 as well as Q473 and R589; blue, orange and green horizontal dashed lines indicate the lowest (most intracellular) levels reached by density 2 in the closed, open and inactivated states, respectively. Adapted from (McGoldrick et al., 2018).
Figure 7.
Figure 7.. Inhibition of TRPV6 by 2-APB.
a, Side view of rat TRPV6* crystal structure in complex with 2-APB (PDB ID: 6D7O). The molecules of 2-APB are shown as red space-filling models. Four TRPV6* subunits are colored pink, cyan, green and yellow. b, Close-up view of the 2-APB binding site with 2-APB (yellow) and surrounding residues shown as sticks. Red mesh shows positive electron density for 2-APB in the FO-FC omit map contoured at 3σ. Green mesh indicated by the arrow shows electron density for the brominated derivative of 2-APB (2-APB-Br; PDB ID: 6D7V) in the anomalous difference Fourier map contoured at 3σ. c-d, Intracellular view of the transmembrane domain in the cryo-EM structures of hTRPV6-Y467A (c, PDB ID: 6D7S) and hTRPV6-Y467A2-APB (d, PDB ID: 6D7T). Residues forming the narrowest part of the pore in the gate region, I575 in hTRPV6-Y467A (c) and M578 in hTRPV6-Y467A2-APB (d), are shown as space-filling models (green). Molecules of 2-APB are shown as sticks (red). e-f, Close-up views of the transmembrane domain of a single subunit in the cryo-EM structures of hTRPV6-Y467A (e) and hTRPV6-Y467A2-APB (f) viewed parallel to the membrane. The molecule of 2-APB is shown as a space-filling model (red). Purple mesh shows lipid densities 1 and 2. Black dashed lines indicate bonds between residues D489 and T581 as well as Q473 and R589; horizontal dashed lines indicate the lowest (most intracellular) levels reached by density 2 in the presence (blue) and absence (orange) of 2-APB. The segment of S6 that undergoes the α-to-π helical transition is highlighted in pink. Adapted from (Singh et al., 2018c).
Figure 8.
Figure 8.. Structure of TRPV6-CaM complex.
a-c, Side (a, c), and bottom (b) views of hTRPV6-CaM (PDB ID: 6E2F) with hTRPV6 subunits (A-D) colored cyan, green, yellow and pink and CaM colored purple. Calcium ions are shown as green spheres. In (c) only two of four subunits are shown, with the front and back subunits being removed for clarity. Side chains of TRPV6 residues W583 and CaM residue K115 are shown as sticks. d, Expanded view of CaM bound to the proximal and distal portions of the TRPV6 C-terminus. Side chains of CaM residues coordinating calcium ions and of K115 are shown as sticks. e, Stereo view of the intracellular entrance to the channel pore where lysine K115 of CaM forms a unique cation-π interaction with tetratryptophan cage assembled of W583, one from each TRPV6 subunit. Adapted from (Singh et al., 2018b).
Figure 9.
Figure 9.. Gating-associated conformational changes.
a-c, Superposition of the full-size hTRPV6 (a), its selectivity filter (b) and lower pore (c) regions in the closed (cyan, hTRPV6-R470E, PDB ID: 6BOA), open (orange, hTRPV6, PDB ID: 6BO8) and inactivated (green, hTRPV6-CaM, PDB ID: 6E2F) states, viewed parallel to membrane. Only two (A and C) of four subunits are shown, with the back (B) and front (D) subunits removed for clarity. Residues lining the selectivity filter, around the gate and lysine K155 of CaM are shown as sticks. Note, the overall shape of the tetramer is very similar in the three states (a-b), while the strongest conformational changes are localized in the lower pore region (c). d, Pore radius calculated for the three states, with the dashed line indicating 1.4 Å (radius of a water molecule). Adapted from (Singh et al., 2018b).
Figure 10.
Figure 10.. Mechanisms of TRPV6 gating and regulation.
Cartoons represent TRPV6 in the closed, open, inactivated and 2-APB-inhibited closed states. Transition from the closed to open state, stabilized by the formation of salt bridges (dashed lines), leads to permeation of ions (green spheres) and is accompanied by a local α-to-π helical transition in S6 that maintains the selectivity filter conformation, while the lower part of S6 bends by ~11° and rotates by ~100°. These movements result in a different set of residues lining the pore around the channel gate. When 2-APB binds at the base of the S1-S4 bundle, it displaces the putative lipid 1 (purple) and promotes formation of the hydrophobic cluster (blue). Formation of the cluster displaces the putative activating lipid 2 (pink) and breaks hydrogen bonds (dashed lines), which stabilize the open state by energetically compensating the unfavorable α-to-π helical transition in S6. As S6 turns α-helical, the channel closes and its pore becomes impermeable to ions. The transition from the open to the inactivated state involves tilting of the lower portions of the S6 helices towards the center of the pore at the alanine A566 gating hinge and closure of the pore. The loss of the R589-Q473 salt bridges, which stabilize the α-to-π helical transition in S6 in the open state, is compensated by a cation-π interaction between K115 and the π-system of four tryptophans W583 forming a cage at the pore intracellular entrance.

Similar articles

Cited by

References

    1. Almers W, and McCleskey EW (1984). Non-selective conductance in calcium channels of frog muscle: calcium selectivity in a single-file pore. J Physiol 353, 585–608. - PMC - PubMed
    1. Autzen HE, Myasnikov AG, Campbell MG, Asarnow D, Julius D, and Cheng Y (2018). Structure of the human TRPM4 ion channel in a lipid nanodisc. Science 359, 228–232. - PMC - PubMed
    1. Balesaria S, Sangha S, and Walters JR (2009). Human duodenum responses to vitamin D metabolites of TRPV6 and other genes involved in calcium absorption. Am J Physiol Gastrointest Liver Physiol 297, G1193–1197. - PMC - PubMed
    1. Barbato G, Ikura M, Kay LE, Pastor RW, and Bax A (1992). Backbone dynamics of calmodulin studied by 15N relaxation using inverse detected two-dimensional NMR spectroscopy: the central helix is flexible. Biochemistry 31, 5269–5278. - PubMed
    1. Bate N, Caves RE, Skinner SP, Goult BT, Basran J, Mitcheson JS, and Vuister GW (2018). A Novel Mechanism for Calmodulin-Dependent Inactivation of Transient Receptor Potential Vanilloid 6. Biochemistry 57, 2611–2622. - PubMed

Publication types