. 2020 Feb 10;11(1):806.
doi: 10.1038/s41467-020-14586-5.

Temporal dynamics of protein complex formation and dissociation during human cytomegalovirus infection

Affiliations

Temporal dynamics of protein complex formation and dissociation during human cytomegalovirus infection

Yutaka Hashimoto et al. Nat Commun. .

Abstract

The co-evolution and co-existence of viral pathogens with their hosts for millions of years is reflected in dynamic virus-host protein-protein interactions (PPIs) that are intrinsic to the spread of infections. Here, we investigate the system-wide dynamics of protein complexes throughout infection with the herpesvirus, human cytomegalovirus (HCMV). Integrating thermal shift assays and mass spectrometry quantification with virology and microscopy, we monitor the temporal formation and dissociation of hundreds of functional protein complexes and the dynamics of host-host, virus-host, and virus-virus PPIs. We establish pro-viral roles for cellular protein complexes and translocating proteins. We show the HCMV receptor integrin beta 1 dissociates from extracellular matrix proteins, becoming internalized with CD63, which is necessary for virus production. Moreover, this approach facilitates characterization of essential viral proteins, such as pUL52. This study of temporal protein complex dynamics provides insights into mechanisms of HCMV infection and a resource for biological and therapeutic studies.


Conflict of interest statement

The authors declare no competing interests.

Figures
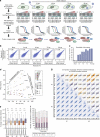
Fig. 1
Fig. 1. MS-CETSA workflow for uncovering the association and dissociation of protein complexes and virus–host protein interactions during HCMV infection.
a MS-CETSA workflow for sample collection, TMT labeling, and data analysis during HCMV infection. b Correlation between replicates (Pearson’s r-value) at each infection time point, calculated as loge transformed protein abundances that were estimated from the sum of the peptide reporter ion intensities for peptides shared across time points for the indicated proteins. c Number of quantified viral proteins in each replicate. d PCA plot of all protein abundances showing the separation of TMT channels (temperature) and HCMV time points. Protein abundance was calculated as the sum of all peptide reporter ion intensities for each protein. Data from each replicate is indicated by the shape of the marker. e Comparison of average Euclidean distances between protein complexes from the CORUM database or random selections of proteins. A Mann–Whitney U-test was performed, ***p-value < 0.001. f The number of identified protein complexes documented by the CORUM database with different z-score thresholds (1, 1.5, and 2). z-score describes the number of standard deviations of the CORUM complex proteins from the mean of the randomly selected proteins. High z-scores represent high Ex and low-average Euclidean distance, which indicates closer melting curves of the complex components. g Scatter plot matrix comparing the average Euclidean distances of protein complexes documented by CORUM between samples from both replicates. Each dot in the lower triangle represents the derivative of average Euclidean distance of one protein complex (Ex). Pearson’s r-values are shown for each pair of samples in the top triangle.
Fig. 2
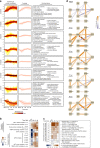
Fig. 2. Temporal changes in functional protein complexes point to the stabilization of translation and PI3K signaling pathway complexes during HCMV infection.
a (Left) Euclidean distance-based z-score plots shift from mock after infection for CORUM protein complexes. The corresponding z-score represents the number of standard deviations between the average Ex and the mean of the fitted Gaussian distribution. Protein complexes are clustered by Fuzzy c-means and membership scores are depicted by the color of lines. Membership score represents how close to the center of the cluster a given complex is. Higher membership scores (dark red line) indicate how close the given protein complex is to the average of its corresponding cluster, while lower membership scores indicate larger deviation of the complex from this average. (Middle) Average z-score plot for each cluster (solid line) ±SD (shaded region). (Right) GO terms enriched in each cluster. b Heat map of z-scores for translation-related CORUM protein complexes. c Heat map of z-scores for CORUM protein complexes regulating transmembrane receptor protein tyrosine kinase signaling. d Network plots of the proteins in the PI3K pathway throughout infection. Edge width and color represent transformed Euclidean distance between nodes and the corresponding z-score derived from TPCA, respectively.
Fig. 3
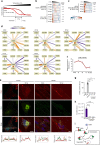
Fig. 3. HCMV infection enhances the stability of the CCC-WASH protein complex that is needed for virus production.
a Heat map of z-scores for the CCC-WASH complex at each infection time point. b Network plot of proteins involved in CCC-WASH complexes in mock and infected (72 hpi) cells. Edge width and color indicate transformed Euclidean distance between nodes and their z-score, respectively. Low z-score suggests a weak association (lines with blue tones), while a high z-score suggests a stronger association (lines with orange tones) between proteins. c Validation of the stabilization of the CCC-WASH complex by IP-PRM analysis. FLAG-tagged WASHC2C IPs were performed in mock and infected (72 hpi) cells, and the normalized protein abundances were determined by PRM for C16orf62, CCDC93, and CCDC22. Data are mean ± SEM (n = 2). d PRM validation of WASHC2C siRNA-mediated knockdown. Data are mean ± SD (n = 2). e TUNEL assay for cells transfected with siRNAs targeting WASHC2C or siControl, n ≥ 6, ***p-value < 0.001. f Viral titers from cells transfected with siRNAs targeting WASHC2C or a non-targeting siRNA control. Data are mean ± SEM and a two-sided Student’s t-test was performed, n = 4 biological replicates, ****p-value < 0.0001. g Western blot showing viral protein levels for each of the three temporal classes for siWASHC2C cells or siControl cells. Source data are provided as a Source Data file. h Proposed model for the enhanced association between the CCC complex and the WASH complex during HCMV infection. HCMV infection promotes the stabilization of the CCC complex and the gain of interaction between the CCC and WASH complexes on the endosome membrane to support the intracellular transport of cargos.
Fig. 4
Fig. 4. Integrin beta 1 (ITGB1) develops an association and is internalized with the pro-viral tetraspanin protein CD63.
a Schematic view of how absolute ΔTm is calculated. The inflection point of each aggregation curve is defined as the Tm. The absolute value of the difference in Tm difference between an infection time point and mock is the absolute ΔTm. b Enrichment analyses of gene sets related to HCMV infection based on |ΔTm|. Gene sets known to be regulated by HCMV infection were acquired from MsigDB. Proteins in these gene sets were divided evenly into seven bins by |ΔTm|, and their |ΔTm| values were subjected to enrichment analysis using information theory. c Enrichment analysis of the ECM_RECEPTOR_INTERACTION gene set from the KEGG database. d Network plots of the integrin β1 related protein complex constructed from CORUM database during infection. Changes in interactions are shown over the course of HCMV infection. e Immunofluorescence analysis of ITGB1 and CD63 in uninfected (mock) and infected cells (96 hpi) in control and siRNA-mediated knockdown of CD63 (siCD63) cells. Fluorescence intensities for ITGB1 and CD63 across the sections are plotted below. Scale bar 10 μm, n = 9 cells. f Average fluorescence intensity within a ROI ± SD for ITGB1 during infection, mock and 24 hpi, n = 13; 48 hpi, n = 10; 72 hpi, n = 11; 96 hpi, n = 9. g TUNEL assay for cells transfected with siRNAs targeting CD63 or siControl, n = 6, **p-value < 0.001  h Viral titers ± SEM for siCD63 cells or siControl cells, n = 4, ****p-value < 0.0001. i Proposed model for ITGB1 sequestration by CD63 at the plasma membrane. Upon HCMV infection, CD63 mediates ITGB1 internalization, which leads to ITGB1 degradation.
Fig. 5
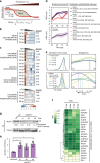
Fig. 5. HCMV infection induces variability in proteins involved in fatty acid metabolism, including the antiviral factor ACAT1.
a Schematic of how TED is calculated. The aggregation curves of one protein at mock and the indicated infection time (i) are plotted, and the area between the two curves is TED(t). TED(t) = TTpt,Tpmock,T2). b Enrichment analysis based on TED of the ECM_RECEPTOR_INTERACTION gene set from the KEGG database. c Heat maps of enrichment analysis using TED for Hallmark oxidative phosphorylation and other mitochondrial related gene sets (Mootha and Wong). Enrichment analysis for the Hallmark oxidative phosphorylation gene set using ΔTm is shown below for comparison. d NES score graphs for metabolism-related KEGG pathways. Metabolic pathways that show the highest NES shifts between late and immediate-early stages of infection were selected. The individual NES scores for each pathway (top) and the averaged NES scores (bottom) are displayed. Shading in the bottom plot delineates SD. e The distribution of derived Euclidean distances (Ex) for all proteins and for the fatty acid metabolism pathway. Kernel density estimation plot of Ex for all proteins (top) and proteins involved in FATTY ACID METABOLISM (from KEGG pathway) (bottom) are shown with enlarged snapshots of the peak area (right). f Hierarchical clustering of proteins in the fatty acid metabolism pathway by Ward’s method. Heat map color indicates TED values. g Western blot confirmation of siRNA-mediated ACAT1 knockdown with three siRNA constructs. Tubulin was used as the loading control, and the normalized ACAT1 intensities based on densitometry are shown below the ACAT1 blot. Source data are provided as a Source Data file. h Viral titers ± SEM from cells transfected with ACAT1 siRNAs or control siRNA, n = 3, *p-value < 0.05.
Fig. 6
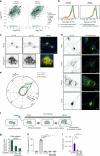
Fig. 6. IGF2R is redistributed during infection and is needed for effective viral replication.
a Scatterplots of Tm values for all proteins in mock and infected conditions. Dark dots represent translocated proteins predicted by Jean Beltran et al., and the dots in circles represent translocated proteins with substantial changes in Tm. b Distribution of the derivative of TED for non-translocating proteins, all translocating proteins, and translocating proteins excluding ribosomal proteins at 24 and 96 hpi. Translocating proteins are predicted from Jean Beltran et al. p-values calculated by a Mann–Whitney U-test on the distribution of TED values between non-translocating proteins and translocating proteins excluding ribosomal proteins are 3.76e-22 and 3.20e-21 for 24 and 96 hpi, respectively. c Immunofluorescence images of IGF2R and pUL99 at 96 hpi indicating co-localization at the viral assembly complex. Scale bar, 10 μm. d Immunofluorescence images of IGF2R at mock, 24, 48, and 72 hpi. Scale bar, 10 μm. e Polar plot of IGF2R fluorescence at mock and 24 hpi. Data are average fluorescence intensity ± SD (mock, n = 9; 24 hpi, n = 8). f Schematic of IGF2R dynamic redistribution throughout HCMV infection. IGF2R is localized next to the nucleus in uninfected cells. Upon infection, IGF2R puncta are dissipated around the nucleus, and large vesicles begin to form as infection progresses, resulting in IGF2R accumulation at the assembly complex late in infection. g PRM confirmation of IGF2R knockouts in CRISPR control and IGF2R-knockout MRC5 cells. Data represent average normalized protein abundance ± SD (n = 2). h TUNEL assay for IGF2R CRISPR knockout cells and CRISPR control cells, n = 6, ***p-value < 0.001. i Viral titers ± SEM from IGF2R CRISPR knockout cells and CRISPR control cells, a two-sided Student’s t-test was performed, n = 4 biological replicates, **p-value < 0.01.
Fig. 7
Fig. 7. Viral proteins from different virion compartments display distinct temporal protein properties during infection.
a Distribution curves of Tm values for cellular proteins and viral proteins. b Distribution curves of molecular weights for cellular and viral proteins. c Linear correlation between log molecular weight and average Tm of cellular proteins (left) and viral proteins (right). Spearman’s ρ and p-values are shown. d Heat map of Ex and Tm values for all quantified viral proteins clustered by their compartment within the virion. Colors represent Ex or Tm values of the corresponding protein (see scale). Missing values in gray indicate a lack of quantification or inability to calculate Tm due to lack of a sigmoidal curve. Asterisks indicate p-values < 0.05 based on the distribution of Ex of indicated time pairs.
Fig. 8
Fig. 8. Thermal profiling points to virus–virus and virus–host protein interactions, including the association of the essential HCMV pUL52 with immunomodulatory host proteins.
a Distance matrix of Ex for pairs of quantified viral proteins. Color indicates Ex value for the corresponding protein pair. Clusters #1 and 2 highlight potential viral complexes. b Coaggregation curves of IE1 and IE2 (left), MCP, SCP, and RIR1 (left middle), proteins in cluster #1 (right middle) and proteins in cluster #2 (right) at 96 hpi. Known and literature-suggested complex components are indicated in red. c, d Coaggregation curves of c pUL38- TSC1-TSC2 and d pUL52-IFIT1- IFIT2 at each infection time point. pUL52 was not detected at mock and 24 hpi. Statistical analysis of curve similarities is shown with p-values (corrected with Benjamini-Hochberg procedure generated using random protein pair sampling). e IP-PRM analysis validating the complex composed of pUL52, IFIT1, and IFIT2. An anti-IFIT1 IP or a control IgG IP was conducted at 48 and 96 hpi and abundances of pUL52, IFIT1, and IFIT2 were quantified by PRM. Data represent average normalized abundance ± SD, n = 1 for 48 hpi, and n = 2 for 96 hpi.
Fig. 9
Fig. 9. Thermal shift assays uncover temporal alterations in host–host and virus–host protein associations during HCMV infection.
At early stages of HCMV infection, the PI3K pathway is stabilized as the PI3K signaling axis is activated. Also early in infection, ITGB1, a receptor for HCMV, is internalized with the pro-viral tetraspanin CD63. As infection progresses, CD63 localizes to the viral assembly complex. Our study also uncovers a pro-viral role for the translocating protein IGF2R, whose localization changes from diffuse around the nucleus at early stages of HCMV infection to an accumulation at the viral assembly complex during virion maturation. Additionally, the endosomal transport complexes WASH and CCC display increased association late in infection, suggesting a pro-viral role via regulation of intracellular trafficking during viral assembly and egress. Finally, our study uncovers an association between the essential viral protein pUL52 and the host immune response proteins IFIT1 and IFIT2 at late stages of HCMV replication.

Similar articles

Cited by

References

    1. Goodrum F, Caviness K, Zagallo P. Human cytomegalovirus persistence. Cell. Microbiol. 2012;14:644–655. doi: 10.1111/j.1462-5822.2012.01774.x. - DOI - PMC - PubMed
    1. Freeman RB. The ‘indirect’ effects of cytomegalovirus infection. Am. J. Transpl. 2009;9:2453–2458. doi: 10.1111/j.1600-6143.2009.02824.x. - DOI - PubMed
    1. Rawlinson WD, et al. Congenital cytomegalovirus infection in pregnancy and the neonate: consensus recommendations for prevention, diagnosis, and therapy. Lancet Infect. Dis. 2017;17:e177–e188. doi: 10.1016/S1473-3099(17)30143-3. - DOI - PubMed
    1. Stern-Ginossar N, et al. Decoding human cytomegalovirus. Science. 2012;338:1088–1093. doi: 10.1126/science.1227919. - DOI - PMC - PubMed
    1. Tandon R, Mocarski ES. Viral and host control of cytomegalovirus maturation. Trends Microbiol. 2012;20:392–401. doi: 10.1016/j.tim.2012.04.008. - DOI - PMC - PubMed

Publication types

MeSH terms