

Machine learning analysis plans for randomised controlled trials: detecting treatment effect heterogeneity with strict control of type I error
- PMID: 32041653
- PMCID: PMC7011561
- DOI: 10.1186/s13063-020-4076-y
Machine learning analysis plans for randomised controlled trials: detecting treatment effect heterogeneity with strict control of type I error
Abstract
Background: Retrospective exploratory analyses of randomised controlled trials (RCTs) seeking to identify treatment effect heterogeneity (TEH) are prone to bias and false positives. Yet the desire to learn all we can from exhaustive data measurements on trial participants motivates the inclusion of such analyses within RCTs. Moreover, widespread advances in machine learning (ML) methods hold potential to utilise such data to identify subjects exhibiting heterogeneous treatment response.
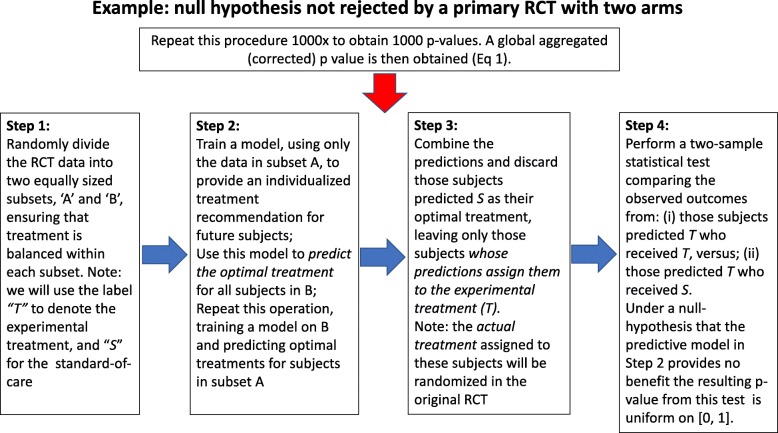
Methods: We present a novel analysis strategy for detecting TEH in randomised data using ML methods, whilst ensuring proper control of the false positive discovery rate. Our approach uses random data partitioning with statistical or ML-based prediction on held-out data. This method can test for both crossover TEH (switch in optimal treatment) and non-crossover TEH (systematic variation in benefit across patients). The former is done via a two-sample hypothesis test measuring overall predictive performance. The latter is done via 'stacking' the ML predictors alongside a classical statistical model to formally test the added benefit of the ML algorithm. An adaptation of recent statistical theory allows for the construction of a valid aggregate p value. This testing strategy is independent of the choice of ML method.
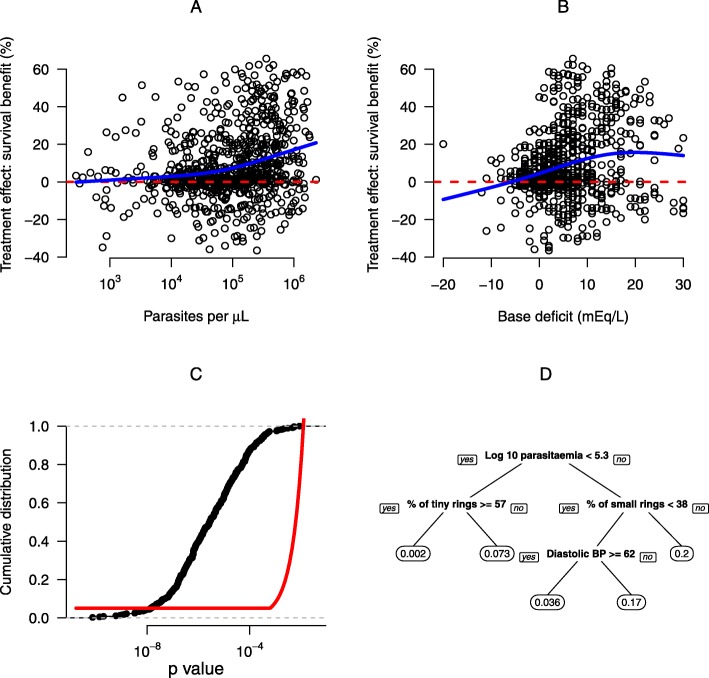
Results: We demonstrate our approach with a re-analysis of the SEAQUAMAT trial, which compared quinine to artesunate for the treatment of severe malaria in Asian adults. We find no evidence for any subgroup who would benefit from a change in treatment from the current standard of care, artesunate, but strong evidence for significant TEH within the artesunate treatment group. In particular, we find that artesunate provides a differential benefit to patients with high numbers of circulating ring stage parasites.
Conclusions: ML analysis plans using computational notebooks (documents linked to a programming language that capture the model parameter settings, data processing choices, and evaluation criteria) along with version control can improve the robustness and transparency of RCT exploratory analyses. A data-partitioning algorithm allows researchers to apply the latest ML techniques safe in the knowledge that any declared associations are statistically significant at a user-defined level.
Keywords: Heterogeneous treatment effects; Machine learning; Randomised trials; Subgroup statistical analysis plan.
Conflict of interest statement
The authors declare that they have no competing interests.
Figures
Similar articles
-
Intravenous artesunate for severe malaria.Prescrire Int. 2008 Aug;17(96):168-70. Prescrire Int. 2008. PMID: 19492495
-
Artemether for severe malaria.Cochrane Database Syst Rev. 2019 Jun 18;6(6):CD010678. doi: 10.1002/14651858.CD010678.pub3. Cochrane Database Syst Rev. 2019. PMID: 31210357 Free PMC article.
-
Artesunate versus quinine for treating severe malaria.Cochrane Database Syst Rev. 2007 Oct 17;(4):CD005967. doi: 10.1002/14651858.CD005967.pub2. Cochrane Database Syst Rev. 2007. Update in: Cochrane Database Syst Rev. 2011 Mar 16;(3):CD005967. doi: 10.1002/14651858.CD005967.pub3. PMID: 17943870 Updated. Review.
-
Artesunate, artemether or quinine in severe Plasmodium falciparum malaria?Expert Rev Anti Infect Ther. 2007 Apr;5(2):199-204. doi: 10.1586/14787210.5.2.199. Expert Rev Anti Infect Ther. 2007. PMID: 17402835 Review.
-
Comparison of oral artesunate and quinine plus tetracycline in acute uncomplicated falciparum malaria.Bull World Health Organ. 1994;72(2):233-8. Bull World Health Organ. 1994. PMID: 8205643 Free PMC article. Clinical Trial.
Cited by
-
LANDMark: an ensemble approach to the supervised selection of biomarkers in high-throughput sequencing data.BMC Bioinformatics. 2022 Mar 31;23(1):110. doi: 10.1186/s12859-022-04631-z. BMC Bioinformatics. 2022. PMID: 35361114 Free PMC article.
-
Predictive Modeling Identifies Total Bleeds at 12-Weeks Postswitch to N8-GP Prophylaxis as a Predictor of Treatment Response.Thromb Haemost. 2022 Jun;122(6):913-925. doi: 10.1055/s-0041-1739514. Epub 2021 Dec 5. Thromb Haemost. 2022. PMID: 34865209 Free PMC article.
-
The role of machine learning in clinical research: transforming the future of evidence generation.Trials. 2021 Aug 16;22(1):537. doi: 10.1186/s13063-021-05489-x. Trials. 2021. PMID: 34399832 Free PMC article. Review.
-
Extreme Consumers of Health Care: Patterns of Care Utilization in Patients with Multiple Chronic Conditions Admitted to a Novel Integrated Clinic.J Multidiscip Healthc. 2019 Dec 24;12:1075-1083. doi: 10.2147/JMDH.S214770. eCollection 2019. J Multidiscip Healthc. 2019. PMID: 31920324 Free PMC article.
-
A Machine-Learning Approach for Estimating Subgroup- and Individual-Level Treatment Effects: An Illustration Using the 65 Trial.Med Decis Making. 2022 Oct;42(7):923-936. doi: 10.1177/0272989X221100717. Epub 2022 May 24. Med Decis Making. 2022. PMID: 35607982 Free PMC article.
References
-
- Brown D. The press-release conviction of a biotech CEO and its impact on scientific research. Wash Post. 2013. https://www.washingtonpost.com/national/health-science/the-press-release....
-
- Breiman L. Statistical modeling: the two cultures (with comments and a rejoinder by the author) Stat Sci. 2001;16(3):199–231. doi: 10.1214/ss/1009213726. - DOI
-
- Murphy S. J R Stat Soc Ser B (Stat Methodol). 2003; 65(2):331–55.
MeSH terms
Substances
Grants and funding
LinkOut - more resources
Full Text Sources
