. 2020 Feb 25;117(8):4169-4179.
doi: 10.1073/pnas.1911629117. Epub 2020 Feb 6.

Actin reduction by MsrB2 is a key component of the cytokinetic abscission checkpoint and prevents tetraploidy

Affiliations

Actin reduction by MsrB2 is a key component of the cytokinetic abscission checkpoint and prevents tetraploidy

Jian Bai et al. Proc Natl Acad Sci U S A. .

Abstract

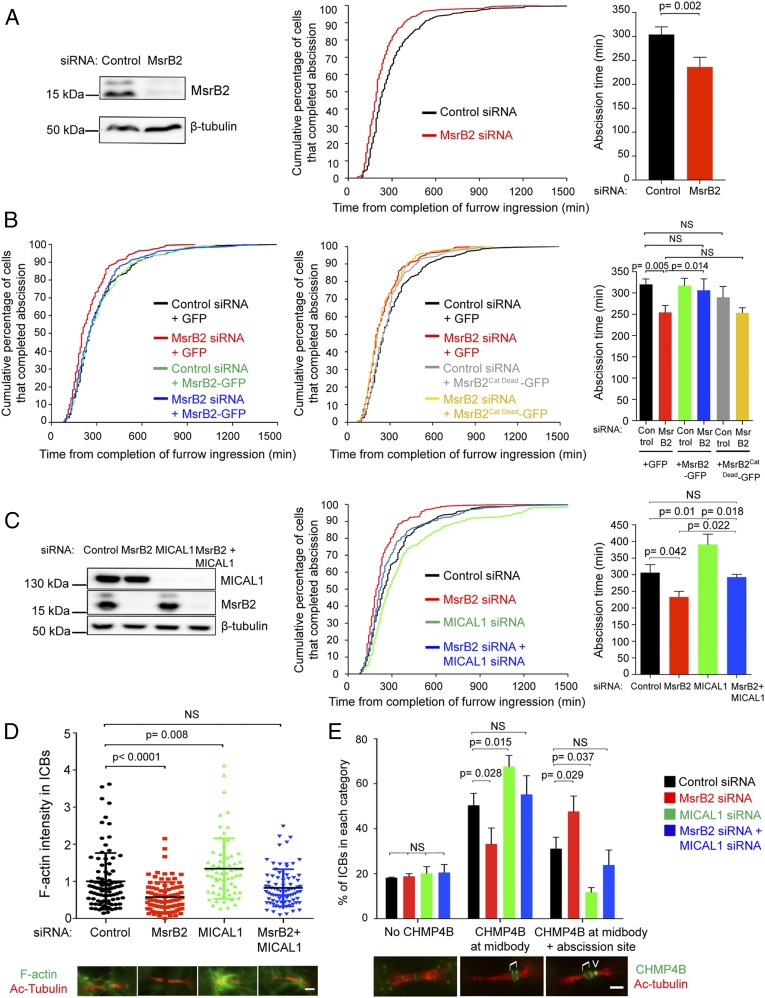
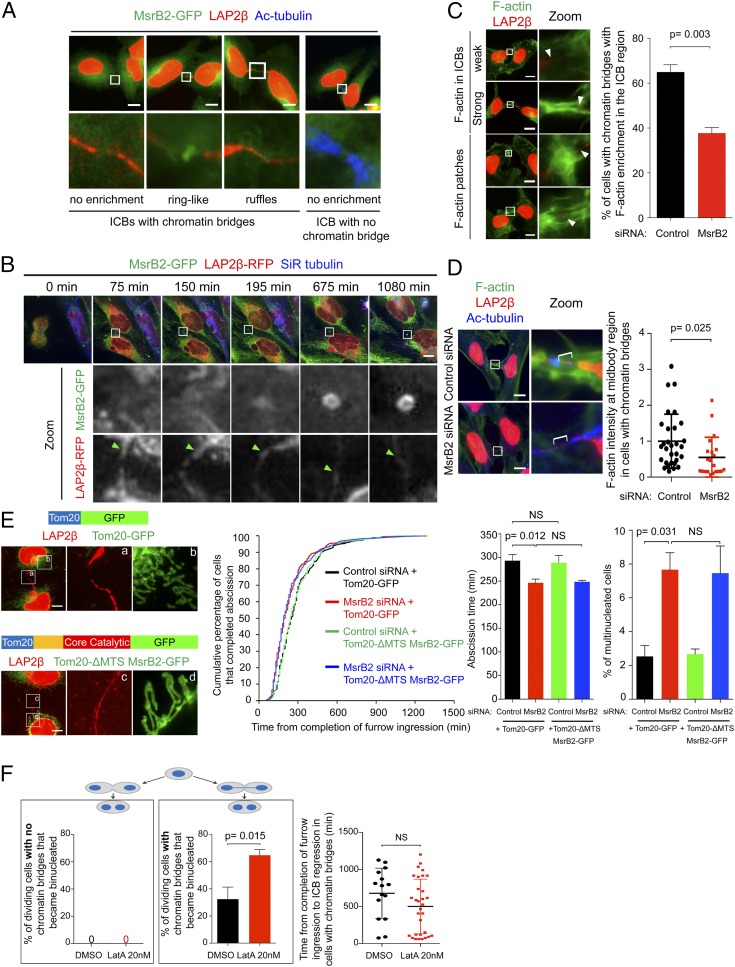
Abscission is the terminal step of cytokinesis leading to the physical separation of the daughter cells. In response to the abnormal presence of lagging chromatin between dividing cells, an evolutionarily conserved abscission/NoCut checkpoint delays abscission and prevents formation of binucleated cells by stabilizing the cytokinetic intercellular bridge (ICB). How this bridge is stably maintained for hours while the checkpoint is activated is poorly understood and has been proposed to rely on F-actin in the bridge region. Here, we show that actin polymerization is indeed essential for stabilizing the ICB when lagging chromatin is present, but not in normal dividing cells. Mechanistically, we found that a cytosolic pool of human methionine sulfoxide reductase B2 (MsrB2) is strongly recruited at the midbody in response to the presence of lagging chromatin and functions within the ICB to promote actin polymerization there. Consistently, in MsrB2-depleted cells, F-actin levels are decreased in ICBs, and dividing cells with lagging chromatin become binucleated as a consequence of unstable bridges. We further demonstrate that MsrB2 selectively reduces oxidized actin monomers and thereby counteracts MICAL1, an enzyme known to depolymerize actin filaments by direct oxidation. Finally, MsrB2 colocalizes and genetically interacts with the checkpoint components Aurora B and ANCHR, and the abscission delay upon checkpoint activation by nuclear pore defects also depends on MsrB2. Altogether, this work reveals that actin reduction by MsrB2 is a key component of the abscission checkpoint that favors F-actin polymerization and limits tetraploidy, a starting point for tumorigenesis.

Keywords: abscission checkpoint; actin; cytokinesis; cytoskeleton; oxidoreduction.


Conflict of interest statement

The authors declare no competing interest.

Figures

Fig. 1.
Fig. 1.
MsrB2 is a negative regulator of cytokinetic abscission and counteracts MICAL1-mediated actin oxidation and ESCRT-III recruitment. (A, Left) Lysates from HeLa cells treated with control or MsrB2 siRNAs were blotted for MsrB2 and β-tubulin (loading control). (Middle and Right) Distribution of the abscission time (P < 0.001, nonparametric and distribution-free Kolmogorov–Smirnov [KS] test) and mean abscission time ± SD in control- and MsrB2-depleted cells (N = 3 independent experiments). n = 244 to 247 cells per condition. (B) Distribution of abscission time (Left and Middle) and mean abscission time ± SD (Right) for control- and MsrB2-depleted cells transfected with indicated plasmids (N = 3 independent experiments). n = 217 to 227 cells per condition. No statistical difference between black and either green, blue, or gray curves. No statistical difference between red and yellow curve. P = 0.001 between black and either red or yellow curves (KS test). (C, Left) Lysates from cells treated with control, MsrB2, MICAL1, or MsrB2+MICAL1 siRNAs were blotted for MICAL1, MsrB2, and β-tubulin (loading control). (Middle and Right) Distribution of the abscission time and mean abscission time ± SD for the same cell populations described in the Left (N = 3 independent experiments). n = 233 to 245 cells per condition. No statistical significance between black and blue curves, P < 0.001 between black and red curve, P = 0.066 between black and green curve (KS test). (D) F-actin intensity in the ICBs from the same cell populations used in C (N = 3 independent experiments). n = 64 to 89 ICBs per condition. Mean ± SD. (Bottom) Representative images of F-actin in the ICBs for the corresponding conditions. (Scale bar: 2 μm.) (E) Quantification of ICBs with either No CHMP4B (Bottom Left image), with CHMP4B only at the midbody (Bottom Middle image), or with CHMP4B both at midbody and abscission site (Bottom Right image) for each cell population described in C (N = 3 independent experiments). n = 151 to 153 ICBs per condition. Mean ± SD. Brackets and arrowhead mark the midbody and the abscission site, respectively. (Scale bar: 2 μm.) NS, not significant. P values (Student t tests) are indicated.
Fig. 2.
Fig. 2.
MsrB2 selectively reduces actin monomers whereas MICAL1 only oxidizes actin filaments in vitro. (A) MICAL1 and MsrB2 constructs used in this figure. aa, amino acid. (B) MsrB2 amino acids 24 to 182 cannot reduce F-actin. (Upper) Time-lapse of the depolymerization of a single filament oxidized by MICAL1, sequentially exposed to buffer (a phase during which the filament depolymerized) and MsrB2 amino acids 24 to 182 (supplemented with actin at its critical concentration, 0.1 µM, such that the filament length remained constant during this phase). (Lower) The barbed end (BE) depolymerization rate is constant despite exposing the filament to MsrB2 amino acids 24 to 182. The depolymerization rates are normalized by the average depolymerization rate of oxidized filaments that have not been exposed to MsrB2 amino acids 24 to 182. n = 30 filaments, points: mean ± SD. (C) MsrB2 amino acids 24 to 182, but not a catalytically dead mutant (CD) or its catalytic core domain (CC), can reduce MICAL1-oxidized G-actin to allow repolymerization. (Upper) Sketch of the procedure and typical fields of view (cropped): 2 µM F-actin are sequentially incubated with MICAL1 (or buffer, for 90 min) and MrB2 constructs (or buffer, for various times). Fractions of this solution are diluted 20-fold into F-buffer supplemented with 0.3% methylcellulose and injected into an open chamber for visualization. (Lower) Quantification of the density of actin filaments. For each experiment and time point, we measured the total F-actin length in 4 to 12 individual fields of view, 10,000 µm2 each. Points: one to four independent experiments, mean ± SD. (D) MICAL1 does not oxidize G-actin. (Upper) Time-lapse images showing barbed end polymerization from a solution of profilin-actin containing NADPH, with or without MICAL1, incubated for up to 60 min, prior to elongation (the 0.6-µM actin solution was supplemented with 1 µM profilin to prevent spontaneous nucleation and to maintain a stable pool of G-actin). (Lower) Polymerization rate is independent of incubation time and presence of MICAL1. n = 20 filaments (two experiments), points: mean ± SD. (E) Regulation of actin turnover by the MICAL1/MsrB2 redox balance: MICAL1 oxidizes actin filaments, driving their depolymerization and the formation of oxidized monomers while MsrB2 reduces the oxidized monomers, allowing them to repolymerize into filaments. ADP, adenosine 5′-diphosphate; WT, wild-type.
Fig. 3.
Fig. 3.
MsrB2 localizes to both mitochondria and cytosol, and the cytosolic pool of MsrB2 controls the timing of abscission. (A) MsrB2 constructs used in this study. aa, amino acid; Cyto, cytosolic; GFP, green fluorescent protein; MTS, mitochondrial targeting sequence. (B, Top) Cells expressing MsrB2-GFP (green) were stained with Tom22 (red). (Bottom) Cells coexpressing MsrB2-GFP (green) and Mito-dsRed (red). (Scale bars: 10 μm.) (C, Upper) Cells expressing MsrB2 MTS-GFP (Top, green) or MsrB2 amino acids 1–74-GFP (Middle, green) or MsrB2 amino acids 24–182-GFP (Bottom, green) were stained with Tom22 (red). (Scale bars: 10 μm.) (Lower) Percentage of MsrB2-GFP, MsrB2 MTS-GFP, MsrB2 amino acids 1–74-GFP, or MsrB2 amino acids 24–182-GFP transfected cells displaying both mitochondria and cytosol localization (N = 3 independent experiments). n = 1,500 cells per condition. (D and E) Distribution of the abscission time and mean abscission time ± SD in control- and MsrB2-depleted cells transfected with indicated plasmids (N = 3 independent experiments). n = 171 to 224 cells per condition. In D, no statistical significance between black and blue curves, P < 0.001 between black and red curves, P = 0.014 between black and green curves (KS test). In E, no statistical significance between black and green curves, or red and blue curves, P < 0.001 between black and either red or blue curves (KS test). NS, not significant. P values (Student t tests) are indicated.
Fig. 4.
Fig. 4.
MsrB2 depletion leads to binucleated cells exclusively in the presence of chromatin bridges. (A, Left) Control- and MsrB2-depleted cells were stained with DAPI (blue) and acetylated-tubulin (Ac-tubulin) (green). White arrows indicate multinucleated cells. (Scale bar: 20 μm.) (Right) Percentage of multinucleated cells after control or MsrB2 depletion (N = 3 independent experiments). n = 1,500 cells per condition. Mean ± SD. (B) Percentage of multinucleated cells after control or MsrB2 depletion and transfection with indicated plasmids (N = 3 independent experiments). n = 1,500 cells per condition. Mean ± SD. (C, Left) Snapshot of time-lapse spinning-disk confocal microscopy movies of LAP2β-GFP cells treated with either control or MsrB2 siRNAs. Green asterisks and green arrowheads mark metaphase cells and chromatin bridges, respectively. (Scale bars: 5 μm.) (Middle) Percentage of dividing control- and MsrB2-depleted cells without (left box) or with (right box) chromatin bridges that eventually became binucleated (N = 3 independent experiments). n = 860 to 946 cell divisions per condition. (Right) Time from completion of furrow ingression to ICB regression in control- and MsrB2-depleted cells displaying chromatin bridges (N = 3 independent experiments). n = 41 to 78 cells per condition. Mean ± SD. NS, not significant. P values (Student t tests) are indicated.
Fig. 5.
Fig. 5.
MsrB2 is recruited to the midbody in the presence of chromatin bridges and controls F-actin levels. (A) Cells expressing MsrB2-GFP (green) were stained with LAP2β (red) and acetylated-tubulin (blue). Indicated zoomed regions are also presented (Lower). The acetylated-tubulin channel has been displayed only for the ICB with no chromatin bridge (Right). (Scale bars: 10 μm.) (B) Snapshots of a time-lapse spinning-disk confocal microscopy movie of cells expressing MsrB2-GFP (green) and LAP2β-RFP (red), labeled with SiR-tubulin (blue). Green arrowheads indicate chromatin bridges. (Scale bar: 10 μm.) (C, Left) Representative images of cells stained with phalloidin (green) and LAP2β (red). White arrowheads indicate chromatin bridges. (Scale bars: 10 μm.) (Right) Percentage of control- and MsrB2-depleted cells with LAP2β-positive chromatin bridges with F-actin enrichment in the ICB region (N = 3 independent experiments). n = 114 to 115 chromatin bridges containing ICBs. Mean ± SD. (D, Left) Representative images of control- and MsrB2-depleted cells stained with phalloidin (green), LAP2β (red), and acetylated-tubulin (blue). (Scale bars: 10 μm.) (Right) Quantification of F-actin intensity in the midbody region (brackets) in control- or MsrB2-depleted cells with LAP2β-positive chromatin bridges (N = 3 independent experiments). n = 21 to 30 chromatin bridges-positive ICBs per condition. Mean ± SD. (E, Left) Representative images of cells expressing Tom201-35-GFP (green, Upper) or Tom201-35-ΔMTS MsrB2-GFP (green, Bottom) stained with LAP2β (red). (Scale bars: 10 μm.) ad correspond to the indicated zoomed regions in E, Left. (Middle) Distribution of abscission time and mean abscission time ± SD for control- and MsrB2-depleted cells transfected with indicated plasmids (N = 3 independent experiments). n = 226 to 240 cells per condition. No statistical difference between black and green curves or between red and blue curves. P = 0.001 between black and red curves (KS test). (Right) Percentage of multinucleated cells after control or MsrB2 depletion and transfection with indicated plasmids (N = 3 independent experiments). n = 1,500 cells per condition. Mean ± SD. (F, Left) Percentage of dividing cells without (left box) or with (right box) chromatin bridges that became binucleated after treatment with either dimethyl sulfoxide (DMSO) or 20 nM LatA (N = 3 independent experiments). n = 485 to 555 cell divisions per condition. (Right) Time from completion of furrow ingression to ICB regression in DMSO- or 20 nM LatA-treated cells displaying chromatin bridges (N = 3 independent experiments). n = 15 to 31 cells per condition. Mean ± SD. NS, not significant. P values (Student t tests) are indicated.
Fig. 6.
Fig. 6.
MsrB2 colocalizes and genetically interacts with Aurora B and ANCHR. (A) Cells expressing MsrB2-GFP (green) were stained with p-Aurora B (red) and LAP2β (gray, Inset). Merged zoom of the midbody and individual red/green channels is also displayed, as indicated. (Scale bar: 10 μm.) (B) Distribution of abscission time (Left) and mean abscission time ± SD (Right) for GFP or Cyto MsrB2-GFP–expressing cells treated with either DMSO or Aurora B inhibitor ZM447439 (N = 3 independent experiments). n = 93 to 99 cells per condition. P = 0.035 between black and green curves. P = 0.038 between black and red curves. No statistical difference between green and blue curves (KS tests). (C) Cells expressing GFP-ANCHR and MsrB2-mCherry were stained with LAP2β (gray, Inset). Merged zoom of the midbody and individual red/green channels is also displayed, as indicated. (Scale bar: 10 μm.) (D) Distribution of abscission time (Left) and mean abscission time ± SD (Middle) for control, MsrB2, ANCHR, or MsrB2+ANCHR-depleted cells (N = 3 independent experiments). n = 241 to 247 cells per condition. P < 0.001 between black and either red, green, or blue curves. No statistical difference between red, green, and blue curves (KS tests). (Right) Percentage of multinucleated cells after control, MsrB2, ANCHR, or MsrB2+ANCHR depletion (N = 3 independent experiments). n = 1,500 cells per condition. Mean ± SD. (E, Left) Representative images of control and MsrB2-depleted cells stained for endogenous ANCHR (green) and LAP2β (red). (Insets) Correspond to the indicated zoomed regions (midbodies). (Scale bars: 10 μm.) (Right) Triplicate quantification for mean ANCHR fluorescent intensity (arbitrary units) in the midbodies of control- and MsrB2-depleted cells in the presence of LAP2β-positive chromatin bridges. n = 63 to 68 midbodies per condition. (F) Model: The reduction of G-actin by MsrB2 regulates its polymerization cycle by countering the effect of oxidation by MICAL1, thereby favoring the polymerization of actin filaments in the ICB. This F-actin pool delays the recruitment of ESCRT-III at the abscission site and stabilizes the ICB when a chromatin bridge is present. ICB, intercellular bridge. A green arrow means “favors” and a red arrow means “inhibits” localization and/or activity, whether the effect is direct or indirect. NS, not significant. P values (Student t tests) are indicated.

Similar articles

Cited by

References

    1. Green R. A., Paluch E., Oegema K., Cytokinesis in animal cells. Annu. Rev. Cell Dev. Biol. 28, 29–58 (2012). - PubMed
    1. D’Avino P. P., Giansanti M. G., Petronczki M., Cytokinesis in animal cells. Cold Spring Harb. Perspect. Biol. 7, a015834 (2015). - PMC - PubMed
    1. Pollard T. D., Nine unanswered questions about cytokinesis. J. Cell Biol. 216, 3007–3016 (2017). - PMC - PubMed
    1. Mierzwa B., Gerlich D. W., Cytokinetic abscission: Molecular mechanisms and temporal control. Dev. Cell 31, 525–538 (2014). - PubMed
    1. Frémont S., Echard A., Membrane traffic in the late steps of cytokinesis. Curr. Biol. 28, R458–R470 (2018). - PubMed

Publication types

MeSH terms

LinkOut - more resources