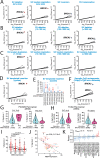
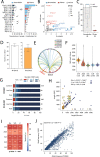
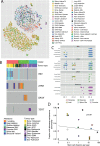
. 2020 Feb;578(7793):82-93.
doi: 10.1038/s41586-020-1969-6. Epub 2020 Feb 5.

Pan-cancer analysis of whole genomes

Collaborators

Pan-cancer analysis of whole genomes

ICGC/TCGA Pan-Cancer Analysis of Whole Genomes Consortium. Nature. 2020 Feb.

Erratum in

  • Author Correction: Pan-cancer analysis of whole genomes.
    ICGC/TCGA Pan-Cancer Analysis of Whole Genomes Consortium. ICGC/TCGA Pan-Cancer Analysis of Whole Genomes Consortium. Nature. 2023 Feb;614(7948):E39. doi: 10.1038/s41586-022-05598-w. Nature. 2023. PMID: 36697834 Free PMC article. No abstract available.

Abstract

Cancer is driven by genetic change, and the advent of massively parallel sequencing has enabled systematic documentation of this variation at the whole-genome scale1-3. Here we report the integrative analysis of 2,658 whole-cancer genomes and their matching normal tissues across 38 tumour types from the Pan-Cancer Analysis of Whole Genomes (PCAWG) Consortium of the International Cancer Genome Consortium (ICGC) and The Cancer Genome Atlas (TCGA). We describe the generation of the PCAWG resource, facilitated by international data sharing using compute clouds. On average, cancer genomes contained 4-5 driver mutations when combining coding and non-coding genomic elements; however, in around 5% of cases no drivers were identified, suggesting that cancer driver discovery is not yet complete. Chromothripsis, in which many clustered structural variants arise in a single catastrophic event, is frequently an early event in tumour evolution; in acral melanoma, for example, these events precede most somatic point mutations and affect several cancer-associated genes simultaneously. Cancers with abnormal telomere maintenance often originate from tissues with low replicative activity and show several mechanisms of preventing telomere attrition to critical levels. Common and rare germline variants affect patterns of somatic mutation, including point mutations, structural variants and somatic retrotransposition. A collection of papers from the PCAWG Consortium describes non-coding mutations that drive cancer beyond those in the TERT promoter4; identifies new signatures of mutational processes that cause base substitutions, small insertions and deletions and structural variation5,6; analyses timings and patterns of tumour evolution7; describes the diverse transcriptional consequences of somatic mutation on splicing, expression levels, fusion genes and promoter activity8,9; and evaluates a range of more-specialized features of cancer genomes8,10-18.


Conflict of interest statement

Gad Getz receives research funds from IBM and Pharmacyclics and is an inventor on patent applications related to MuTect, ABSOLUTE, MutSig, MSMuTect, MSMutSig and POLYSOLVER. Hikmat Al-Ahmadie is consultant for AstraZeneca and Bristol-Myers Squibb. Samuel Aparicio is a founder and shareholder of Contextual Genomics. Pratiti Bandopadhayay receives grant funding from Novartis for an unrelated project. Rameen Beroukhim owns equity in Ampressa Therapeutics. Andrew Biankin receives grant funding from Celgene, AstraZeneca and is a consultant for or on advisory boards of AstraZeneca, Celgene, Elstar Therapeutics, Clovis Oncology and Roche. Ewan Birney is a consultant for Oxford Nanopore, Dovetail and GSK. Marcus Bosenberg is a consultant for Eli Lilly. Atul Butte is a cofounder of and consultant for Personalis, NuMedii, a consultant for Samsung, Geisinger Health, Mango Tree Corporation, Regenstrief Institute and in the recent past a consultant for 10x Genomics and Helix, a shareholder in Personalis, a minor shareholder in Apple, Twitter, Facebook, Google, Microsoft, Sarepta, 10x Genomics, Amazon, Biogen, CVS, Illumina, Snap and Sutro and has received honoraria and travel reimbursement for invited talks from Genentech, Roche, Pfizer, Optum, AbbVie and many academic institutions and health systems. Carlos Caldas has served on the Scientific Advisory Board of Illumina. Lorraine Chantrill acted on an advisory board for AMGEN Australia in the past 2 years. Andrew D. Cherniack receives research funding from Bayer. Helen Davies is an inventor on a number of patent applications that encompass the use of mutational signatures. Francisco De La Vega was employed at Annai Systems during part of the project. Ronny Drapkin serves on the scientific advisory board of Repare Therapeutics and Siamab Therapeutics. Rosalind Eeles has received an honorarium for the GU-ASCO meeting in San Francisco in January 2016 as a speaker, a honorarium and support from Janssen for the RMH FR meeting in November 2017 as a speaker (title: genetics and prostate cancer), a honorarium for an University of Chicago invited talk in May 2018 as speaker and an educational honorarium paid by Bayer & Ipsen to attend GU Connect ‘Treatment sequencing for mCRPC patients within the changing landscape of mHSPC’ at a venue at ESMO, Barcelona, on 28 September 2019. Paul Flicek is a member of the scientific advisory boards of Fabric Genomics and Eagle Genomics. Ronald Ghossein is a consultant for Veracyte. Dominik Glodzik is an inventor on a number of patent applications that encompass the use of mutational signatures. Eoghan Harrington is a full-time employee of Oxford Nanopore Technologies and is a stock holder. Yann Joly is responsible for the Data Access Compliance Office (DACO) of ICGC 2009-2018. Sissel Juul is a full-time employee of Oxford Nanopore Technologies and is a stock holder. Vincent Khoo has received personal fees and non-financial support from Accuray, Astellas, Bayer, Boston Scientific and Janssen. Stian Knappskog is a coprincipal investigator on a clinical trial that receives research funding from AstraZeneca and Pfizer. Ignaty Leshchiner is a consultant for PACT Pharma. Carlos López-Otín has ownership interest (including stock and patents) in DREAMgenics. Matthew Meyerson is a scientific advisory board chair of, and consultant for, OrigiMed, has obtained research funding from Bayer and Ono Pharma and receives patent royalties from LabCorp. Serena Nik-Zainal is an inventor on a number of patent applications that encompass the use of mutational signatures. Nathan Pennell has done consulting work with Merck, Astrazeneca, Eli Lilly and Bristol-Myers Squibb. Xose S. Puente has ownership interest (including stock and patents in DREAMgenics. Benjamin J. Raphael is a consultant for and has ownership interest (including stock and patents) in Medley Genomics. Jorge Reis-Filho is a consultant for Goldman Sachs and REPARE Therapeutics, member of the scientific advisory board of Volition RX and Paige.AI and an ad hoc member of the scientific advisory board of Ventana Medical Systems, Roche Tissue Diagnostics, InVicro, Roche, Genentech and Novartis. Lewis R. Roberts has received grant support from ARIAD Pharmaceuticals, Bayer, BTG International, Exact Sciences, Gilead Sciences, Glycotest, RedHill Biopharma, Target PharmaSolutions and Wako Diagnostics and has provided advisory services to Bayer, Exact Sciences, Gilead Sciences, GRAIL, QED Therapeutics and TAVEC Pharmaceuticals. Richard A. Scolyer has received fees for professional services from Merck Sharp & Dohme, GlaxoSmithKline Australia, Bristol-Myers Squibb, Dermpedia, Novartis Pharmaceuticals Australia, Myriad, NeraCare GmbH and Amgen. Tal Shmaya is employed at Annai Systems. Reiner Siebert has received speaker honoraria from Roche and AstraZeneca. Sabina Signoretti is a consultant for Bristol-Myers Squibb, AstraZeneca, Merck, AACR and NCI and has received funding from Bristol-Myers Squibb, AstraZeneca, Exelixis and royalties from Biogenex. Jared Simpson has received research funding and travel support from Oxford Nanopore Technologies. Anil K. Sood is a consultant for Merck and Kiyatec, has received research funding from M-Trap and is a shareholder in BioPath. Simon Tavaré is on the scientific advisory board of Ipsen and a consultant for Kallyope. John F. Thompson has received honoraria and travel support for attending advisory board meetings of GlaxoSmithKline and Provectus and has received honoraria for participation in advisory boards for MSD Australia and BMS Australia. Daniel Turner is a full-time employee of Oxford Nanopore Technologies and is a stock holder. Naveen Vasudev has received speaker honoraria and/or consultancy fees from Bristol-Myers Squibb, Pfizer, EUSA pharma, MSD and Novartis. Jeremiah A. Wala is a consultant for Nference. Daniel J. Weisenberger is a consultant for Zymo Research. Dai-Ying Wu is employed at Annai Systems. Cheng-Zhong Zhang is a cofounder and equity holder of Pillar Biosciences, a for-profit company that specializes in the development of targeted sequencing assays. The other authors declare no competing interests.

Figures

Fig. 1
Fig. 1. Validation of variant-calling pipelines in PCAWG.
a, Scatter plot of estimated sensitivity and precision for somatic SNVs across individual algorithms assessed in the validation exercise across n = 63 PCAWG samples. Core algorithms included in the final PCAWG call set are shown in blue. b, Sensitivity and precision estimates across individual algorithms for somatic indels. c, Accuracy (precision, sensitivity and F1 score, defined as 2 × sensitivity × precision/(sensitivity + precision)) of somatic SNV calls across variant allele fractions (VAFs) for the core algorithms. The accuracy of two methods of combining variant calls (two-plus, which was used in the final dataset, and logistic regression) is also shown. d, Accuracy of indel calls across variant allele fractions.
Fig. 2
Fig. 2. Panorama of driver mutations in PCAWG.
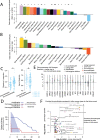
a, Top, putative driver mutations in PCAWG, represented as a circos plot. Each sector represents a tumour in the cohort. From the periphery to the centre of the plot the concentric rings represent: (1) the total number of driver alterations; (2) the presence of whole-genome (WG) duplication; (3) the tumour type; (4) the number of driver CNAs; (5) the number of driver genomic rearrangements; (6) driver coding point mutations; (7) driver non-coding point mutations; and (8) pathogenic germline variants. Bottom, snapshots of the panorama of driver mutations. The horizontal bar plot (left) represents the proportion of patients with different types of drivers. The dot plot (right) represents the mean number of each type of driver mutation across tumours with at least one event (the square dot) and the standard deviation (grey whiskers), based on n = 2,583 patients. b, Genomic elements targeted by different types of mutations in the cohort altered in more than 65 tumours. Both germline and somatic variants are included. Left, the heat map shows the recurrence of alterations across cancer types. The colour indicates the proportion of mutated tumours and the number indicates the absolute count of mutated tumours. Right, the proportion of each type of alteration that affects each genomic element. c, Tumour-suppressor genes with biallelic inactivation in 10 or more patients. The values included under the gene labels represent the proportions of patients who have biallelic mutations in the gene out of all patients with a somatic mutation in that gene. GR, genomic rearrangement; SCNA, somatic copy-number alteration; SGR, somatic genome rearrangement; TSG, tumour suppressor gene; UTR, untranslated region.
Fig. 3
Fig. 3. Analysis of patients with no detected driver mutations.
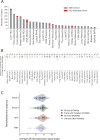
a, Individual estimates of the percentage of tumour-in-normal contamination across patients with no driver mutations in PCAWG (n = 181). No data were available for myelodysplastic syndromes and acute myeloid leukaemia. Points represent estimates for individual patients, and the coloured areas are estimated density distributions (violin plots). Abbreviations of the tumour types are defined in Extended Data Table 1. b, Average detection sensitivity by tumour type for tumours without known drivers (n = 181). Each dot represents a given sample and is the average sensitivity of detecting clonal substitutions across the genome, taking into account purity and ploidy. Coloured areas are estimated density distributions, shown for cohorts with at least five cases. c, Detection sensitivity for TERT promoter hotspots in tumour types in which TERT is frequently mutated. Coloured areas are estimated density distributions. d, Significant copy-number losses identified by two-sided hypothesis testing using GISTIC2.0, corrected for multiple-hypothesis testing. Numbers in parentheses indicate the number of genes in significant regions when analysing medulloblastomas without known drivers (n = 42). Significant regions with known cancer-associated genes are labelled with the representative cancer-associated gene. e, Aneuploidy in chromophobe renal cell carcinomas and pancreatic neuroendocrine tumours without known drivers. Patients are ordered on the y axis by tumour type and then by presence of whole-genome duplication (bottom) or not (top).
Fig. 4
Fig. 4. Patterns of clustered mutational processes in PCAWG.
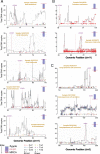
a, Kataegis. Top, prevalence of different types of kataegis and their association with SVs (≤1 kb from the focus). Bottom, the distribution of the number of foci of kataegis per sample. Chromoplexy. Prevalence of chromoplexy across cancer types, subdivided into balanced translocations and more complex events. Chromothripsis. Top, frequency of chromothripsis across cancer types. Bottom, for each cancer type a column is shown, in which each row is a chromothripsis region represented by five coloured rectangles relating to its categorization. b, Circos rainfall plot showing the distances between consecutive kataegis events across PCAWG compared with their genomic position. Lymphoid tumours (khaki, B cell non-Hodgkin’s lymphoma; orange, chronic lymphocytic leukaemia) have hypermutation hot spots (≥3 foci with distance ≤1 kb; pale red zone), many of which are near known cancer-associated genes (red annotations) and have associated SVs (≤10 kb from the focus; shown as arcs in the centre). c, Circos rainfall plot as in b that shows the distance versus the position of consecutive chromoplexy and reciprocal translocation footprints across PCAWG. Lymphoid, prostate and thyroid cancers exhibit recurrent events (≥2 footprints with distance ≤10 kb; pale red zone) that are likely to be driver SVs and are annotated with nearby genes and associated SVs, which are shown as bold and thin arcs for chromoplexy and reciprocal translocations, respectively (colours as in a). d, Effect of chromothripsis along the genome and involvement of PCAWG driver genes. Top, number of chromothripsis-induced gains or losses (grey) and amplifications (blue) or deletions (red). Within the identified chromothripsis regions, selected recurrently rearranged (light grey), amplified (blue) and homozygously deleted (magenta) driver genes are indicated. Bottom, interbreakpoint distance between all subsequent breakpoints within chromothripsis regions across cancer types, coloured by cancer type. Regions with an average interbreakpoint distance <10 kb are highlighted. C[T>N]T, kataegis with a pattern of thymine mutations in a Cp TpT context.
Fig. 5
Fig. 5. Timing of clustered events in PCAWG.
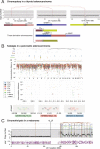
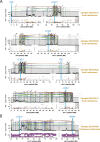
a, Extent and timing of chromothripsis, kataegis and chromoplexy across PCAWG. Top, stacked bar charts illustrate co-occurrence of chromothripsis, kataegis and chromoplexy in the samples. Middle, relative odds of clustered events being clonal or subclonal are shown with bootstrapped 95% confidence intervals. Point estimates are highlighted when they do not overlap odds of 1:1. Bottom, relative odds of the events being early or late clonal are shown as above. Sample sizes (number of patients) are shown across the top. b, Three representative patients with acral melanoma and chromothripsis-induced amplification that simultaneously affects TERT and CCND1. The black points (top) represent sequence coverage from individual genomic bins, with SVs shown as coloured arcs (translocation in black, deletion in purple, duplication in brown, tail-to-tail inversion in cyan and head-to-head inversion in green). Bottom, the variant allele fractions of somatic point mutations.
Fig. 6
Fig. 6. Germline determinants of the somatic mutation landscape.
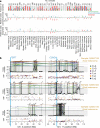
a, Association between common (MAF > 5%) germline variants and somatic APOBEC3B-like mutagenesis in individuals of European ancestry (n = 1,201). Two-sided hypothesis testing was performed with PLINK v.1.9. To mitigate multiple-hypothesis testing, the significance threshold was set to genome-wide significance (P < 5 × 10−8). b, Templated insertion SVs in a BRCA1-associated prostate cancer. Left, chromosome bands (1); SVs ≤ 10 megabases (Mb) (2); 1-kb read depth corrected to copy number 0–6 (3); inter- and intrachromosomal SVs > 10 Mb (4). Right, a complex somatic SV composed of a 2.2-kb tandem duplication on chromosome 2 together with a 232-base-pair (bp) inverted templated insertion SV that is derived from chromosome 5 and inserted inbetween the tandem duplication (bottom). Consensus sequence alignment of locally assembled Oxford Nanopore Technologies long sequencing reads to chromosomes 2 and 5 of the human reference genome (top). Breakpoints are circled and marked as 1 (beginning of tandem duplication), 2 (end of tandem duplication) or 3 (inverted templated insertion). For each breakpoint, the middle panel shows Illumina short reads at SV breakpoints. c, Association between rare germline PTVs (MAF < 0.5%) and somatic CpG mutagenesis (approximately with signature 1) in individuals of European ancestry (n = 1,201). Genes highlighted in blue or red were associated with lower or higher somatic mutation rates. Two-sided hypothesis testing was performed using linear-regression models with sex, age at diagnosis and cancer project as variables. To mitigate multiple-hypothesis testing, the significance threshold was set to exome-wide significance (P < 2.5 × 10−6). The black line represents the identity line that would be followed if the observed P values followed the null expectation; the shaded area shows the 95% confidence intervals. d, Catalogue of polymorphic germline L1 source elements that are active in cancer. The chromosomal map shows germline source L1 elements as volcano symbols. Each volcano is colour-coded according to the type of source L1 activity. The contribution of each source locus (expressed as a percentage) to the total number of transductions identified in PCAWG tumours is represented as a gradient of volcano size, with top contributing elements exhibiting larger sizes.
Fig. 7
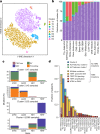
Fig. 7. Telomere sequence patterns across PCAWG.
a, Scatter plot of the clusters of telomere patterns identified across PCAWG using t-distributed stochastic neighbour embedding (t-SNE), based on n = 2,518 tumour samples and their matched normal samples. Axes have arbitrary dimensions such that samples with similar telomere profiles are clustered together and samples with dissimilar telomere profiles are far apart with high probability. b, Distribution of the four tumour-specific clusters of telomere patterns in selected tumour types from PCAWG. c, Distribution of relevant driver mutations associated with alternative lengthening of telomere and normal telomere maintenance across the four clusters. d, Distribution of telomere maintenance abnormalities across tumour types with more than 40 patients in PCAWG. Samples were classified as tumour clusters 1–3 if they fell into a relevant cluster without mutations in TERT, ATRX or DAXX and had no ALT phenotype. TMM, telomere maintenance mechanisms.
Extended Data Fig. 1
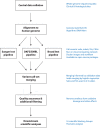
Extended Data Fig. 1. Flow-chart showing key steps in the analysis of PCAWG genomes.
After alignment to the genome, somatic mutations were identified by three pipelines, with subsequent merging into a consensus variant set used for downstream scientific analyses. Subs, substitutions; DKFZ/EMBL, the German Cancer Research Centre (DKFZ) and Europen Molecular Biology Laboratory (EMBL).
Extended Data Fig. 2
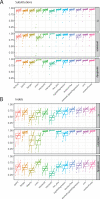
Extended Data Fig. 2. Distribution of accuracy estimates across algorithms and samples from validation data.
a, F1 accuracy, precision and sensitivity estimates for somatic SNVs across the core algorithms and different approaches to merging the call-sets. The box plots demarcate the interquartile range and median of estimates across the n = 50 samples in the validation dataset. b, F1 accuracy, precision and sensitivity estimates for somatic indels (n = 50 samples). SVM, support vector machine; union, calls made by all variant-calling algorithms; intersect2, calls made by any combination of two variant-calling algorithms; intersect3, calls made by any three variant-calling algorithms.
Extended Data Fig. 3
Extended Data Fig. 3. Distribution of numbers of somatic mutations of different classes across tumour types.
The y axis is on a log scale. The 2,583 donors with the highest quality metrics (white-listed donors) are plotted. SNVs indicate substitutions; indels are taken as insertions or deletions <100 bp in size; retrotranspositions are the combined counts of somatic retrotransposon insertions, transductions and somatic pseudogene insertions.
Extended Data Fig. 4
Extended Data Fig. 4. Patients with no detected driver mutations in PCAWG.
a, Number (red) of patients without detected driver mutations distributed across the different tumour types studied. b, Estimated sensitivity for detecting somatic point mutations genome-wide across tumour types (total sample size: n = 2,583 patients). Each point represents the estimate for a single patient, layered on violin plots that show the estimated density distribution of sensitivity values for that tumour type (the width proportional is to density). c, SETD2 expression levels across different medulloblastoma subtypes. Points represent individual patients, coloured by whether the gene exhibited focal copy number (CN) loss or a truncating point mutation, or was the wild-type gene. The coloured areas are violin plots showing the estimated density distribution of expression values for that medulloblastoma subtype.
Extended Data Fig. 5
Extended Data Fig. 5. Examples of clustered mutational processes.
a, Chromoplexy example in a thyroid adenocarcinoma. Genes at the breakpoints are schematically depicted in their normal genomic context and again in the reconstructed derivative chromosomes below. b, Distinct kataegis signatures in the genome of a pancreatic adenocarcinoma sample. SVs and their classification are shown above the main rainfall plot, as well as the total and minor allele copy number. Tra, translocation; del, deletion; dup, duplication; t2tInv, tail-to-tail inversion; h2hInv, head-to-head inversion. Magnifications of the three foci on chromosomes 1, 8 and 12, respectively, highlight distinct manifestations of kataegis. Left, a novel process similar to signature 17 with T > N mutations at CT or TT dinucleotides. Middle, the prototypical APOBEC3A/B type with C > T (signature 2) and/or C>G/A (signature 13) substitutions at TpC. Right, an alternative cytidine deaminase(s) with a preference for substitutions at C/GpC. Most of the SNVs in each of these foci can be phased to the same allele and no evidence of anti-phasing is observed. c, Example of a chromothripsis event in a melanoma. The black points (top) represent copy-number estimates from individual genomic bins, with SVs shown as coloured arcs (translocation in black, deletion in purple, duplication in brown, tail-to-tail inversion in cyan, head-to-head inversion in green) that mostly demarcate copy-number changes. The mate chromosomes are displayed above translocations. Bottom, the variant allele fractions of somatic mutations distributed along the relevant chromosomal region.
Extended Data Fig. 6
Extended Data Fig. 6. Patterns of intense kataegis.
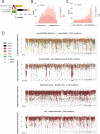
a, Distribution of the tumour types (colour-coded as in Extended Data Fig. 3) of the samples in the top 5% of kataegis intensity in each of the four identified genome-wide patterns: non-APOBEC, replication stress, rearrangement-associated and the combination of the last two. b, c, Distribution of leading/lagging strand (b) and replication timing bias (c) for rearrangement-(in)dependent APOBEC kataegis, based on n = 2,583 tumours. P values were derived using a two-sided Mann–Whittney U-test. d, Example rainfall plots for each of the four identified kataegis patterns.
Extended Data Fig. 7
Extended Data Fig. 7. Association of chromothripsis with covariates and driver events.
a, Odds ratios per cancer type of containing chromothripsis in whole-genome duplicated versus diploid samples (n = 2,583 patients). ***q < 0.001; **q < 0.01; *q < 0.05. Two-sided hypothesis testing was performed using Fisher–Boschloo tests, corrected for multiple-hypothesis testing. b, Same as a for female versus male. c, Proportion of mutations explained by single-base substitution signature 1 and age at diagnosis in prostate cancer samples (n = 210 patients) with or without chromothripsis (q < 0.05). The early-onset prostate cancer project drives the signal and was sequenced at lower depth. For the box-and-whisker plots, the box denotes the interquartile range, with the median marked as a horizontal line. The whiskers extend as far as the range or 1.5× the interquartile range, whichever is less. Two-sided hypothesis testing was performed using Mann–Whitney U-tests. d, Counts of co-occurrence of chromothripsis with amplification (blue) and homozygous deletions (red) in driver regions: observed (thick line) versus randomized (shaded area and thin line). The cumulative number of drivers that were hit is plotted as a function of the number of times those drivers were hit. e, For each sample in which chromothripsis coincided with a driver event in those genes, we show the fold change in gene expression compared to the median expression of the gene in non-chromothripsis samples of the same cancer type, coloured by cancer type and shaped by the type of driver event. We show with added transparency the fold changes calculated the same way for samples with driver mutations hitting the same driver genes, but that had no evidence of chromothripsis. Analysis is based on n = 1,222 patients with RNA-sequencing data. f, Enrichment of co-occurrence of chromothripsis with driver events. The x axis shows the association of chromothripsis with a driver in a given cancer type compared with its rate of association with that driver in all other cancer types. The y axis shows the association of chromothripsis with a driver in a given cancer type compared with its rate of association with all other drivers in that type. Exact binomial tests are used and P values are corrected for multiple testing according to the Benjamini–Hochberg method.
Extended Data Fig. 8
Extended Data Fig. 8. Further examples of chromothripsis-induced amplification targeting multiple cancer-associated genes simultaneously in melanoma.
a, Examples of amplifications that occurred early in the development of melanoma. The black points (top) represent copy-number estimates from individual genomic bins, with SVs shown as coloured arcs (translocation in black, deletion in purple, duplication in brown, tail-to-tail inversion in cyan and head-to-head inversion in green) that mostly demarcate copy-number changes. Bottom, the variant allele fractions of SNVs distributed along the relevant chromosomal region. The paucity of somatic mutations at high variant allele fractions in the most-heavily amplified regions indicates that these amplifications began very early in tumour evolution, before the lineage had had opportunity to acquire many SNVs. b, Example of an amplification that occurred late in melanoma development. The large numbers of somatic mutations at high variant allele fractions in the most-heavily amplified regions indicate that these amplifications began late in tumour evolution, after the lineage had already acquired many SNVs.
Extended Data Fig. 9
Extended Data Fig. 9. Timing the amplifications after chromothripsis in molecular time for 10 representative cases.
a, Copy-number plot of chromothriptic regions categorized as ‘liposarc-like’ in five acral melanomas with CCND1 amplification. Segments indicate the copy number of the major allele. Points represent SNV multiplicities, that is, the estimated number of copies carrying each SNV, coloured by base change and shaped by strand. Small vertical arrows link SNVs to their corresponding copy-number segment. Kataegis foci are shown within black boxes and show typical strand specificities (all triangles or all circles), similar multiplicities and base changes of signatures 2 and 13 (red and black, respectively). A coloured bar (top right) represents the molecular timing of the amplification (red bar; high is early, low is late) and is coloured by the fraction of total SNVs assigned to the following timing categories: clonal [early], clonal mutations that occurred before duplications involving the relevant chromosome (including whole-genome duplications); clonal [late], clonal mutations that occurred after such duplications; and clonal [NA], mutations that occurred when no duplication was observed. b, Same as a in two cutaneous melanomas, one shows early amplification, the other late amplification. c, Same as a, b, for three lung squamous cell carcinomas and late amplification of SOX2.
Extended Data Fig. 10
Extended Data Fig. 10. Association between common germline variants and endogenous mutational processes.
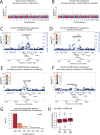
Genome-wide association of somatic CpG mutagenesis in individuals of European ancestry (n = 1,201 patients) based on mutational signature analysis (a) and NpCpG motif analysis (b). Two-sided hypothesis testing was performed using PLINK v.1.9. To mitigate multiple-hypothesis testing, the significance threshold was set to genome-wide significance (P < 5 × 10−8). c, d, Locuszoom plot for somatic APOBEC3B-like mutagenesis association results, linkage disequilibrium and recombination rates around the genome-wide significant 22q13.1 locus in individuals with European (c) and East Asian (d) ancestry (n = 1,201 and 318 patients, respectively). Locuszoom plot for somatic APOBEC3B-like mutagenesis association results around the 22q13.1 locus in individuals with European (e) and East Asian (f) ancestry after conditioning on rs12628403. g, h, Association between rs2142833 and expression of APOBEC3 genes in PCAWG tumour samples (adjusted for sex, age at diagnosis, histology and population structure in linear-regression models with two-sided hypothesis testing not corrected for multiple tests). For the box-and-whisker plot, the box denotes the interquartile range, with the median marked as a horizontal line. The whiskers extend as far as the range or 1.5× the interquartile range, whichever is less. Outliers are shown as points.
Extended Data Fig. 11
Extended Data Fig. 11. Association between rare germline PTVs in protein-coding genes and somatic mutational phenotypes.
ad, f, Data are based on two-sided rare-variant association testing across n = 2,583 patients, with a stringent P value threshold of P < 2.5 × 10−6 used to mitigate multiple-hypothesis testing (significant genes marked with coloured circles). Blue/red circles mark genes that decrease/increase somatic mutation rates. The black line represents the identity line that would be followed if the observed P values followed the null expectation, with the shaded area showing the 95% confidence intervals. a, QQ plots for the proportion of somatic SV deletions, tandem duplications, inversions and translocation in cancer genomes. b, QQ plots for the proportion of somatic SV deletions in cancer genomes stratified by four size groups (1–10 kb, 10–100 kb, 100–1,000 kb and >1,000 kb). c, QQ plots for the proportion of somatic SV tandem duplications in cancer genomes stratified by four size groups (1–10 kb, 10–100 kb, 100–1,000 kb and >1,000 kb). d, QQ plot for the presence or absence of somatic SV templated insertion (cycles) in cancer genomes. e, Number of SV-templated insertion cycles in PCAWG tumours with germline BRCA1 PTVs. Only histological samples with at least one germline BRCA1 PTV carrier are shown (n = 1,095 patients combined). The box denotes the interquartile range, with the median marked as a horizontal line. The whiskers extend as far as the range or 1.5× the interquartile range, whichever is less. Outliers are shown as points. f, QQ plot for somatic CpG mutagenesis in cancer genomes based on NpCpG motif analysis. g, Violin plots show estimated densities of the proportion of somatic CpG mutations in PCAWG donors with germline MBD4 and BRCA2 PTVs. The box denotes the interquartile range, with the median marked as a white point. The whiskers extend as far as the range or 1.5× the interquartile range, whichever is less. Two-sided hypothesis testing, not corrected for multiple testing, was performed using linear regression models. h, Replication of germline MBD4 and BRCA2 PTV associations with somatic CpG mutagenesis in TCGA whole-exome sequencing donors. Violin plots show the estimated density of the proportion of somatic CpG mutations in TCGA exomes with germline MBD4 and BRCA2 PTVs. The box denotes the interquartile range, with the median marked as a white point. The whiskers extend as far as the range or 1.5× the interquartile range, whichever is less. Two-sided hypothesis testing, not corrected for multiple testing, was performed using linear-regression models. i, Correlation between MBD4 expression and somatic CpG mutagenesis in primary solid PCAWG tumours. Hypothesis testing was two-sided and not corrected for multiple testing, using linear-regression models. The box denotes the interquartile range, with the median marked as a horizontal line. The whiskers extend as far as the range or 1.5× the interquartile range, whichever is less. j, Data are mean ± s.e.m. across n = 20 tumour types. The dashed black line shows the fitted line to the data, estimated using linear-regression models. Hypothesis testing was two-sided and not corrected for multiple testing, using Spearman’s rank correlations. k, MBD4 effect sizes (open circles) with 95% confidence intervals (error bars) for individual cancer types were estimated using linear-regression analysis after (if available) accounting for sex, age at diagnosis (young/old) and ICGC project. Hypothesis testing was two-sided and not corrected for multiple testing.
Extended Data Fig. 12
Extended Data Fig. 12. Germline MEI call set.
a, Left, dots show the number of transductions promoted by each hot element in individual samples. Arrows highlight retrotransposition burst. Right, the contribution of each hot locus is represented. The total number of transductions mediated by each source element is shown on the right. b, Source L1 activity rate (that is, measured as the average number of transductions mediated by an element) versus the percentage of samples with retrotransposition activity in which the germline element is active. For visualization purposes, extreme points observed for a source L1 with an activity rate of 49 and for a L1 active in 31% of the samples are shown at ≥20 and ≥10, respectively. c, Contrasting allele frequencies for Strombolian and Plinian source loci (sample sizes shown under each axis label). The box denotes the interquartile range, with the median marked as a white point. The whiskers extend as far as the range or 1.5× the interquartile range, whichever is less. Hypothesis testing was performed using two-sided Mann–Whitney U-tests without correction for multiple tests. d, Numbers of active and hot source L1 elements per donor. Data are mean ± s.d. number of elements per donor. e, The novel Plinian source element on 7p12.3 mediates 72 transductions among only 6 cancer samples. This generates a transduction that induces the deletion of the tumour-suppressor gene CDKN2A. f, Violin plots show the estimated number of distinct germline MEI alleles per PCAWG donor. The box denotes the interquartile range, with the median marked as a white point. The whiskers extend as far as the range or 1.5× the interquartile range, whichever is less. Donors are grouped according to their genetic ancestry: AFR, African; AMR, admixed American; EAS, East Asian; EUR, European; SAS, South Asian. Sample sizes are shown under each axis label. g, For each type of MEI (L1, Alu and SVA) identified both in PCAWG and in the 1000 Genomes Project (1KGP), the correlations between allele frequency estimates per ancestry derived from both projects are displayed in a blue (0) to red (1) coloured gradient. n = 2,583 PCAWG patients. Two-sided hypothesis testing was performed using Spearman’s rank correlations without correction for multiple tests. h, Example correlation between MEI allele frequencies derived from PCAWG and the 1000 Genomes Project for individuals with European ancestry (n = 1,201 patients in PCAWG). Two-sided hypothesis testing was performed using Spearman’s rank correlations without correction for multiple tests. i, Evaluation of TraFiC-mem false-discovery rate on a liver hepatocellular carcinoma sample (DO50807) and a cell line (NCI-BL2087) sequenced using single-molecule sequencing with MinION (Oxford Nanopore). For each allele frequency bin (common, >5%; low frequency, 1–5%; rare, <1%), the percentage of events supported by N long reads is represented (N ranges from 0–1 to more than 5). MEIs supported by at least two Nanopore reads were considered to be true positives (blue palette) and were classified as false positives (red) otherwise. The total number of germline MEIs per allele frequency bin is shown on the right. j, Correlation between predicted MEI lengths from Illumina and Nanopore data. Two-sided hypothesis testing was performed using Spearman’s rank correlations without correction for multiple testing.
Extended Data Fig. 13
Extended Data Fig. 13. Different mechanisms of telomere lengthening in cancer.
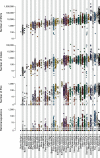
a, Scatter plot showing the four clusters of tumour-specific telomere patterns identified across PCAWG samples, together with the clusters of matched normal samples, generated by t-distributed stochastic neighbour embedding. Circles represent tumour samples and triangles represent matched normal samples. Points are coloured by tissue of origin. Data are based on n = 2,518 tumour samples and their matched normal samples. b, Patterns of comutation of the relevant driver mutations across individual patients. Columns in plot represent individual patients, coloured by type of abnormality observed. c, Distribution of clonality of driver mutations in genes relevant to telomere maintenance across clusters. Clonal [early], clonal mutations that occurred before duplications involving the relevant chromosome (including whole-genome duplications); clonal [late], clonal mutations that occurred after such duplications; and clonal [NA], mutations that occurred when no duplication was observed. d, Relationship between the estimated number of stem cell divisions per year and rate of telomere maintenance abnormalities across tumour types. The analysis uses data on estimated rates of stem cell division per year across n = 19 tissue types previously collated from the literature. Tumour types are coloured according to the scheme shown in Extended Data Fig. 3. Two-sided hypothesis testing was performed using likelihood ratio tests on Poisson regression models with no correction for multiple tests.

Comment in

Similar articles

  • Comprehensive analysis of chromothripsis in 2,658 human cancers using whole-genome sequencing.
    Cortés-Ciriano I, Lee JJ, Xi R, Jain D, Jung YL, Yang L, Gordenin D, Klimczak LJ, Zhang CZ, Pellman DS; PCAWG Structural Variation Working Group; Park PJ; PCAWG Consortium. Cortés-Ciriano I, et al. Nat Genet. 2020 Mar;52(3):331-341. doi: 10.1038/s41588-019-0576-7. Epub 2020 Feb 5. Nat Genet. 2020. PMID: 32025003 Free PMC article.
  • Patterns of somatic structural variation in human cancer genomes.
    Li Y, Roberts ND, Wala JA, Shapira O, Schumacher SE, Kumar K, Khurana E, Waszak S, Korbel JO, Haber JE, Imielinski M; PCAWG Structural Variation Working Group; Weischenfeldt J, Beroukhim R, Campbell PJ; PCAWG Consortium. Li Y, et al. Nature. 2020 Feb;578(7793):112-121. doi: 10.1038/s41586-019-1913-9. Epub 2020 Feb 5. Nature. 2020. PMID: 32025012 Free PMC article.
  • Analyses of non-coding somatic drivers in 2,658 cancer whole genomes.
    Rheinbay E, Nielsen MM, Abascal F, Wala JA, Shapira O, Tiao G, Hornshøj H, Hess JM, Juul RI, Lin Z, Feuerbach L, Sabarinathan R, Madsen T, Kim J, Mularoni L, Shuai S, Lanzós A, Herrmann C, Maruvka YE, Shen C, Amin SB, Bandopadhayay P, Bertl J, Boroevich KA, Busanovich J, Carlevaro-Fita J, Chakravarty D, Chan CWY, Craft D, Dhingra P, Diamanti K, Fonseca NA, Gonzalez-Perez A, Guo Q, Hamilton MP, Haradhvala NJ, Hong C, Isaev K, Johnson TA, Juul M, Kahles A, Kahraman A, Kim Y, Komorowski J, Kumar K, Kumar S, Lee D, Lehmann KV, Li Y, Liu EM, Lochovsky L, Park K, Pich O, Roberts ND, Saksena G, Schumacher SE, Sidiropoulos N, Sieverling L, Sinnott-Armstrong N, Stewart C, Tamborero D, Tubio JMC, Umer HM, Uusküla-Reimand L, Wadelius C, Wadi L, Yao X, Zhang CZ, Zhang J, Haber JE, Hobolth A, Imielinski M, Kellis M, Lawrence MS, von Mering C, Nakagawa H, Raphael BJ, Rubin MA, Sander C, Stein LD, Stuart JM, Tsunoda T, Wheeler DA, Johnson R, Reimand J, Gerstein M, Khurana E, Campbell PJ, López-Bigas N; PCAWG Drivers and Functional Interpretation Working Group; PCAWG Structural Variation Working Group; Weischenfeldt J, Beroukhim R, Martincorena I, Pedersen JS, Getz G; PCAWG Consortium. Rheinbay E, et al. Nature. 2020 Feb;578(7793):102-111. doi: 10.1038/s41586-020-1965-x. Epub 2020 Feb 5. Nature. 2020. PMID: 32025015 Free PMC article.
  • Decoding human cancer with whole genome sequencing: a review of PCAWG Project studies published in February 2020.
    Giunta S. Giunta S. Cancer Metastasis Rev. 2021 Sep;40(3):909-924. doi: 10.1007/s10555-021-09969-z. Epub 2021 Jun 7. Cancer Metastasis Rev. 2021. PMID: 34097189 Free PMC article. Review.
  • Beyond the exome: the role of non-coding somatic mutations in cancer.
    Piraino SW, Furney SJ. Piraino SW, et al. Ann Oncol. 2016 Feb;27(2):240-8. doi: 10.1093/annonc/mdv561. Epub 2015 Nov 23. Ann Oncol. 2016. PMID: 26598542 Review.

Cited by

References

    1. Pleasance ED, et al. A comprehensive catalogue of somatic mutations from a human cancer genome. Nature. 2010;463:191–196. doi: 10.1038/nature08658. - DOI - PMC - PubMed
    1. Pleasance ED, et al. A small-cell lung cancer genome with complex signatures of tobacco exposure. Nature. 2010;463:184–190. doi: 10.1038/nature08629. - DOI - PMC - PubMed
    1. Ley TJ, et al. DNA sequencing of a cytogenetically normal acute myeloid leukaemia genome. Nature. 2008;456:66–72. doi: 10.1038/nature07485. - DOI - PMC - PubMed
    1. Rheinbay, E. et al. Analyses of non-coding somatic drivers in 2,693 cancer whole genomes. Nature10.1038/s41586-020-1965-x (2020). - PMC - PubMed
    1. Alexandrov, L. B. et al. The repertoire of mutational signatures in human cancer. Nature10.1038/s41586-020-1943-3 (2020). - PMC - PubMed

MeSH terms

Grants and funding