. 2020 Mar;52(3):320-330.
doi: 10.1038/s41588-019-0558-9. Epub 2020 Feb 5.

The landscape of viral associations in human cancers

Collaborators, Affiliations

The landscape of viral associations in human cancers

Marc Zapatka et al. Nat Genet. 2020 Mar.

Erratum in

  • Author Correction: The landscape of viral associations in human cancers.
    Zapatka M, Borozan I, Brewer DS, Iskar M, Grundhoff A, Alawi M, Desai N, Sültmann H, Moch H; PCAWG Pathogens; Cooper CS, Eils R, Ferretti V, Lichter P; PCAWG Consortium. Zapatka M, et al. Nat Genet. 2023 Jun;55(6):1077. doi: 10.1038/s41588-023-01316-y. Nat Genet. 2023. PMID: 36944734 Free PMC article. No abstract available.

Abstract

Here, as part of the Pan-Cancer Analysis of Whole Genomes (PCAWG) Consortium, for which whole-genome and-for a subset-whole-transcriptome sequencing data from 2,658 cancers across 38 tumor types was aggregated, we systematically investigated potential viral pathogens using a consensus approach that integrated three independent pipelines. Viruses were detected in 382 genome and 68 transcriptome datasets. We found a high prevalence of known tumor-associated viruses such as Epstein-Barr virus (EBV), hepatitis B virus (HBV) and human papilloma virus (HPV; for example, HPV16 or HPV18). The study revealed significant exclusivity of HPV and driver mutations in head-and-neck cancer and the association of HPV with APOBEC mutational signatures, which suggests that impaired antiviral defense is a driving force in cervical, bladder and head-and-neck carcinoma. For HBV, HPV16, HPV18 and adeno-associated virus-2 (AAV2), viral integration was associated with local variations in genomic copy numbers. Integrations at the TERT promoter were associated with high telomerase expression evidently activating this tumor-driving process. High levels of endogenous retrovirus (ERV1) expression were linked to a worse survival outcome in patients with kidney cancer.


Conflict of interest statement

The authors declare no competing interests.

Figures
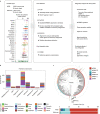
Fig. 1
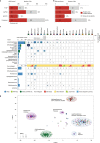
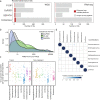
Fig. 1. Overview, design and summary statistics.
a, Workflow to identify and characterize viral sequences from the WGS and RNA sequencing of tumor and non-malignant samples. Viral hits were characterized in detail by using several clinical annotations and resources generated by PCAWG. The red line represents the median. CNS, central nervous system. b, Identified viral hits in contigs that showed higher viral reads PMER for artificial sequences such as vectors than for the virus. All viruses that occurred in at least 20 primary tumor samples in the same contig together with an artificial sequence are shown. c, Summary of the viral search space used in the analysis grouped by virus genome type. The number of virus-positive tumor samples is indicated in the outer rings (PMER log scale for WGS and RNA-seq data) as detected by any of the pipelines. Taxonomic relations between the viruses are indicated by the phylogenetic tree. dsDNA, double-stranded DNA; dsDNA-RT, double-stranded DNA with reverse transcriptase; dsRNA, double-stranded RNA; ssDNA, single-stranded DNA; ssRNA-RT: single-stranded RNA with reverse transcriptase; ssRNA, single-stranded RNA; dsRNA, double-stranded RNA. The fractions of hits in WGS and RNA-seq data are depicted as stacked bar graphs.
Fig. 2
Fig. 2. Consensus for detected viruses in WGS and RNA-seq data.
Number of genus hits among tumor samples for the three independent pipelines and the consensus set defined by evidence from multiple pipelines. a, Analysis based on WGS. b, Analysis based on whole-transcriptome sequencing. c, Heat map showing the total number of viruses detected across various cancer entities. The sequencing data used for detection are indicated among the total number of hits (WGS, blue; RNA sequencing, green). The fraction of virus-positive samples is shown at the top and the type of non-malignant tissue used in the analysis is indicated if more than 15% of the analyzed samples are from a respective tissue type (solid tissue, lymph node, blood or adjacent to primary tumor). d, t-SNE clustering of the tumor samples based on PMER of their consensus virome profiles, using Pearson correlation as the distance metric. Major clusters are highlighted by indicating the strongest viral genus and the dominant tissue types that are positive in that cluster. Dot size represents the viral reads PMER.
Fig. 3
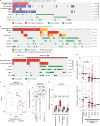
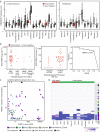
Fig. 3. Virus-specific findings.
a, HBV detections, validations and driver mutations in liver cancer. The asterisk indicates mutual exclusivity between HBV detection and somatic driver gene mutations. Red boxes represent virus-positive tumor samples, purple boxes show viral genomic integrations, green boxes indicate driver mutations and gray boxes represent missing data. b, Virus detections in gastric cancer samples, indication of virus phase (lytic/latent, dark red) and driver mutations (green). A yellow color indicates donors with virus-positive non-malignant samples. The gray box refers to samples with available RNA-seq data. c, Virus detections (red) and driver mutations (green) in cervix (blue) and head-and-neck cancer (brown). The asterisk indicates mutual exclusivity between alphapapillomavirus detections and somatic driver gene mutations. d, Alphapapillomavirus detection and exposures of mutational APOBEC signatures SBS2 and SBS13. Sample sizes are shown at the bottom. A two-sided Wilcoxon rank-sum test showed a significant difference (P = 0.02) of mutational signature exposure between virus-positive and virus-negative head-and-neck tumor samples. The black line indicates the median for each group. e, Gene expression analysis based a t-SNE map of head-and-neck cancer samples shows a distinct gene expression profile for virus-positive samples. Virus-positive and virus-negative samples are shown as red and gray dots, respectively. f, The violin plot of APOBEC3B gene expression for alphapapillomavirus-positive and alphapapillomavirus-negative samples in cervix and head-and-neck cancer (FDR-corrected two-sided Wilcoxon rank-sum test, P = 1.6 × 10−4). FPKM, fragments per kilobase of transcript per million mapped reads. The center line represents the median, and the upper and lower boundaries of the violin plot refer to the maximum and minimum values, respectively. g, Tumor-infiltrating immune cells as quantified by CIBERSORT using RNA-seq samples from patient with head-and-neck cancer. All four cell types showed significant enrichment of immune cells in virus-positive samples (FDR-corrected two-sided Wilcoxon rank-sum test, n = 24 virus negative versus 18 virus positive). Tukey box plots show the median (the middle line) and the 25–75th percentiles (the box); the whiskers show 1.5× the interquartile range from the lower and upper quartile.
Fig. 4
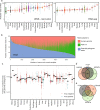
Fig. 4. Expression of ERVs.
a, Heat map showing the expression of HERV across all tumor samples. HERV transcripts per million (TPM) were grouped by family and summed up. Hierarchical clustering was performed by family according to Manhattan distance with complete linkage after log2 transformation of HERV TPM expression values.(RCC, renal cell carcinoma). b, Fraction of active loci in the genome with a TPM > 0.2 plotted against the fraction of samples. c, TPM-based expression of the highly expressed HERVs ERV1 and ERVK across tumor types. n, number of analyzed tumor samples. Violin plots are shown; red dots indicate the median. The upper and lower boundaries of the violin plot extend to the maximum and minimum values. d, Survival difference between patients with kidney cancer expressing high (red) and low levels (blue) of ERV1. Kaplan–Meier curve shows the overall survival of patients (n = 113) with high and low levels of ERV1 with a cut-off of 16.3 TPM (log-rank test P = 0.0081). The number of patients at risk is shown at the bottom.
Fig. 5
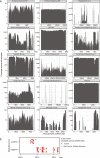
Fig. 5. The effect of virus integration.
a, Integration sites detected in gene regions (including promoter, exon, intron and 5′ UTR regions) are labeled in red for increased gene expression and blue for expression measured. Rows of each heat map designate the nearest genes to the integration sites, and columns represent individual ICGC donor and project IDs. Intragenic HBV integration sites detected in liver cancers (ICGC project codes: LIRI, LIHC and LINC). For TERT and SEMA6D, intergenic integrations are also shown. b, Integration sites detected for HPV16 and HPV18 in head-and-neck (magenta) and cervical (blue) cancers (ICGC project codes: HNSC and CESC). Gene labels with an asterisk indicate HPV18 as opposed to HPV16 viral integrations. c, A local increase in the number of SCNAs was shown in the vicinity of HBV integrations (n = 21 viral integrations in individual patients, P= 7.4 × 10−3; two-sided paired t-test). d, Genomic visualization of the HBV integration sites relative to the TERT gene in five patients with liver tumors. e, The increased gene expression (in FPKM, upper-quartile normalization, UQ) of TERT in two liver tumors with HBV integrations in comparison to the expression of TERT in tumor and non-malignant adjacent tissues. Tumor samples with a non-coding driver mutation are labeled in orange.
Extended Data Fig. 1
Extended Data Fig. 1. Statistics of analyzed reads from WGS and RNA-seq samples.
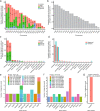
a, Number of identified candidate pathogen reads used for WGS analysis in non-tumor samples and for RNA-seq analysis. Red line represents the median. b, Fraction of analysed reads mapped to phiX174 (green) and the human reference genome hg19 (red) and the rest labeled as potentially pathogenic reads (blue). c, Fraction of analysed reads per genome coverage separated for virus positive and negative tumor samples across organ systems. Thick black line represents the median. d, Search space overlap for genera across the three pipelines. e, Hit space overlap for genera across the three pipelines.
Extended Data Fig. 2
Extended Data Fig. 2. Genome coverage of mastadenovirus contamination detected in batches.
a, Coverage of the virus genomes summarizing all mapped reads across all virus-positive tumor/normal samples. Alignment was done using BWA-mem. b, Mastadenovirus-positive samples ordered based on their sequencing date as years, indicating samples from early-onset prostate cancer (EOPC-DE) project across sequencing batches.
Extended Data Fig. 3
Extended Data Fig. 3. The distribution of PMER values for consensus hits across pathogen detection pipelines.
a, Overlap calculated between three pipelines for the cases of shuffled viral hits randomized for their donor. b, PMER distribution of common viral hits detected by all three pipelines. c, Virus genome equivalents in relation to human tumor genome equivalents calculated for each sample positive for the virus. d, Co-infection of viruses detected in individual tumor samples. The fraction of overlap between two viruses were calculated as the number of shared samples divided by the smaller set.
Extended Data Fig. 4
Extended Data Fig. 4. Specific findings for lymphocrypto- and roseolovirus, HBV and EBV.
Overall contribution of immune cells across organ system in samples positive or negative for lymphocryptovirus and roseolovirus. Tukey boxplot indicates the median by the middle line and the 25–75th percentiles by the box. The whiskers were drawn up to the 1.5 interquartile range from the lower and upper quartile. b, Comparison of histopathologically detected HBV in liver cancer with the PMERs detected in WGS. Precision and recall of the PCR based HBV test versus the consensus calls from WGS data. Red dot indicates the PMER cut-off of 1. c, Relation of PMER for EBV detections in tumor and normal samples across organ system and normal tissue type. d, Epstein-Barr virus expression presenting lytic (red) and latent (green) genes across organ systems. Reads were counted after alignment with kallisto to the EBV reference transcriptome (see Methods).
Extended Data Fig. 5
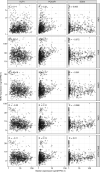
Extended Data Fig. 5. Expression of stem cell markers in relation to HERV expression.
Expression values of KLF4, POU5F1 and SOX2 in relation to transcriptional activity of HERVs (ERV, ERV1, ERVK, ERVL, ERVL.MaLR) for 908 tumor samples. Correlation coefficient (R) presented is calculated using Spearman Rank Correlation.
Extended Data Fig. 6
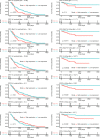
Extended Data Fig. 6. Overall Survival analysis of endogenous retrovirus expression in different tissue types.
Cut-offs were defined by maxstat R package using log-rank test and. P values were corrected for multiple testing of variable cut-offs using Lau2 method. Analyzed were all tissue types with more than 40 cases and at least 15 events. Number of patients at risk is provided separated by high or low expression groupings based on the tpm cutoff for the respective ERV family provided in the title of individual panels. P-value of the log-rank test is provided for each analysis.
Extended Data Fig. 7
Extended Data Fig. 7. Number of viral integration events as a function of the chromosome and genomic location.
a, Shows the number of viral integration events detected for HBV, HPV16 and HPV18 as a function of the human chromosome. Numbers within each stacked bar plot represent the number of integration events detected for each virus and within each chromosome. b, Shows the percentage of the total number of integration events detected for each chromosome averaged over three viral types shown in panel A. c, Number of viral integration events detected for HBV, HPV16 and HPV18 as a function of the host’s genomic location. Numbers within each stacked bar plot represent the number of integration events detected for each virus and within each genomic location. d, Shows the percentage of the total number of integration events detected within each genomic location averaged over three viral types shown in panel C. e, Shows the number of HBV integration events detected in liver cancers in the host’s gene coding and/or gene promoter regions. Stacked bar plot represents the number of integration events detected within each sample and each gene, each sample is indicated using the color code shown in the legend to the right. f, Shows the number of HPV18 integration events detected in head/neck and cervical cancers in the host’s gene coding or gene promoter regions. g, Shows the number of HPV16 integration events detected in head/neck and cervical cancers in the host’s gene coding and/or gene promoter regions.
Extended Data Fig. 8
Extended Data Fig. 8. Comparison of the somatic copy number alterations (SCNA) and single nucleotide variants (SNVs) for samples with and without HPV and HBV integrations into human genome.
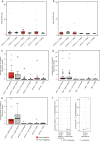
a, Boxplots showing the number of SCNA detected in head/neck and cervical cancers: HPV16+(red) vs HPV16- (grey) samples. SCNAs are calculated using three different distances from the integration site: i) greater than 1 Megabases (Mbp), ii) exactly +/− 1 Mbp away, and iii) below 1 Mbp (n = 17 virus integrations). b, Boxplots showing the number of SCNAs detected in head/neck and cervical cancers with and without HPV18 integrations (n = 8 virus integrations). c, Number of SNVs detected in head/neck and cervical cancers with and without HPV16 integrations. Number of SNVs are calculated using three different ranges for the human genome: i) SNVs within the nearest gene to the virus integration site (maximum: 50Kb), ii) SNVs at the location of the viral integration site in the chromosomal region +/− the position of the second breakpoint located in the viral sequence, and iii) SNVs around 10 kb of the viral integration site. Blue triangles indicate the mean values. (n = 87 virus integrations) d, Number of SNVs detected in liver cancers with and without HBV integrations (n = 109 virus integrations). e. Number of SNVs detected in head/neck and cervical cancers with and without HPV18 integrations (n = 14 virus integrations). In all Tukey boxplots, black line in the middle represents median and the 25–75th percentiles by the box. The whiskers were drawn up to the 1.5 interquartile range from the lower and upper quartile. f, Expression of tumors and normal samples for long noncoding RNAs with and without HPV16 integrations near to the integration site.
Extended Data Fig. 9
Extended Data Fig. 9. Contigs from de novo assembly identified as possibly originating from novel viral species or strains.
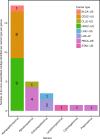
Barplot showing the number of contigs obtained using the CaPSID’s de novo assembly step (see Methods) within each genus. Taxonomic classification for each contig was performed using the CSSSCL algorithm. Each of the 29 contigs considered for this plot had to have a sequence homology <90% when aligned to any known sequence contained by the latest nucleotide BLAST database. The legend to the right indicates the following ICGC project codes: BLCA—bladder cancer, CESC—cervical cancer, CLLE—chronic lymphocytic leukemia, HNSC—head and neck, LIHC and LIRI—liver cancer, PBCA—pediatric brain cancer, and STAD—stomach cancer.

Similar articles

Cited by

References

    1. Parkin DM. The global health burden of infection-associated cancers in the year 2002. Int. J. Cancer. 2006;118:3030–3044. doi: 10.1002/ijc.21731. - DOI - PubMed
    1. Plummer M, et al. Global burden of cancers attributable to infections in 2012: a synthetic analysis. Lancet Glob. Health. 2016;4:e609–e616. doi: 10.1016/S2214-109X(16)30143-7. - DOI - PubMed
    1. Bouvard V, et al. A review of human carcinogens—part B: biological agents. Lancet Oncol. 2009;10:321–322. doi: 10.1016/S1470-2045(09)70096-8. - DOI - PubMed
    1. Muñoz N, Castellsagué X, de González AB, Gissmann L. Chapter 1: HPV in the etiology of human cancer. Vaccine. 2006;24:S1–S10. doi: 10.1016/j.vaccine.2006.05.115. - DOI - PubMed
    1. Bialecki ES, Di Bisceglie AM. Clinical presentation and natural course of hepatocellular carcinoma. Eur. J. Gastroenterol. Hepatol. 2005;17:485–489. doi: 10.1097/00042737-200505000-00003. - DOI - PubMed

Publication types

LinkOut - more resources