. 2020 Apr 6;217(4):e20191869.
doi: 10.1084/jem.20191869.

Tissue-resident macrophages in omentum promote metastatic spread of ovarian cancer

Affiliations

Tissue-resident macrophages in omentum promote metastatic spread of ovarian cancer

Anders Etzerodt et al. J Exp Med. .

Abstract

Experimental and clinical evidence suggests that tumor-associated macrophages (TAMs) play important roles in cancer progression. Here, we have characterized the ontogeny and function of TAM subsets in a mouse model of metastatic ovarian cancer that is representative for visceral peritoneal metastasis. We show that the omentum is a critical premetastatic niche for development of invasive disease in this model and define a unique subset of CD163+ Tim4+ resident omental macrophages responsible for metastatic spread of ovarian cancer cells. Transcriptomic analysis showed that resident CD163+ Tim4+ omental macrophages were phenotypically distinct and maintained their resident identity during tumor growth. Selective depletion of CD163+ Tim4+ macrophages in omentum using genetic and pharmacological tools prevented tumor progression and metastatic spread of disease. These studies describe a specific role for tissue-resident macrophages in the invasive progression of metastatic ovarian cancer. The molecular pathways of cross-talk between tissue-resident macrophages and disseminated cancer cells may represent new targets to prevent metastasis and disease recurrence.


Conflict of interest statement

Disclosures: Dr. Etzerodt reported personal fees from Stipe Therapeutics outside the submitted work. No other disclosures were reported.

Figures

None
Graphical abstract
Figure 1.
Figure 1.
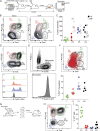
Omentum is a critical premetastatic niche for ovarian cancer cells. (A) Location of the omentum in the abdominal cavity of mice. (B) In vivo bioluminescence imaging of mice at 1, 21, 35, and 63 d after i.p. injection of 106 ID8-Luc cells; scale bar: 1 cm. (C) H&E stain of frozen omental sections from naive mice or 35 and 63 d after injection of ID8-Luc cells; scale bar: 100 µm. (D) Ex vivo luminescence analysis of omentum and ascites. RLU, relative luminescent unit. Data are represented as mean ± SEM of n = 5, and statistically significant difference was calculated using two-way ANOVA followed by Tukey post hoc test; ***, P < 0.001. (E) Tumor nodules on the diaphragm of mice 10 wk after injection of ID8-Luc cells. (F) In vivo bioluminescence analysis of omentectomized, sham-operated, or control (Ctrl) mice from 0–63 d after injection of ID8-Luc cells. cps, counts per second. Data are represented as mean ± SEM of n = 5, and statistically significant difference was calculated using two-way ANOVA followed by Tukey post hoc test; **, P < 0.01. (G) End-point analysis of malignant ascites in omentectomized or control mice 63 d after injection of ID8-Luc cells. Data are represented as mean ± SEM of n = 5, and statistically significant difference was calculated using Kruskal-Wallis one-way ANOVA followed by Dunn’s multiple comparisons test; *, P < 0.05. All data are representative of two independent experiments.
Figure 2.
Figure 2.
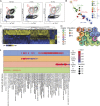
Single-cell transcriptional profiling of omental macrophages after tumor colonization. (A) Whole-mount confocal imaging of omentum showing the location of FALCs by visualizing collagen IV (ColIV, green), adipocytes (LipidTox, red), and leukocyte clusters (CD45, white); scale bar: 0.5 mm. (B) Whole-mount imaging of ID8-Luc infiltration in the omentum 24 h after injection of ID8 cells. Pecam-1 staining for blood vessels (red), CD163 for macrophages (green), CD45 for FALCs (white), and Qdot705 for ID8 cells (magenta); scale bar: 100 µm and 50 µm in magnification. (C) Two-dimensional representation and clustering of single-cell TAM transcriptomes using UMAP (n = 16,514). (D) Heatmap showing the top 10 DEGs in each UMAP cluster. (E) Violin plots showing expression of commonly used macrophage markers.
Figure 3.
Figure 3.
Characterization of macrophage subsets in omentum by flow cytometry and confocal microscopy. (A) Flow cytometry analysis of the myeloid cell compartment in omentum. Myeloid cells are gated as (i) Live, CD45.2+, singlets, Linneg (CD5, CD19, NK1.1, Ly6G, Siglec F), CD11b+, and subsequently macrophages were gated as F4/80+, CD64+. Monocytes were gated as (ii) F4/80, CD64, CCR2+. F4/80, CD64, and CCR2 CD11b+ myeloid cells were designated as other. F4/80+ CD64+ macrophages were further gated based on (iii) CD169 and Lyve-1 expression, and finally CD169hi Lyve-1+ cells were further divided into four subpopulations based on (iv) CD163 and Tim4 expression. SSC-A, side scatter area. (B) Whole-mount imaging of FALCs (CD45, white; CD169+, red; CD163+, green) in the omentum; scale bar: 100 µm. (C) Whole-mount imaging of FALCs (CD45, white; CD163+, green; Tim4+, red) in omentum; scale bar: 50 µm. (D) Flow cytometry analysis and relative distribution of CD11b+ myeloid cell populations shown in A, i–iii during tumor growth. (E) Flow cytometry analysis and relative distribution of CD169hi Lyve-1+ macrophage subsets shown in A, iv during tumor growth. Whole-mount confocal imaging analysis is representative of n = 4 in two independent experiments. Flow cytometric data are represented as mean ± SEM of n = 4 and are representative of two independent experiments.
Figure S1.
Figure S1.
Gating strategy and expression of Tim4 and CD163 on omental macrophages. (A) Gating strategy for the myeloid cell compartment excluding neutrophils. Myeloid cells were gated as Live (forward scatter area [FSC-A] versus Sytox Blue), CD45.2+ (CD45.2 versus SSC-A), CD5, CD19 (CD5 versus CD19), Linneg(NK1.1, Ly6G), CD11b+ (CD11b versus Lineage), single cells (forward scatter height [FSC-H] versus forward scatter width [FSC-W]), and CD64+ and F4/80+ (F4/80 versus CD64). (B) Expression of CD163 and Tim4 among F4/80+ CD64+ macrophages that are CD169negLyve-1neg (green), CD169int Lyve-1neg (red), or CD169hi Lyve-1pos (blue). Data are representative of two independent experiments.
Figure 4.
Figure 4.
Embryonic origin of tissue-resident CD163+ Tim4+ macrophages in omentum. (A) Analysis of macrophage ontogeny in ID8 tumor-bearing mice using shielded chimeras; host CD45.1 congenic mice were placed in a protective lead shield with only the hind legs exposed, before irradiation at 9 Gy. The following day, mice were reconstituted with donor bone marrow cells from CD45.1/.2 F1 mice. 5 wk after reconstitution, mice were injected with 106 ID8-Luc cells i.p. At 8 wk after tumor injection, omentum was collected for analysis by flow cytometry. (B) Analysis of CD163 and Tim4 expression among CD169hi Lyve-1+ macrophages in omentum from naive and tumor-bearing chimeric mice. (C) Chimerism was calculated as the proportion of CD45.1/.2+ CD169hi Lyve-1+ macrophages relative to CD45.1/.2+ expression among Ly6Chi blood monocytes. Data are represented as mean ± SEM of n = 5, and statistically significant difference was calculated using two-way ANOVA followed by Tukey post hoc test; ***, P < 0.001. (D and E) Flow cytometry analysis of Cx3Cr1-GFP expression in CD169hi Lyve-1+ macrophages (P1–4; D) and CCR2+ monocytes (E). (F) Fate-mapping of Cx3Cr1-expressing monocytes in Cx3cr1-R26tdRFP mice inoculated with ID8-Luc cells. Mice were injected with ID8-Luc i.p., and after 8 wk, 1 mg of tamoxifen was administered by oral gavage, and RFP expression was analyzed in CD169hi Lyve-1+ macrophages 10 d later. Data are represented as mean ± SEM of n = 4. (G) Analysis of CD169hi Lyve-1+ macrophage ontogeny by pulse-labeling of Cx3Cr1R26YFP embryos with tamoxifen at E16.5. (H) Omentum was harvested and analyzed by flow cytometry 8 wk after birth. (I) The percentage of YFP+ cells was calculated relative to YFP+ microglia. Data are represented as mean ± SEM of n = 6. All data are representative of two independent experiments.
Figure S2.
Figure S2.
Fate mapping of omental macrophages. (A and B) Flow cytometric analysis of blood monocytes in mice 5 wk (A) or 13 wk (B) after adoptive transfer of CD45.1+/CD45.2+ donor bone marrow in irradiated CD45.1+ host mice that were protected by a lead shield. Monocytes were gated as Live (FSC-A versus Sytox Blue), CD5neg, CD19neg (CD5 versus CD19), NK1.1neg, CD11b+ (CD11b versus NK1.1), and Ly6C+, Ly6Gneg (Ly6C versus Ly6G). Data are represented as mean ± SEM of n = 5. (C) Flow cytometric analysis of YFP+ microglia in Cx3Cr1CreER:R26-yfp mice pulse-labeled with tamoxifen at E16.5. Microglia were gated as Live (FSC-A versus Sytox Blue), Ly6Cneg, CD11cneg (Ly6C versus CD11c), and CD45.2dim, CD11bhi (CD11b versus CD45.2). Data are represented as mean ± SEM of n = 6. All data are representative of two independent experiments.
Figure 5.
Figure 5.
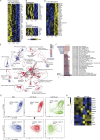
CD163+ Tim4+ tissue-resident macrophages express a unique transcriptional profile. (A) Gating strategy for cell sorting of P1, P2, and P3 populations of omental macrophages from naive (n = 2) and tumor-bearing mice at 5 and 10 wk after injection of ID8 cells (n = 4). 500 cells were sorted for each population and subjected to bulk RNAseq analysis. (B) PCA and network analysis of variable gene expression in P1, P2, and P3 macrophages. PCA analysis was performed on normalized data (mean = 0, and variance = 1), generating a correlation-based PCA plot. Network analysis connects k nearest neighbors (k = 3) based on similarity calculated by Pearson correlation. (C) Heatmap showing hierarchical clustering of the 5,000 most DEGs for each of the three populations at 10 wk of tumor growth. DEGs were identified by pairwise comparison with a cut-off of Padjusted > 0.01. (D) SOMs of identified DEGs using the Kohonen package for R. The SOM analysis found 16 single SOMs that were subsequently grouped by hierarchical clustering to identify population-specific clusters (clusters 1–7). The magnitude of the pie slices indicates the relative proportions of genes enriched in P1 (green), P2 (brown), and P3 (blue) within the SOM. (E) ClusterProfiler enrichment analysis against the GO database on SOM clusters 1–7. Only clusters with significantly enriched pathways are visualized. Libraries were prepared from two independent experiments with n = 2 and sequenced on the same flow cell for a total of four biological replicates. ERAD, endoplasmic reticulum–associated protein degradation; pos, positive.
Figure S3.
Figure S3.
Hierarchical clustering analysis of omental macrophages. (A) Heatmap showing hierarchical clustering analysis of the 5,000 most DEGs in P1 (green), P2 (red), and P3 (blue) CD169hi Lyve-1pos omental macrophages sorted at steady state (0 wk) or 5 wk and 10 wk after infiltration of ID8 ovarian cancer cells. (B) Heatmap showing expression of macrophage markers from transcriptomic analysis of P1 (green), P2 (red), and P3 (blue) CD169hi Lyve-1pos omental macrophages sorted 10 wk after ID8 injection (Fig. 2 E). Libraries were prepared from two independent experiments with n = 2 and sequenced on the same flow cell for a total of four biological replicates.
Figure S4.
Figure S4.
Depletion of monocyte-derived and tissue-resident omental macrophages. (A and B) Flow cytometric analysis of CD169hi Lyve-1pos omental macrophages in Ccr2−/− mice 10 wk after i.p. injection of 106 ID8 ovarian cancer cells. Data are represented as mean ± SEM of n = 5, and statistically significant difference was calculated using two-way ANOVA followed by Tukey post hoc test; *, P < 0.05; ****, P < 0.0001. (C and D) Omentum weight (C) and number of tumor cells in ascites (D) of WT and Ccr2−/− mice 10 wk after injection of ID8 cells. Data are represented as mean ± SEM of n = 6, and statistically significant difference was calculated using Mann-Whitney U test; *, P < 0.05. (E–G) Flow cytometric analysis of CD169hi Lyve-1pos omental macrophages in Cd163-Csf1rDTR mice 1 d (E) or 6 d (F and G) after i.p. injection of 4 ng/kg DT. CD169hi Lyve-1pos omental macrophages were gated as described in Fig. S1 A. (H) Flow cytometric analysis of peritoneal macrophages in Cd163-Csf1rDTR and control mice 6 d after i.p. injection of 4 ng/kg DT. Peritoneal macrophages were gated as Live, CD45.2pos, Linneg(CD5,CD19, Ly6G, NK1.1) CD11b+, F4/80+, and MHCIIneg. Data are represented as mean ± SEM of n = 7, and statistically significant difference was calculated using Mann-Whitney U test; *, P < 0.05. All data are representative of two independent experiments.
Figure 6.
Figure 6.
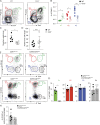
Specific depletion of CD163+ Tim4+ tissue-resident macrophages prevents metastatic spread of ovarian cancer. (A) Cohorts of Cd163-Csf1rDTR or control mice (Csf1rLSL-DTR) were injected with 4 ng/kg DT 6 d before transplantation with ID8 cells. Mice were analyzed for depletion of macrophages and effects on tumor growth at 10 wk. (B and C) Flow cytometry analysis of CD163hi Lyve-1+ macrophages in omentum of Cd163-Csf1rDTR and Csf1rLSL-DTR mice 10 wk after injection of ID8 cells. (D–F) Omentum weight (D), total tumor cells in ascites (E), and ascites volume (F) in Cd163-Csf1rDTR and Csf1rLSL-DTR mice treated with DT. (G and H) Ex vivo bioluminescence analysis of metastases on the diaphragm of Cd163-Csf1rDTR and Csf1rLSL-DTR; scale bar: 0.5 cm. Data are represented as mean ± SEM of n = 7, and statistically significant difference was calculated using Mann-Whitney U test; *, P < 0.05; **, P < 0.01; ***, P < 0.001. (I) Therapeutic depletion of CD163+ macrophages; mice were injected with ID8 cells and after 5 wk randomized into groups and treated with dxr-loaded αCD163-LNPs (αCD163-dxr), empty αCD163-LNPs (αCD163-ctrl), or PBS alone twice a week for 5 wk. (J) Tumor burden monitored by in vivo bioluminescent imaging. Data are represented as mean ± SEM of n = 6, and statistically significant difference was calculated using two-way ANOVA followed by Tukey post hoc test; *, P < 0.05; ***, P < 0.001. (K) Flow cytometry analysis of P1–P4 macrophages in omentum after therapeutic depletion of CD163+ cells. (L–N) Omentum weight (L), total tumor cells in ascites (M), and ascites volume (N). Data are represented as mean ± SEM of n = 6, and statistically significant difference was calculated using Kruskal-Wallis one-way ANOVA followed by Dunn’s multiple comparisons test; *, P < 0.05; **, P < 0.01; ***, P < 0.001. All data are representative of three independent experiments.
Figure S5.
Figure S5.
Transcriptomic analysis of ID8 ovarian cancer cells and TAMs from omentum. (AD) Heatmaps showing expression of genes associated with the enriched pathways in Fig. 5 E: Positive regulation of JAK-STAT (A), angiogenesis (B), regulation of tissue remodeling (C), and T cell differentiation (D). (E) GO term enrichment analysis of RNAseq data comparing cultured ID8 cells (n = 4) and ID8 cells harvested from ascites 11 wk after transplantation in vivo (ID8-A11, n = 4). Identified GO terms are represented by nodes with a size according to the number of enriched genes. Nodes are colored according to the normalized enrichment score (NES). (F) GSEA comparing ID8 and ID8-A11 against the hallmark gene sets in MSigDB. (G) Flow cytometric analysis of CSC markers CD54, CD55, CD106, and CD117 on tumor cells from ascites of mice specifically depleted of Tim4+ CD163+ resident TAM (αCD163-dxr). Mice were injected i.p. with 1 mg/kg αCD163-dxr or controls (empty αCD163-LNP or PBS) on days 1, 3, and 5, before injection of ID8-Luc cells i.p. on day 8. 10 wk after ID8, tumor cells in ascites were harvested and analyzed for CSC marker expression by flow cytometry by gating on Live, CD45.2neg, and Linneg(CD11b, F4/80, CD5,CD19, Ly6G, NK1.1) cells. (H) Heatmap showing expression levels of TFs involved in EMT and MET in ID8 and ID8-A11 cells. All data are representative of three independent experiments.
Figure 7.
Figure 7.
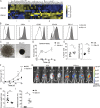
Ovarian cancer cells in ascites acquire CSC characteristics. (A) Heatmap showing expression of CSC markers in omental ID8 cells (ID8-OM) and ID8 cells from ascites (ID8-A11); see Table S1 for details. (B) Flow cytometry analysis of CSC surface markers on ascitic ID8-A11 cells compared with ID8 cells in omentum (ID8-OM). (C and D) Spheroid formation assay comparing cultured ID8 and ID8-A11 cells; 4 × 10⁴ cells were seeded in ultra-low-adherence 96-well plates, and formation of spheroids was assessed with a wide-field microscope. (E) Analysis of ALDH activity in ID8 and ID8-A11 cells by flow cytometry using the Aldefluor assay. ALDH+ cells were gated using DEAB-treated cells as negative control (left), and relative ALDH activity was calculated by measuring the median fluorescence intensity of Aldefluor. Data are represented as mean ± SEM of n = 5 (ID8) or n = 8 (ID8-A11), and statistically significant difference was calculated using Mann-Whitney U test; *, P < 0.05; **, P < 0.01. (F) Analysis of tumorigenic potential of ID8 and ID8-A11 cells in vivo; total tumor burden was monitored by in vivo bioluminescence imaging. Data are represented as mean ± SEM of n = 6, and statistically significant difference was calculated using two-way ANOVA followed by Tukey post hoc test; **, P < 0.01; ****, P < 0.0001. (G) Representative images of tumor localization at 30 d after injection of parental ID8-Luc and ID8-A11 cells; scale bar: 1 cm. (H and I) Ex vivo analysis of tumor burden in omentum (H) and ascites (I) at 30 d after transplantation of ID8-Luc or ID8-A11 cells. Data are represented as mean ± SEM of n = 6 (ID8) or n = 5 (ID8-A11), and statistically significant difference was calculated using Mann-Whitney U test; **, P < 0.01. All data are representative of two independent experiments.
Figure 8.
Figure 8.
CD163+ Tim4+ tissue-resident macrophages promote the CSC-like phenotype of ovarian cancer cells. (A) Specific depletion of CD163+ Tim4+ (P4) macrophages using dxr-loaded αCD163-LNPs (αCD163-dxr); mice were injected i.p. with 1 mg/kg αCD163-dxr or controls (empty αCD163-LNPs or PBS) on days 1, 3, and 5, before injection of ID8-Luc cells on day 8. (B and C) Flow cytometry analysis of CD163hi Lyve-1+ macrophages in omentum at 10 wk after prophylactic treatment with αCD163-dxr. Data are represented as mean ± SEM of n = 5 (PBS, αCD163-LNP) or n = 6 (αCD163-dxr), and statistically significant difference was calculated using Kruskal-Wallis one-way ANOVA followed by Dunn’s multiple comparisons test; *, P < 0.05; **, P < 0.01. (D–F) Omentum weight (D), total tumor cells in ascites (E), and ascites volume (F) at 10 wk after prophylactic treatment with αCD163-dxr. (G) Ex vivo bioluminescence analysis of metastases on the diaphragm. Data are represented as mean ± SEM of n = 8, and statistically significant difference was calculated using Kruskal-Wallis one-way ANOVA followed by Dunn’s multiple comparisons test; *, P < 0.05; **, P < 0.01. (H) tSNE map of concatenated fcs files from flow cytometry analysis of tumor cells from ascites after prophylactic treatment with αCD163-dxr. tSNE parameters were computed on expression levels of CSC markers (CD44, CD54, CD55, CD106, CD117, CD140a, and EpCam), and individual sample files were color-coded according to treatment group (PBS, blue; αCD163-ctl, red; αCD163-dxr, green; n = 8). This analysis identified distinct clusters from control-treated mice (PBS or αCD163-LNP; C1, black) and αCD163-dxr–treated mice (C2, gray). Expression of the individual CSC markers was subsequently visualized by heatmap statistics in a tSNE map of the concatenated samples within C1 (PBS or αCD163-LNP) and C2 (αCD163-dxr; right). (I) Flow cytometry analysis identifying the proportion of malignant cells expressing specific CSC markers: CD54, CD55, CD106, and CD117. See Fig. S5 G for the gating strategy. Data are represented as mean ± SEM of n = 8, and statistically significant difference was calculated using Kruskal-Wallis one-way ANOVA followed by Dunn’s multiple comparisons test; **, P < 0.01. (J) Gene expression analysis of Gata3, Stat3, Wnt5a, and Mertk in tumor cells from omentum after specific depletion of CD163+ Tim4+ (P1) macrophages, as described in A. dCT, delta cycle threshold. Data are represented as mean ± SEM of n = 6, and statistically significant difference was calculated using Kruskal-Wallis one-way ANOVA followed by Dunn’s multiple comparisons test; *, P < 0.05; **, P < 0.01. A–G are representative of three independent experiments, whereas H–J are representative of two independent experiments.

Comment in

Similar articles

Cited by

References

    1. Abubaker K., Luwor R.B., Zhu H., McNally O., Quinn M.A., Burns C.J., Thompson E.W., Findlay J.K., and Ahmed N.. 2014. Inhibition of the JAK2/STAT3 pathway in ovarian cancer results in the loss of cancer stem cell-like characteristics and a reduced tumor burden. BMC Cancer. 14:317 10.1186/1471-2407-14-317 - DOI - PMC - PubMed
    1. AlHossiny M., Luo L., Frazier W.R., Steiner N., Gusev Y., Kallakury B., Glasgow E., Creswell K., Madhavan S., Kumar R., and Upadhyay G.. 2016. Ly6E/K signaling to TGFβ promotes breast cancer progression, immune escape, and drug resistance. Cancer Res. 76:3376–3386. 10.1158/0008-5472.CAN-15-2654 - DOI - PMC - PubMed
    1. Bapat S.A., Mali A.M., Koppikar C.B., and Kurrey N.K.. 2005. Stem and progenitor-like cells contribute to the aggressive behavior of human epithelial ovarian cancer. Cancer Res. 65:3025–3029. 10.1158/0008-5472.CAN-04-3931 - DOI - PubMed
    1. Baratin M., Simon L., Jorquera A., Clément C., Dembele D., Nowak J., Gentek R., Weinert S., Klauschen F., Malissen B., et al. . 2017. T Cell Zone Resident Macrophages Silently Dispose of Apoptotic Cells in the Lymph Node. Immunity. 47:349–362. 10.1016/j.immuni.2017.07.019 - DOI - PubMed
    1. Bénézech C., Luu N.-T., Walker J.A., Kruglov A.A., Loo Y., Nakamura K., Zhang Y., Nayar S., Jones L.H., Flores-Langarica A., et al. . 2015. Inflammation-induced formation of fat-associated lymphoid clusters. Nat. Immunol. 16:819–828. 10.1038/ni.3215 - DOI - PMC - PubMed

Publication types

MeSH terms