. 2020 Jan 17;367(6475):eaay0524.
doi: 10.1126/science.aay0524.

VISTA is a checkpoint regulator for naïve T cell quiescence and peripheral tolerance

Affiliations

VISTA is a checkpoint regulator for naïve T cell quiescence and peripheral tolerance

Mohamed A ElTanbouly et al. Science. .

Abstract

Negative checkpoint regulators (NCRs) temper the T cell immune response to self-antigens and limit the development of autoimmunity. Unlike all other NCRs that are expressed on activated T lymphocytes, V-type immunoglobulin domain-containing suppressor of T cell activation (VISTA) is expressed on naïve T cells. We report an unexpected heterogeneity within the naïve T cell compartment in mice, where loss of VISTA disrupted the major quiescent naïve T cell subset and enhanced self-reactivity. Agonistic VISTA engagement increased T cell tolerance by promoting antigen-induced peripheral T cell deletion. Although a critical player in naïve T cell homeostasis, the ability of VISTA to restrain naïve T cell responses was lost under inflammatory conditions. VISTA is therefore a distinctive NCR of naïve T cells that is critical for steady-state maintenance of quiescence and peripheral tolerance.


Figures

Fig. 1.
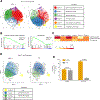
Fig. 1.. Intrinsic VISTA deficiency alters heterogeneity in the naïve CD4+ T cell pool.
(A to C) scRNA-seq was performed on naïve CD4+ T cells from WT mice and CD4-Cre-VISTA−/− mice (for which VISTA deficiency is restricted to the CD4+ T cell compartment). (A) t-Distributed stochastic neighbor embedding (t-SNE) plot showing the cluster distribution of FACS-sorted single naïve (>99%) (CD62Lhi CD44lo) CD4+ T cells (sorted on the basis of the 20% lowestCD44 from the negative gate) from CD4-Cre-VISTA−/− and WT littermates. Each dot corresponds to one single cell, colored according to cell cluster. The biological annotation of each cluster is shown in the table on the right. The dashed circles indicate the quiescent T cell cluster (cluster 1) and memory-like naïve T cell cluster (cluster 2). (B) Gene set enrichment analysis (GSEA) pathway enrichment plot indicating the representative gene sets enriched in VISTA−/− versus WT CD4+ T cells. Normalized enrichment score (NES) and P values are shown for each gene set. P values were calculated by Kolmogorov-Smirnov test. (C) Heatmap showing GSEA analysis as performed in (B) for each cluster. The NES is shown for each gene set across clusters. (D) Uniform manifold approximation and projection (UMAP) plot showing the cluster distribution of FACS-sorted single naïve (>99%) (CD62Lhi CD44lo) CD4+ T cells from VISTA−/− and WT mice. For (A) to (D), data are representative of two independent experiments with at least three mice per group. (E) Ratios of recovered WT versus VISTA−/− CD4+ T cells 5 days after coadoptive transfer into Rag1−/− hosts within vivo anti-CD3 stimulation or control immunoglobulin G (IgG). Data are representative of four independent experiments with at least four mice per group. Each bar indicates the mean value, and each error bar refers to one standard deviation (SD). Student’s t tests were performed to compare WT with VISTA deficiency (VISTA−/−) under each condition (i.e., no treatment versus anti-CD3).
Fig. 2.
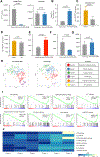
Fig. 2.. Agonistic anti-VISTA antibodies augment T cell tolerance, which is abrogated by VISTA deficiency.
(A) Recovered numbers of OT-II CD4+ T cells in the spleen of anti-mVISTA (8G8)–treated or hamster IgG control–treated mice transferred into Act-Ova (left) or B6 hosts (right) 48 hours after adoptive transfer. (B) Percentage of dead OT-II CD4+ T cells out of total recovered OT-II cells from anti-mVISTA (8G8)–treated or hamster IgG control–treated mice. Data are representative of two independent experiments with five mice per group. (C) Two doses of 2w1s peptide (100 µg) were intravenously injected into WT or VISTA−/− mice on days 0 and 3, respectively, followed by tetramer enrichment and 2w1s:I-Ab cell number quantification on day 7. (D) 2w1s peptide (100 µg) with 5 ug of LPS was intravenously injected into WT or VISTA−/− mice on day 0, followed by tetramer enrichment and 2w1s:I-Ab cell number quantification on day 7. (E) Two doses of 2w1s peptide were intravenously injected into antagonistic anti-mVISTA (13F3)–treated or hamster IgG control–treated mice on days 0 and 3, respectively, followed by tetramer enrichment and 2w1s:I-Ab cell number quantification on day 7. (F) Two doses of 2w1s peptide were intravenously injected into agonistic anti-hVISTA (803)–treated or isotype control–treated mice on days 0 and 3, respectively, followed by tetramer enrichment and 2w1s:I-Ab cell number quantification on day 7. Data are representative of four independent experiments with at least eight mice per group [(C) to (F)]. (G) 2w1s peptide (100 ug) with 5 ug of LPS was intravenously injected into control IgG–treated or agonistic anti-hVISTA (803)–treated mice on day 0, followed by tetramer enrichment and 2w1s:I-Ab cell number quantification on day 7. Data are representative of two independent experiments with eight mice per group. (H) t-SNE plot showing the cluster distribution of 2w1:I-Ab peptide–induced CD4+ T cells from agonistic anti-hVISTA (803)–treated and control IgG–treated mice. Each dot corresponds to one single cell, colored according to cell cluster. Biological annotation of each cluster is shown in the table on the right. (I) GSEA pathway enrichment plot indicating the representative gene sets depleted in agonistic anti-hVISTA (803)–treated versus isotype control–treated mice. NESs and P values are shown for each gene set. P values were calculated by Kolmogorov-Smirnov test. (J) Heatmap showing GSEA analysis as performed (I) for each cluster. NESs are shown for each gene set across clusters. Sequencing data are representative of two independent repeats with at least two samples from pooled mice per group. For all bar plots [(A) to (G)], each bar indicates the mean value and each error bar refers to one SD; P values were calculated by Student’s t test.
Fig. 3.
Fig. 3.. VISTA expression is reduced under inflammatory, but not tolerogenic, conditions in vivo.
To provide a model of antigen-specific stimulation for the antigen-specific CD4+ T cell repertoire studies in Fig. 2, C57BL/6 mice were either immunized using 2w1s peptide with LPS or tolerized using 2w1s peptide only. Then, the phenotype of 2w1s:I-Ab–specific CD4+ T cells was analyzed using scRNA-seq and flow cytometry. (A) The t-SNE plot shows the cluster distribution of 2w1:I-Ab peptide–induced CD4+ T cells from immunized (2w1s peptide with LPS) and tolerized (2w1s peptide) mice. Each dot corresponds to one single cell, colored according to cell cluster. The dashed circles indicate the anergic T cell cluster (cluster 3) and T follicular helper T cell cluster (cluster 7). (B) Boxplot depicting the difference in Vsir gene, which encodes VISTA, expression between immunized and tolerized CD4+ T cells across all clusters. The center line refers to the median value for Vsir gene expression. The whisker indicates the 25th to the 75th percentile of Vsir gene, which encodes VISTA, expression. P values were calculated by Wilcoxon rank sum test. (C and D) Flow cytometric analysis of 2w1s:I-Ab–specific CD4+ T cells (C) or total CD4+ T cells (D) under the same tolerization versus immunization conditions presented in (A). The black plot line and shaded region indicate staining of VISTA knockout CD4+ T cells as a biological control. APC, allophycocyanin. (E) Bubble plot showing the average Z-transformed normalized expression of coinhibitory module genes in cluster 3 versus other clusters. The size of each bubble indicates the fraction of cells expressing the represented gene. Data are representative of two independent experiments with at least three mice per group [(A) to (E)].
Fig. 4.
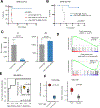
Fig. 4.. VISTA targeting induces systemic tolerance and T cell deletion, whereas VISTA deletion imparts an autoimmune-associated gene signature.
(A) C57BL/6 bone marrow (BM) and splenocytes (107 each) were transferred to lethally irradiated BALB/c recipient mice and treated with antagonist (clone 13F3, red) or agonist (clone 8G8, blue) anti-mVISTA antibodies (200 µg per mouse) on day 0 to induce acute GVHD. Survival was monitored for the indicated time periods. (B) C57BL/6 BM and hVISTA-expressing splenocytes (107 each) were transferred to lethally irradiated BALB/c recipient mice, and anti-hVISTA agonist (clone 803, blue) or IgG control (200 µg per mouse) was administered on day 0 to induce GVHD. Survival was monitored. In all survival experiments, P values were calculated by log rank test. Data from the GVHD models are representative of two independent experiments with at least 10 mice per group. (C) TEa CD4+ T cells (2 × 10⁶ cells per mouse) were transferred into 650-centigray-irradiated F1 hosts (left) or age-and-gender matched C5/B6 hosts (right) and intravenously treated with an anti-mVISTA antibody (clone 8G8) or control IgG followed by analysis of cell numbers on day 2 posttransfer. Data show the mean numbers of recovered TEa T cells for each treatment as percentages of CD4+ T cells. Data are representative of four independent experiments with five mice per group. Each bar refers to the mean value, and each error bar refers to one SD; all P values were calculated by Student’s t test. (D) GSEA pathway enrichment plot indicating the GVHD gene set enriched in VISTA−/− versus WT (top) and anti-hVISTA (clone 803)–treated versus control IgG–treated mice (bottom, obtained from Fig. 2 data). NESs and P values are shown for each gene set. P values were calculated by Kolmogorov-Smirnov test. (E) Receiver operating characteristic (ROC) curves for predicting VISTA mutation status in 2D2 transgenic CD4+ T cells using VISTA-deficiency module score as the predictor. VISTA-deficiency module defines the gene signature resulting from loss of VISTA on the naïve T cell. The inset is a boxplot depicting the difference in the VISTA module scores for 2D2 transgenic CD4+ T cells in VISTA−/− and WT mice. P values were calculated by Wilcoxon rank sum test. (F) Boxplots showing the difference in VISTA module scores between exhausted versus activated CD4+ T cells (left) and CD4+ T cells from SLE patients and healthy individuals (right). P values were calculated by Wilcoxon rank sum test.

Comment in

  • Enforcing T cell innocence.
    Brown C, Rudensky AY. Brown C, et al. Science. 2020 Jan 17;367(6475):247-248. doi: 10.1126/science.aaz7741. Science. 2020. PMID: 31949067 No abstract available.

Similar articles

Cited by

References

    1. Chen L, Flies DB, Molecular mechanisms of T cell co-stimulation and co-inhibition. Nat. Rev. Immunol 13, 227–242 (2013). 10.1038/nri3405; - DOI - PMC - PubMed
    1. Pardoll DM, The blockade of immune checkpoints in cancer immunotherapy. Nat. Rev. Cancer 12, 252–264 (2012). 10.1038/nrc3239; - DOI - PMC - PubMed
    1. Ahn E et al., Role of PD-1 during effector CD8 T cell differentiation. Proc. Natl. Acad. Sci. U.S.A 115, 4749–4754 (2018). 10.1073/pnas.1718217115; - DOI - PMC - PubMed
    1. Noel PJ, Boise LH, Thompson CB, Regulation of T cell activation by CD28 and CTLA4. Adv. Exp. Med. Biol 406, 209–217 (1996). 10.1007/978-1-4899-0274-0_22; - DOI - PubMed
    1. Kuo CT, Veselits ML, Leiden JM, LKLF: A transcriptional regulator of single-positive T cell quiescence and survival. Science 277, 1986–1990 (1997). 10.1126/science.277.5334.1986; - DOI - PubMed

Publication types