. 2020 Jan 8;11(1):111.
doi: 10.1038/s41467-019-13850-7.

Prox1-positive cells monitor and sustain the murine intestinal epithelial cholinergic niche

Affiliations

Prox1-positive cells monitor and sustain the murine intestinal epithelial cholinergic niche

Moritz Middelhoff et al. Nat Commun. .

Abstract

The enteric neurotransmitter acetylcholine governs important intestinal epithelial secretory and immune functions through its actions on epithelial muscarinic Gq-coupled receptors such as M3R. Its role in the regulation of intestinal stem cell function and differentiation, however, has not been clarified. Here, we find that nonselective muscarinic receptor antagonism in mice as well as epithelial-specific ablation of M3R induces a selective expansion of DCLK1-positive tuft cells, suggesting a model of feedback inhibition. Cholinergic blockade reduces Lgr5-positive intestinal stem cell tracing and cell number. In contrast, Prox1-positive endocrine cells appear as primary sensors of cholinergic blockade inducing the expansion of tuft cells, which adopt an enteroendocrine phenotype and contribute to increased mucosal levels of acetylcholine. This compensatory mechanism is lost with acute irradiation injury, resulting in a paucity of tuft cells and acetylcholine production. Thus, enteroendocrine tuft cells appear essential to maintain epithelial homeostasis following modifications of the cholinergic intestinal niche.


Conflict of interest statement

The authors declare no competing interests.

Figures
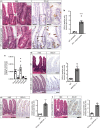
Fig. 1
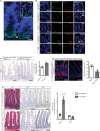
Fig. 1. Epithelial sensing of muscarinic receptor blockade results in selective DCLK1-positive tuft cell expansion.
a, b Histologic analysis of WT (untreated) and scopolamine-treated WT (6 weeks) murine jejunal tissues. Scopolamine treatment provoked selective expansion of DCLK1-positive tuft cells (WT untreated (n = 5), Mean = 0.77, SEM = 0.080; WT + scopolamine 6 weeks (n = 6), Mean = 5.281, SEM = 0.543; unpaired t test, two-tailed, t = 7.453, df = 9); bar graphs left H&E, DCLK1 = 50 µm, magnifications H&E, DCLK1 right = 25 µm. c mRNA analysis of epithelial-enriched jejunal preparations for muscarinic receptors M1R—M5R (Chrm1Chrm5) showed predominant expression of M3R and M1R (n = 6 WT mice). d Analysis of heterozygous M3R-KO mice (whole body-KO) showed significant DCLK1-positive tuft cell expansion (n = 5 WT mice, Mean = 0.77, SEM = 0.080; n = 3 M3R-KO mice, Mean = 3.467, SEM = 0.524; unpaired t test, two-tailed, t = 6.790, df = 6); bar graphs = 100 µm. e Tuft cell expansion similarly resulted from epithelial ablation of M3R employing Vil-Cre × M3R fl/fl mice (n = 5 WT mice, Mean = 0.77, SEM = 0.080; n = 6 Vil-Cre × M3R fl/fl −/− mice, Mean = 4.517, SEM = 0.377; unpaired t test, two-tailed, t = 8.848, df = 9); bar graphs = 100 µm. f Epithelial ablation of M1R employing Vil-Cre × M1R fl/fl mice resulted in modest DCLK1-positive tuft cell expansion (n = 3 mice each group, WT Mean = 0.7, SEM = 0.115; Vil-Cre × M1R fl/fl −/− Mean = 2.733, SEM = 0.367; unpaired t test, two-tailed, t = 5.280, df = 4); bar graphs = 100 µm. Source data are provided as a Source Data file. **p < 0.01, ***p < 0.005, ****p < 0.001.
Fig. 2
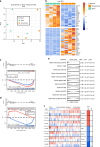
Fig. 2. Muscarinic receptor blockade reduces Lgr5-positive ISC tracing and sensing Prox1-positive endocrine cells primarily orchestrate tuft expansion.
a Immunostainings for M3R showed distribution of the receptor in the crypt base cell compartment (white arrowhead) as well as in cells in positions +4 to +5 of the crypt (white arrow); bar graph top = 50 µm; magnification = 25 µm. b Representative pictures of co-stainings of M3R with intestinal tissue from Lgr5-EGFP-IRES-CreERT2 and induced Prox1-CreERT2 × R26-tdTom mice, respectively, and WT tissue stained for DCLK1, Lysozyme 1, or ChgA (the stainings were repeated at least twice per antibody; positive overlap indicated with white arrowheads); bar graphs = 50 µm. c DCLK1-positive tuft cell frequency within the Lgr5 lineage following M3R ablation in Lgr5-EGFP-IRES-CreERT2 × M3R fl/fl mice 5 days after induction (n = 3 Lgr5-EGFP-IRES-CreERT2 × M3R fl/fl +/+ mice, Mean = 0.917, SEM = 0.088; n = 5 Lgr5-EGFP-IRES-CreERT2 × M3R fl/fl −/− mice, Mean = 1.3, SEM = 0.057; unpaired t test, two-tailed, t = 3.848, df = 6); bar graphs = 100 µm. d Lgr5-positive ISC tracing is reduced following nonselective muscarinic receptor antagonism (n = 4 mice sham, Mean = 1.78, SEM = 0.1151; n = 3 mice scopolamine, Mean = 0.9367, SEM = 0.2050; unpaired t test, two-tailed, t = 3.851, df = 5); bar graphs = 100 µm. e In contrast, ablation of M3R in Prox1-positive endocrine cells resulted in robust DCLK1-positive tuft cell expansions 5 days after induction of Prox1-CreERT2 × M3R fl/fl mice (n = 5 Prox1-CreERT2 × M3R fl/fl +/+ and M3R fl/fl −/− mice for DCLK1, n = 5 Prox1-CreERT2 × M3R fl/fl +/+ mice, n = 4 Prox1-CreERT2 × M3R fl/fl−/− for ChgA; Prox1-CreERT2 × M3R fl/fl +/+ DCLK1 Mean = 1.090, SEM = 0.109; ChgA Mean = 0.77, SEM = 0.054; Prox1-CreERT2 × M3R fl/fl −/− DCLK1 Mean = 4.480, SEM = 0.286, ChgA Mean = 0.588, SEM = 0.031; ordinary two-way ANOVA, DCLK1 t = 14.90, df = 15; ChgA t = 0.7565, df = 15); bar graphs = 100 µm. Source data are provided as a Source Data file. *p < 0.05, **p < 0.01, ****p < 0.001, ns not significant.
Fig. 3
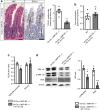
Fig. 3. RNA-sequencing analysis indicates adoption of enteroendocrine differentiation of expanding tuft cells following scopolamine treatment.
a Scopolamine-treated Dclk1-DTR-ZSgreen-positive samples (n = 4 mice) show spatial separation from sham treated samples (n = 4 samples) along PC1 employing principal component analysis (PCA). b Top 25 differentially expressed genes (DEG) between the indicated groups, scale bar indicates log2-fold changes of genes (Z-Scores; positive lgFC indicates higher gene expression in the respective group). c Gene set enrichment analysis (GSEA) indicates negative correlation to previously described tuft-1 (neuronal) and tuft-2 (immune) phenotypes following scopolamine treatment; ES enrichment score. d Instead, tuft cells strongly enrich for enteroendocrine cell lineage signatures. e GSEA analysis of published enteroendocrine signature gene sets shows the adoption of an enteroendocrine progenitor subtype as well as increased differentiation into early and late EC cells, L cells and N cells of expanding tuft cells, (see Supplementary Data 1 for leading edge gene signatures); the enrichment for enterocyte signatures further confirms increased differentiation. EEC enteroendocrine cell, EC enterochromaffin cell, NES normalized enrichment score. f Master regulator analysis shows significant changes in transcription factor activity after scopolamine treatment, such as activation of Srebf2 and inactivation of Nme2, respectively (Z-Scores; Srebf2 p = 0.00086; Hnf4a p = 0.0014; Ewsr1 p = 0.0019; Taf9 p = 0.0019; Nme2 p = 0.0015; Sarnp p = 0.0011; Scand1 p = 0.00012). FDR false discovery rate, Act differential activity (red indicating increased, blue indicating decreased), Exp differential gene expression.
Fig. 4
Fig. 4. Expanding tuft cells orchestrate increased secretion of acetylcholine.
a, b Scopolamine-treated (7 days) ChAT-BAC-eGFP mice showed expansion of ChAT-eGFP-/DCLK1-positive cells (n = 5 sham mice, Mean = 1.11, SEM = 0.125; n = 4 ChAT-BAC-eGFP scopolamine-treated mice, Mean = 3.775, SEM = 0.184; unpaired t test, two-tailed, t = 12.39, df = 7), and prominent cholinergic fibers (arrowhead); bar graphs = 50 µm. c Acetylcholine increases following epithelial M3R ablation (ELISA, whole small intestinal tissues; n = 4 WT mice, Mean = 1.14, SEM = 0.2; n = 5 Vil-Cre × M3R fl/fl −/− mice, Mean = 1.958, SEM = 0.143; unpaired t test, two-tailed, t = 3.425, df = 7). d Immunostainings of Vil-Cre × M3R fl/fl × ChAT fl/fl mice for DCLK1 (n = 5 WT mice, Mean = 0.77, SEM = 0.080; n = 6 Vil-Cre × M3R fl/fl −/− mice, Mean = 4.517, SEM = 0.377; n = 4 Vil-Cre × M3R fl/fl −/− × ChAT fl/fl −/− mice, Mean = 6.763, SEM = 0.844; ordinary one-way ANOVA, F = 38.95, df (total) = 14), bar graphs = 100 µm. e Acetylcholine increases in Vil-Cre × M3R fl/fl × ChAT fl/fl mice (n = 4 WT mice, Mean = 1.14, SEM = 0.2; n = 5 Vil-Cre × M3R fl/fl −/− mice, Mean = 1.958, SEM = 0.143; n = 5 Vil-Cre × M3R fl/fl −/− × ChAT fl/fl −/− mice, Mean = 3.07, SEM = 0.142; ordinary one-way ANOVA, F = 36.12, df (total) = 13). Source data are provided as a Source Data file. *p < 0.05, ***p < 0.005, ****p < 0.001.
Fig. 5
Fig. 5. Cholinergic niche sustains compensatory PI3K signaling following epithelial cholinergic receptor ablation.
a EGFR, Erbb2, and Erbb3 expression in intestinal single cells; TPM transcripts per kilobase million. b Immunoblot analyses of epithelial-enriched Vil-Cre × M3R fl/fl mouse samples for p-EGFR/EGFR, DCLK1, and M3R (n = 3 WT mice p-EGFR/EGFR; 4 WT mice DCLK1, M3R; n = 4 Vil-Cre × M3R fl/fl −/− p-EGFR/EGFR, M3R; 3 Vil-Cre × M3R fl/fl −/− mice DCLK1; WT p-EGFR/EGFR Mean = 0.783, SEM = 0.073; DCLK1 Mean = 1, SEM = 0.234; M3R Mean = 1, SEM = 0.04; Vil-Cre × M3R fl/fl p-EGFR/EGFR Mean = 0.45, SEM = 0.043; DCLK1 Mean = 4.827, SEM = 0.95; M3R Mean = 0.612, SEM = 0.036; multiple t tests; p-EGFR/EGFR t = 4.175, df = 5; DCLK1 t = 4.547, df = 5; M3R t = 7.177, df = 6). c Analysis of Vil-Cre × M3R fl/fl × M1R fl/fl mice shows additive downregulation of EGFR activation compared with Vil-Cre × M3R fl/fl mice (n = 3 Vil-Cre × M3R fl/fl −/− mice, n = 3 Vil-Cre × M3R fl/fl −/− × M1R fl/fl −/− mice; Vil-Cre × M3R fl/fl −/− p-EGFR/EGFR Mean = 1, SEM = 0.076; Vil-Cre × M3R fl/fl −/− × M1R fl/fl −/− p-EGFR/EGFR Mean = 0.260, SEM = 0.080; unpaired t test, two-tailed, t = 6.721, df = 4). d Epithelial M3R ablation sustained PI3K-PDK1 signaling (n = 3 WT, 3 Vil-Cre × M3R fl/fl −/− mice PI3K, PDK1; n = 3 WT mice p-Akt/Akt, n = 4 Vil-Cre × M3R fl/fl −/− mice p-Akt/Akt; WT PI3K Mean = 1, SEM = 0.144; PDK1 Mean = 1, SEM = 0.799; p-Akt/Akt Mean = 1, SEM = 0.103; Vil-Cre × M3R fl/fl −/− PI3K Mean = 1.844, SEM = 0.069; PDK1 Mean = 5.906, SEM = 1.697; p-Akt/Akt Mean = 0.941, SEM = 0.142; multiple t tests; PI3K t = 5.278, df = 4; PDK1 t = 2.617, df = 4, p = 0.059; p-Akt/Akt t = 0.3102, df = 5). Source data are provided as a Source Data file. *p < 0,05, **p < 0.01, ***p < 0,005.
Fig. 6
Fig. 6. Acute tissue injury abrogates compensatory tuft cell circuit following epithelial M3R ablation.
a H&E and DCLK1 immunostainings 3 days after 10.5 Gy WBI (n = 6 Vil-Cre × M3R fl/fl −/− mice, Mean = 4.517, SEM = 0.377; n = 4 Vil-Cre × M3R fl/fl −/− + IR 10.5 Gy mice, Mean = 1.6, SEM = 0.185; unpaired two-tailed t test, t = 5.906, df = 8), bar graphs = 100 µm. b Acetylcholine in Vil-Cre × M3R fl/fl tissues 3 days after 10.5 Gy WBI (ELISA; n = 4 mice/group; WT Mean = 1.14, SEM = 0.2; Vil-Cre × M3R fl/fl −/− + IR 10.5 Gy Mean = 1.321, 0.152; unpaired t test, t = 0.7189, df = 6). c ELISA of epithelial-enriched vs. stroma-enriched Vil-Cre × M3R fl/fl tissues 3 days after 10.5 Gy WBI (n = 3 Vil-Cre × M3R fl/fl −/− controls epithelial-enriched, stroma; n = 3 Vil-Cre × M3R fl/fl −/− + IR epithelial-enriched, n = 4 Vil-Cre × M3R fl/fl −/− + IR stroma; Vil-Cre × M3R fl/fl −/− control epithelial-enriched Mean = 1.051, SEM = 0.05; stroma Mean = 1, SEM = 0.047; Vil-Cre × M3R fl/fl −/− + IR 10.5 Gy epithelial-enriched Mean = 0.772, SEM = 0.032; stroma Mean = 1.046, SEM = 0.102; multiple t tests, epithelial-enriched t = 4.706, df = 4; stroma t = 0.3609, df = 5). d p-ERK/ERK and PI3K analysis after acute injury (3 days post 10.5 Gy WBI; n = 3 Vil-Cre × M3R fl/fl −/− controls p-ERK/ERK, n = 4 Vil-Cre × M3R fl/fl −/− controls PI3K; n = 4 Vil-Cre × M3R fl/fl −/− + IR p-ERK/ERK, n = 3 Vil-Cre × M3R fl/fl −/− + IR PI3K; Vil-Cre × M3R fl/fl −/− control p-ERK/ERK Mean = 1.109, SEM = 0.07; PI3K Mean = 1, SEM = 0.101; Vil-Cre × M3R fl/fl −/− + IR p-ERK/ERK Mean = 0.637, SEM = 0.115; PI3K Mean = 0.181, SEM = 0.096; ordinary two-way ANOVA, p-ERK/ERK t = 3.236, df = 10; PI3K t = 5.608, df = 10). Source data are provided as a Source Data file. *p < 0.05, **p < 0.01, ***p < 0.005; ns not significant.
Fig. 7
Fig. 7. Model summarizing the importance of the cholinergic intestinal niche to maintain epithelial homeostasis.
Prox1-positive endocrine cells respond to a loss of negative feedback upon M3R ablation, which results in the expansion of an enteroendocrine tuft cell phenotype and sustained cholinergic niche signaling.

Similar articles

Cited by

References

    1. Spradling A, Drummond-Barbosa D, Kai T. Stem cells find their niche. Nature. 2001;414:98–104. doi: 10.1038/35102160. - DOI - PubMed
    1. Sailaja BS, He XC, Li L. The regulatory niche of intestinal stem cells. J. Physiol. 2016;594:4827–4836. doi: 10.1113/JP271931. - DOI - PMC - PubMed
    1. Schemann M, Sann H, Schaaf C, Mader M. Identification of cholinergic neurons in enteric nervous system by antibodies against choline acetyltransferase. Am. J. Physiol. 1993;265:G1005–G1009. - PubMed
    1. Furness JB. The enteric nervous system and neurogastroenterology. Nat. Rev. Gastroenterol. Hepatol. 2012;9:286–294. doi: 10.1038/nrgastro.2012.32. - DOI - PubMed
    1. Bjerknes M, Cheng H. Modulation of specific intestinal epithelial progenitors by enteric neurons. Proc. Natl Acad. Sci. USA. 2001;98:12497–12502. doi: 10.1073/pnas.211278098. - DOI - PMC - PubMed

Publication types

MeSH terms