

Cotranslational folding allows misfolding-prone proteins to circumvent deep kinetic traps
- PMID: 31911473
- PMCID: PMC6983386
- DOI: 10.1073/pnas.1913207117
Cotranslational folding allows misfolding-prone proteins to circumvent deep kinetic traps
Abstract
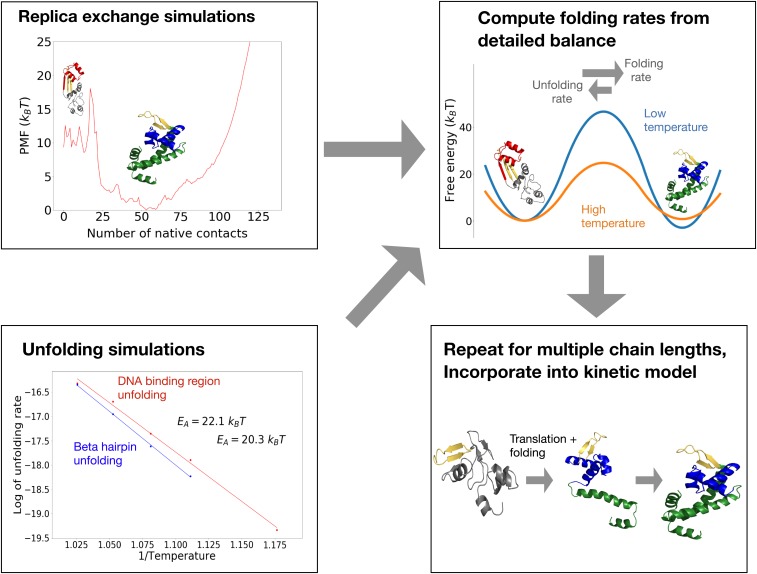
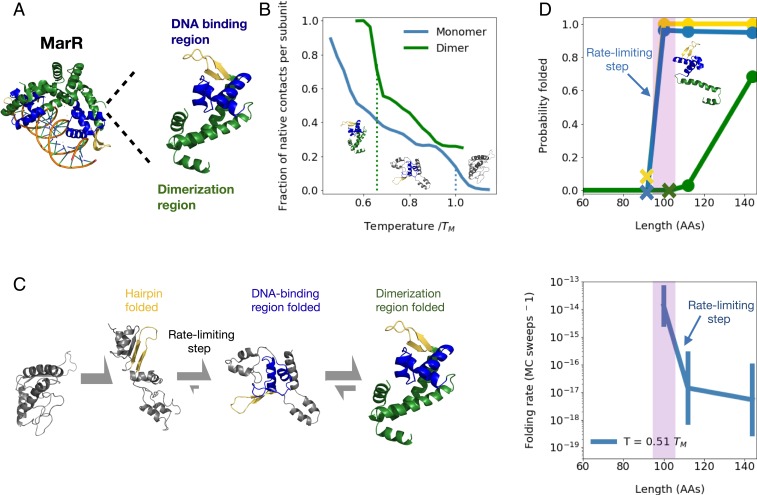
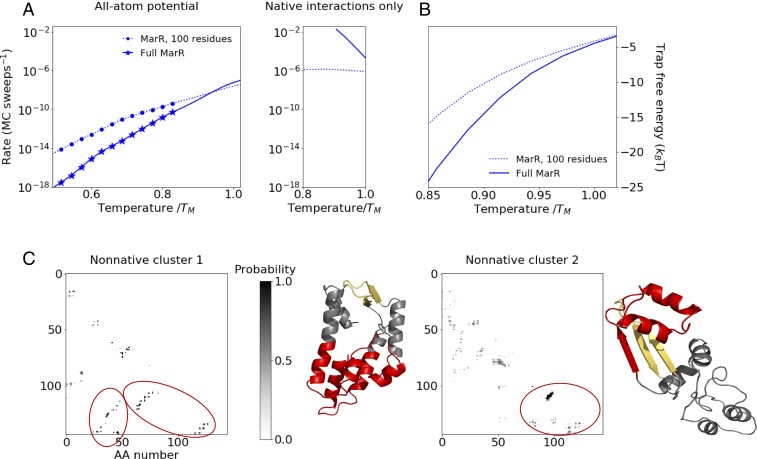
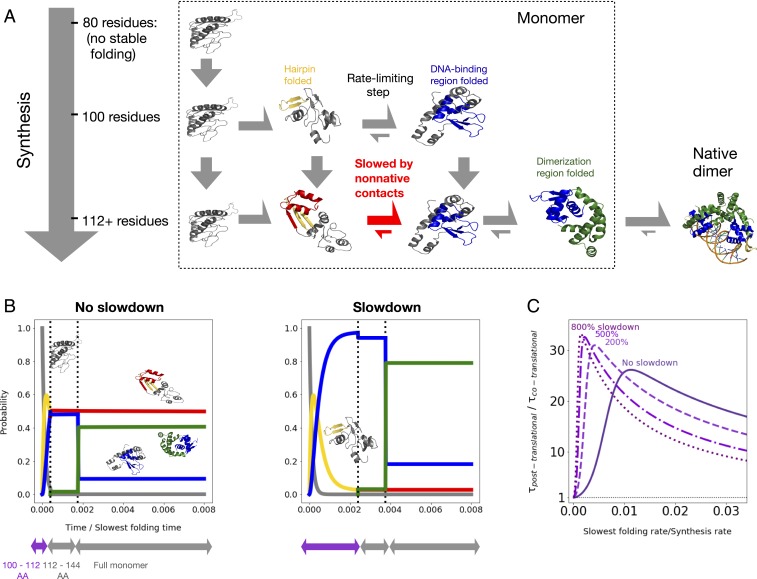
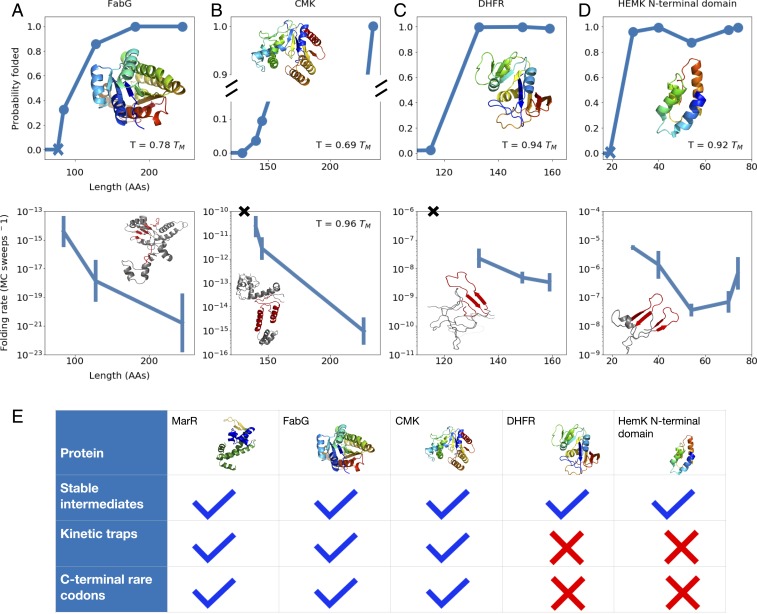
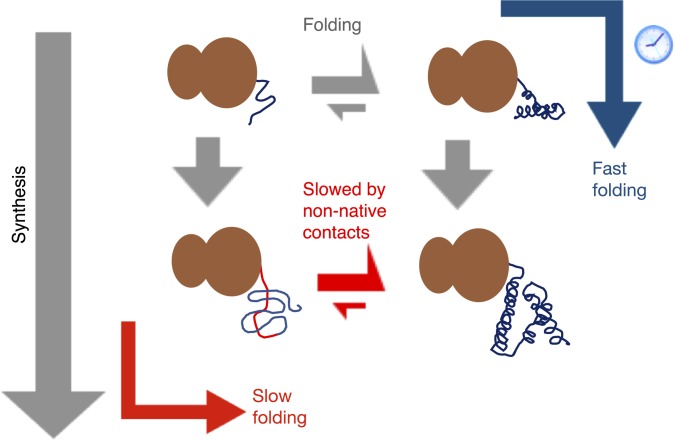
Many large proteins suffer from slow or inefficient folding in vitro. It has long been known that this problem can be alleviated in vivo if proteins start folding cotranslationally. However, the molecular mechanisms underlying this improvement have not been well established. To address this question, we use an all-atom simulation-based algorithm to compute the folding properties of various large protein domains as a function of nascent chain length. We find that for certain proteins, there exists a narrow window of lengths that confers both thermodynamic stability and fast folding kinetics. Beyond these lengths, folding is drastically slowed by nonnative interactions involving C-terminal residues. Thus, cotranslational folding is predicted to be beneficial because it allows proteins to take advantage of this optimal window of lengths and thus avoid kinetic traps. Interestingly, many of these proteins' sequences contain conserved rare codons that may slow down synthesis at this optimal window, suggesting that synthesis rates may be evolutionarily tuned to optimize folding. Using kinetic modeling, we show that under certain conditions, such a slowdown indeed improves cotranslational folding efficiency by giving these nascent chains more time to fold. In contrast, other proteins are predicted not to benefit from cotranslational folding due to a lack of significant nonnative interactions, and indeed these proteins' sequences lack conserved C-terminal rare codons. Together, these results shed light on the factors that promote proper protein folding in the cell and how biomolecular self-assembly may be optimized evolutionarily.
Keywords: codon usage; cotranslational folding; evolution; protein folding; self-assembly.
Conflict of interest statement
The authors declare no competing interest.
Figures
Similar articles
-
Fast Protein Translation Can Promote Co- and Posttranslational Folding of Misfolding-Prone Proteins.Biophys J. 2017 May 9;112(9):1807-1819. doi: 10.1016/j.bpj.2017.04.006. Biophys J. 2017. PMID: 28494952 Free PMC article.
-
Physical Origins of Codon Positions That Strongly Influence Cotranslational Folding: A Framework for Controlling Nascent-Protein Folding.J Am Chem Soc. 2016 Feb 3;138(4):1180-95. doi: 10.1021/jacs.5b08145. Epub 2016 Jan 21. J Am Chem Soc. 2016. PMID: 26716464
-
Understanding the influence of codon translation rates on cotranslational protein folding.Acc Chem Res. 2014 May 20;47(5):1536-44. doi: 10.1021/ar5000117. Epub 2014 May 1. Acc Chem Res. 2014. PMID: 24784899 Review.
-
Kinetic modelling indicates that fast-translating codons can coordinate cotranslational protein folding by avoiding misfolded intermediates.Nat Commun. 2014;5:2988. doi: 10.1038/ncomms3988. Nat Commun. 2014. PMID: 24394622
-
A code within the genetic code: codon usage regulates co-translational protein folding.Cell Commun Signal. 2020 Sep 9;18(1):145. doi: 10.1186/s12964-020-00642-6. Cell Commun Signal. 2020. PMID: 32907610 Free PMC article. Review.
Cited by
-
Co-translational formation of disulfides guides folding of the SARS-CoV-2 receptor binding domain.Biophys J. 2023 Aug 22;122(16):3238-3253. doi: 10.1016/j.bpj.2023.07.002. Epub 2023 Jul 7. Biophys J. 2023. PMID: 37422697 Free PMC article.
-
Universal protein misfolding intermediates can bypass the proteostasis network and remain soluble and less functional.Nat Commun. 2022 Jun 2;13(1):3081. doi: 10.1038/s41467-022-30548-5. Nat Commun. 2022. PMID: 35654797 Free PMC article.
-
Slowest-first protein translation scheme: Structural asymmetry and co-translational folding.Biophys J. 2021 Dec 21;120(24):5466-5477. doi: 10.1016/j.bpj.2021.11.024. Epub 2021 Nov 20. Biophys J. 2021. PMID: 34813729 Free PMC article.
-
Protein folding in vitro and in the cell: From a solitary journey to a team effort.Biophys Chem. 2022 Aug;287:106821. doi: 10.1016/j.bpc.2022.106821. Epub 2022 Apr 29. Biophys Chem. 2022. PMID: 35667131 Free PMC article. Review.
-
Energy-dependent protein folding: modeling how a protein folding machine may work.F1000Res. 2021 Jan 5;10:3. doi: 10.12688/f1000research.28175.1. eCollection 2021. F1000Res. 2021. PMID: 33633838 Free PMC article.
References
-
- Naganathan A. N., Muñoz V., Scaling of folding times with protein size. J. Am. Chem. Soc. 127, 480–481 (2005). - PubMed
-
- Houwman J. A., van Mierlo C. P., Folding of proteins with a flavodoxin-like architecture. FEBS J. 284, 3145–3167 (2017). - PubMed
-
- Sohl J. L., Jaswal S. S., Agard D. A., Unfolded conformations of -lytic protease are more stable than its native state. Nature 395, 817–819 (1998). - PubMed
Publication types
MeSH terms
Substances
Grants and funding
LinkOut - more resources
Full Text Sources
Molecular Biology Databases
