. 2020 Jan 6;15(1):2.
doi: 10.1186/s13024-019-0354-0.

Promoting tau secretion and propagation by hyperactive p300/CBP via autophagy-lysosomal pathway in tauopathy

Affiliations

Promoting tau secretion and propagation by hyperactive p300/CBP via autophagy-lysosomal pathway in tauopathy

Xu Chen et al. Mol Neurodegener. .

Abstract

Background: The trans-neuronal propagation of tau has been implicated in the progression of tau-mediated neurodegeneration. There is critical knowledge gap in understanding how tau is released and transmitted, and how that is dysregulated in diseases. Previously, we reported that lysine acetyltransferase p300/CBP acetylates tau and regulates its degradation and toxicity. However, whether p300/CBP is involved in regulation of tau secretion and propagation is unknown.

Method: We investigated the relationship between p300/CBP activity, the autophagy-lysosomal pathway (ALP) and tau secretion in mouse models of tauopathy and in cultured rodent and human neurons. Through a high-through-put compound screen, we identified a new p300 inhibitor that promotes autophagic flux and reduces tau secretion. Using fibril-induced tau spreading models in vitro and in vivo, we examined how p300/CBP regulates tau propagation.

Results: Increased p300/CBP activity was associated with aberrant accumulation of ALP markers in a tau transgenic mouse model. p300/CBP hyperactivation blocked autophagic flux and increased tau secretion in neurons. Conversely, inhibiting p300/CBP promoted autophagic flux, reduced tau secretion, and reduced tau propagation in fibril-induced tau spreading models in vitro and in vivo.

Conclusions: We report that p300/CBP, a lysine acetyltransferase aberrantly activated in tauopathies, causes impairment in ALP, leading to excess tau secretion. This effect, together with increased intracellular tau accumulation, contributes to enhanced spreading of tau. Our findings suggest that inhibition of p300/CBP as a novel approach to correct ALP dysfunction and block disease progression in tauopathy.

Keywords: Autophagy-lysosomal pathway; Tau secretion; Tau spreading; Tauopathy; p300/CBP.


Conflict of interest statement

L. G. is a founder of Aeton Therapeutics.

Figures

Fig. 1
Fig. 1
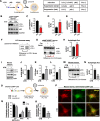
Hyperactive p300/CBP Is Associated with Impairment in the Autophagy-Lysosomal Pathway in Tauopathy Brains a Representative immunoblots of p300, CBP, acH3K18, and H3 in lysates of p300F/F/CBPF/F primary neurons infected with lenti-control (ctrl) or lenti-Cre. b Levels of acH3K18, measured by ELISA, in CSF samples from normal controls (normal, n = 14) and patients with AD (n = 13). ***p < 0.001 by unpaired t test. Values are mean ± SEM. c Pearson correlation analysis of acH3K18 and CSF p-tau/Aβ42 levels in CSF samples from normal controls (normal, n = 3) and AD patients (n = 6). d Representative immunoblots of acH3K18, total H3, LC3-I, LC3-II, SQSMT/p62, and GAPDH in hippocampal lysates of 10-month-old wildtype (WT) and PS19 mice. eg Levels of acH3K18 relative to total H3 (e), LC3-II (f) and p62 (g) relative to GAPDH, normalized to WT. hj Pearson correlation analysis of LC3-II and p62 levels (h), acH3K18 and LC3-II levels (i), and acH3K18 and p62 levels (j). (dj) n = 7 mice per group. **p < 0.01, ***p < 0.001 by unpaired t test. Values are mean ± SEM
Fig. 2
Fig. 2
p300/CBP Inhibits Autophagic Flux in Neurons a Schematic diagram showing autophagic flux with changes in autophagic markers. be p300/CBP double knockout in primary mouse neurons reduces LC3 and p62 accumulation. b Representative immunoblots of LC3-I, −II, p62, and GAPDH in lysates of p300F/F/CBPF/F primary neurons infected lenti-ctrl or lenti-Cre. ce Quantification of LC3-II (c), p62 (e) relative to GAPDH, and LC3-II/I (d), normalized to control. n = 6 wells from three independent experiments. *p < 0.05, ***p < 0.001 by unpaired t test. f Measuring autophagic flux by LC3 turnover assay. g, h p300/CBP double knockout in primary mouse neurons increases autophagic flux. g Representative immunoblots of LC3-I, −II and actin in lysates of p300/CBP double knockout neurons that were treated with BafA1 (10 nM) or DMSO for 24 h. h Quantification of autophagic flux based on the difference (increase) of LC3-II in response to BafA1 treatment, normalized to control (Cre-, BafA1-). n = 4 wells from two independent experiments. **p < 0.01 by unpaired t test. in CTB treatment in primary neurons reduces autophagic flux. i Representative immunoblot of LC3-I, −II, p62 and actin in lysates of primary mouse neurons treated with DMSO (control) or CTB (50 uM) for 24 h. jl Quantification of acH3K18 relative to H3 (j), LC3-II (k) and p62 (l) relative to actin, normalized to control. n = 6 wells from four independent experiments. *p < 0.05, **p < 0.01 by unpaired t test. m Representative immunoblot of LC3-I, −II and actin in lysates of primary mouse neurons treated with DMSO (control), CTB (50 uM), BafA1 (10 nM), or CTB + BafA1 for 24 h. n Quantification of autophagic flux by the difference (increase) of LC3-II in response to BafA1, normalized to control (CTB-, BafA1-). n = 3 wells from three independent experiments. **p < 0.01 by unpaired t test. o Using mCherry-GFP-LC3 color change to measure autophagic flux. p Representative images of primary mouse neurons infected with lentivirus expressing mCherry-GFP-LC3 treated with CTB (50 uM) or DMSO (control) for 24 h. Scale bar: 10 μm. q Quantification of autophagic vesicles (AV). Autophagosomes (APG) are identified as yellow vesicles retaining both mCherry and GFP fluorescence. Autolysosomes (AL) are identified as red vesicles in which GFP fluorescence is quenched by the low pH in lysosomes. *p < 0.05, ***p < 0.001, two-way ANOVA, Tukey-Kramer post hoc analysis. r Ratio of the number of red vesicles to yellow vesicles per cell. **p < 0.01, unpaired t test. From two independent experiments, n = 12 cells (control), n = 17 cells (CTB). Values are mean ± SEM
Fig. 3
Fig. 3
p300/CBP Promotes Tau Secretion ac p300 overexpression in HEK293T cells increases tau secretion. a Representative immunoblot of total tau (t-tau), phosphor-tau (p-tau, AT8), acetylated tau (ac-tau, K174), and GAPDH in the lysate (5% of total) and conditioned medium (25% of total) of HEK293T cells transfected with tau alone or tau+p300. HEK293T cells were serum-starved for 48 h after transfection. The conditioned medium was concentrated 25-fold. b, c Quantification of intracellular total tau (t-tau) levels (b) and t-tau secretion (c), normalized to control. t-tau secretion was quantified by normalizing extracellular tau to intracellular tau. n = 8 wells from eight independent experiments. *p < 0.05, **p < 0.01 by unpaired t test. dg p300/CBP double knockout in primary mouse neurons reduces tau secretion. d Representative immunoblot of ac-tau (K174), t-tau, and GAPDH in the lysate of p300F/F/CBPF/F primary neurons infected with lenti-ctrl or lenti-Cre. e hTau mRNA levels in p300F/F/CBPF/F primary neurons infected with lenti-ctrl or lenti-Cre, by qRT-PCR. n = 4 wells from two independent experiments. ns, non-significant by unpaired t test. f Quantification of intracellular t-tau levels by tau ELISA, normalized to control. g Quantification of tau secretion over 3 h by ELISA, normalized to intracellular tau levels and normalized to control. n = 6 wells from three independent experiments. **p < 0.01, ***p < 0.001, unpaired t test. h, i CTB treatment increase tau secretion in primary mouse neurons. h Quantification of intracellular total tau levels by tau ELISA, normalized to control. i Quantification of tau secretion over 3 h by ELISA, normalized to intracellular tau levels and normalized to control. n = 8 wells from four independent experiments. *p < 0.05, **p < 0.01, unpaired t test. Values are mean ± SEM
Fig. 4
Fig. 4
New p300 Inhibitor 37892 Reduces Tau Secretion (a) Structure of SMDC37892. b 37892 inhibited tau acetylation by p300 with an IC50 of 35 μM. c Concentration-response curve (CRC) for 37892, quantified from p300 activity in HEK293T cells. dg 37892 treatment in human iPSC-derived neurons. d Representative immunoblot of ac-tau (K174), t-tau, and GAPDH in lysates of human iPSC-induced neurons treated with DMSO (control) or 37892 (50 μM) for 3 days. Quantification of levels of ac-tau (e) and intracellular t-tau (f) after 3 days of treatment, normalized to control. g Quantification of tau secretion over 3 h, normalized to intracellular tau levels, and normalized to control. n = 6 wells from three independent experiments. *p < 0.05, ***p < 0.001 by unpaired t test. hj 37892 treatment increases autophagic flux in hTau-expressing mouse primary neurons. h Representative immunoblots of p62, LC3-II and actin in primary neurons treated with 37892 (50 μM), BafA1 (5 nM), or both, for 24 h. i Autophagic flux in control and 37892-treated neurons quantified from the increase of LC3-II levels in response to BafA1 treatment, normalized to control. n = 6 wells from three independent experiments. **p < 0.01 by unpaired t test. j Quantification of tau secretion over 3 h in p300/CBP double knockout neurons treated with 37892. p300F/F/CBPF/F primary neurons were infected with lenti-ctrl or lenti-Cre, and treated with DMSO (−) or 37892 (50 μM) for 24 h. n = 4 wells from 2 independent experiments. *p < 0.05, ns, non-significant, by one-way ANOVA and Sidak’s multiple comparisons test. Values are mean ± SEM
Fig. 5
Fig. 5
Blocking Autophagic Flux Increases Tau Secretion and Occludes the Effects of p300 a Schematic diagram showing autophagic flux and predicted changes in autophagic markers with baflomycin A1 (BafA1) treatment. bf BafA1 treatment in primary neurons. b Representative immunoblots of LC3-I, LC3-II, p62 and actin in lysates of rat primary neurons treated with BafA1 (10 nM) or control (ctrl, DMSO) for 24 h. Quantification of levels of LC3-II (c) and p62 (d) relative to actin, normalized to control. e Quantification of intracellular tau levels by ELISA, normalized to control. f Quantification of tau secretion over 3 h by ELISA, normalized to intracellular tau levels and normalized to control. (bf) n = 6 wells from three independent experiments. ***p < 0.001, **p < 0.01, *p < 0.05 by unpaired t test. g Quantification of tau secretion over 3 h in primary neurons treated with BafA1 (10 nM), CTB (50 μM) or combined, normalized to intracellular tau levels and normalized to control (CTB- BafA1-). n = 6 wells from three independent experiments. **p < 0.01, *p < 0.05, ns, non-significant by one-way ANOVA and Sidak’s multiple comparisons test. h Quantification of tau secretion over 3 h in neurons treated with BafA1 (10 nM), 37892 (50 μM) or combined, normalized to intracellular tau levels and normalized to control (37892- BafA1-). n = 6 wells from three independent experiments. *, #p < 0.05, ***p < 0.001 by one-way ANOVA and Sidak’s multiple comparisons test. Values are mean ± SEM
Fig. 6
Fig. 6
Enhancing Autophagy Flux Mitigates p300-mediated Tau Secretion a Schematic diagram showing autophagic flux and predicted changes in autophagic markers with rapamycin (rapa) treatment. bf Rapa treatment in primary neurons. b Representative immunoblots of LC3-I, LC3-II, p62 and actin in lysates of rat primary neurons treated with rapa (0.25 μM) or DMSO (ctrl) for 24 h. Quantification of levels of LC3-II/I (c) and p62 (d) relative to actin, normalized to control. e Quantification of intracellular tau levels by ELISA, normalized to control. f Quantification of tau secretion over 3 h by ELISA, normalized to intracellular tau levels and normalized to control. (bf) n = 6 wells from three independent experiments. ***p < 0.001, **p < 0.01 by unpaired t test. g, h Rapamycin treatment in HEK293T cells with and without p300 overexpression. g Representative immunoblots of LC3-I, LC3-II, p62, total tau (t-tau) and GAPDH in lysate and conditioned medium of HEK293T cells transfected with tau alone or tau+p300. Serum-starved HEK293T cells were treated with DMSO (ctrl) or rapamycin (1 μM) for 24 h. h Quantification of t-tau secretion in (g) normalized to intracellular levels and normalized to control. n = 3 wells from three independent experiments. *, #p < 0.05 by one-way ANOVA and Sidak’s multiple comparisons test. i, j Primary neurons treated with CTB and rapa. i Representative immunoblots of LC3-I, LC3-II, p62, and actin in lysates of mouse primary neurons treated with DMSO (ctrl), CTB (50 μM), rapa (0.25 μM) and CTB + rapa. j Quantification of tau secretion over 3 h by ELISA of neurons as in (i), normalized to intracellular tau levels and normalized to control (CTB- rapa-). n = 6 wells from three independent experiments. *, #p < 0.05, **p < 0.01 by one-way ANOVA and Sidak’s multiple comparisons test. Values are mean ± SEM
Fig. 7
Fig. 7
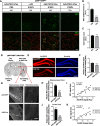
Inhibition of p300/CBP Reduces Tau Spreading ac p300/CBP double knockout reduces fibril-induced tau spreading in primary neurons. a Representative immunofluorescence staining with MC1 and MAP2 antibody in p300F/F/CBPF/F primary neurons infected with AAV-P301S hTau and lenti-ctrl or lenti-Cre, and treated with synthetic tau fibrils (K18/PL, 100 nM). Negative controls (PBS-treated, AAV non-infected) are included. Scale bar: 100 μm. b Percentage of MC1-positive neurons, normalized to control. ***p < 0.001, unpaired t test. c Number of valid (live) nuclei, normalized to control. n = 9 wells from two independent experiments. dk Inhibition of p300/CBP reduces tau spreading in PS19 mice. d Schematic diagram of stereotaxic injections in the hippocampus of 3–4 mo PS19 mice carrying p300F/F/CBPF/F. Tau fibrils (K18/PL) were injected into left CA1 (seeding side). AAV-Cre or AAV-GFP were injected into right dentate gyrus (spreading side). e Representative images of immunostaining with acH3K18 antibody in the hippocampus after AAV-GFP (control) and AAV-Cre injections. Scale bar: 200 μm. f Quantification of acH3K18-positive area (normalized to Hoechst) on the spreading side (AAV-injected) normalized to the seeding (fibril-injected) side of hippocampus. g Representative images of immunostaining of MC1 in the hippocampus (CA3) and cortex (entorhinal) after AAV-GFP and AAV-Cre injections. Scale bar: 250 μm. h, j Quantification of MC1-positive area of hippocampus (h) and cortex (j) on the spreading side (AAV-injected) normalized to the seeding (fibril-injected) side. i, k Pearson correlation analysis of acH3K18 signal in the AAV-injected hippocampus with MC1 signal in the hippocampus (i) and cortex (k). n = 7 slices from 9 (AAV-GFP) or 8 (AAV-Cre) mice per group. (f, h, j) ***p < 0.001, unpaired t test. Values are means ± SEM

Similar articles

Cited by

References

    1. Jucker M, Walker LC. Self-propagation of pathogenic protein aggregates in neurodegenerative diseases. Nature. 2013;501(7465):45–51. doi: 10.1038/nature12481. - DOI - PMC - PubMed
    1. Braak H, Braak E. Neuropathological stageing of Alzheimer-related changes. Acta Neuropathol. 1991;82(4):239–259. doi: 10.1007/BF00308809. - DOI - PubMed
    1. Brettschneider J, Del Tredici K, Lee VM, Trojanowski JQ. Spreading of pathology in neurodegenerative diseases: a focus on human studies. Nat Rev Neurosci. 2015;16(2):109–120. doi: 10.1038/nrn3887. - DOI - PMC - PubMed
    1. Iba M, et al. Synthetic tau fibrils mediate transmission of neurofibrillary tangles in a transgenic mouse model of Alzheimer's-like tauopathy. J Neurosci. 2013;33(3):1024–1037. doi: 10.1523/JNEUROSCI.2642-12.2013. - DOI - PMC - PubMed
    1. Clavaguera F, et al. Transmission and spreading of tauopathy in transgenic mouse brain. Nat Cell Biol. 2009;11(7):909–913. doi: 10.1038/ncb1901. - DOI - PMC - PubMed

Publication types

Substances