

Normalization and variance stabilization of single-cell RNA-seq data using regularized negative binomial regression
- PMID: 31870423
- PMCID: PMC6927181
- DOI: 10.1186/s13059-019-1874-1
Normalization and variance stabilization of single-cell RNA-seq data using regularized negative binomial regression
Abstract
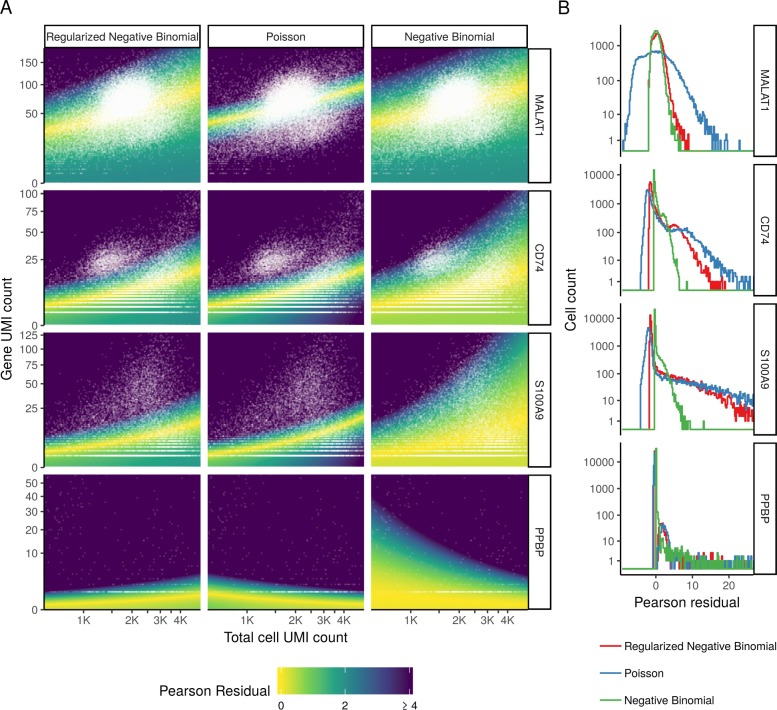
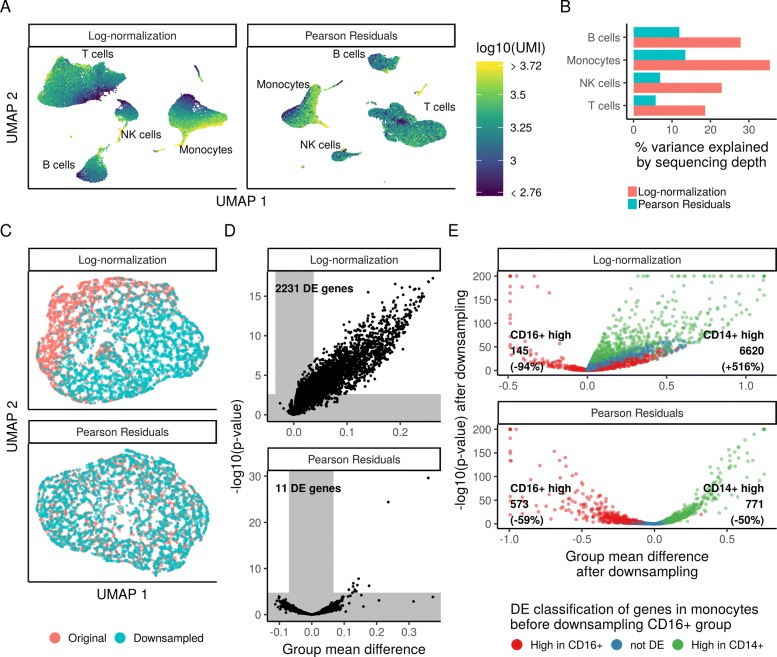
Single-cell RNA-seq (scRNA-seq) data exhibits significant cell-to-cell variation due to technical factors, including the number of molecules detected in each cell, which can confound biological heterogeneity with technical effects. To address this, we present a modeling framework for the normalization and variance stabilization of molecular count data from scRNA-seq experiments. We propose that the Pearson residuals from "regularized negative binomial regression," where cellular sequencing depth is utilized as a covariate in a generalized linear model, successfully remove the influence of technical characteristics from downstream analyses while preserving biological heterogeneity. Importantly, we show that an unconstrained negative binomial model may overfit scRNA-seq data, and overcome this by pooling information across genes with similar abundances to obtain stable parameter estimates. Our procedure omits the need for heuristic steps including pseudocount addition or log-transformation and improves common downstream analytical tasks such as variable gene selection, dimensional reduction, and differential expression. Our approach can be applied to any UMI-based scRNA-seq dataset and is freely available as part of the R package sctransform, with a direct interface to our single-cell toolkit Seurat.
Keywords: Normalization; Single-cell RNA-seq.
Conflict of interest statement
The authors declare that they have no competing interests.
Figures
Similar articles
-
Analytic Pearson residuals for normalization of single-cell RNA-seq UMI data.Genome Biol. 2021 Sep 6;22(1):258. doi: 10.1186/s13059-021-02451-7. Genome Biol. 2021. PMID: 34488842 Free PMC article.
-
Comparison and evaluation of statistical error models for scRNA-seq.Genome Biol. 2022 Jan 18;23(1):27. doi: 10.1186/s13059-021-02584-9. Genome Biol. 2022. PMID: 35042561 Free PMC article.
-
Asc-Seurat: analytical single-cell Seurat-based web application.BMC Bioinformatics. 2021 Nov 18;22(1):556. doi: 10.1186/s12859-021-04472-2. BMC Bioinformatics. 2021. PMID: 34794383 Free PMC article.
-
Machine learning and statistical methods for clustering single-cell RNA-sequencing data.Brief Bioinform. 2020 Jul 15;21(4):1209-1223. doi: 10.1093/bib/bbz063. Brief Bioinform. 2020. PMID: 31243426 Review.
-
Single-cell RNA sequencing in breast cancer: Understanding tumor heterogeneity and paving roads to individualized therapy.Cancer Commun (Lond). 2020 Aug;40(8):329-344. doi: 10.1002/cac2.12078. Epub 2020 Jul 12. Cancer Commun (Lond). 2020. PMID: 32654419 Free PMC article. Review.
Cited by
-
Characterization of EpCAM-Positive and EpCAM-Negative Tumor Cells in Early-Stage Breast Cancer.Int J Mol Sci. 2024 Oct 16;25(20):11109. doi: 10.3390/ijms252011109. Int J Mol Sci. 2024. PMID: 39456890 Free PMC article.
-
Remyelination protects neurons from DLK-mediated neurodegeneration.Nat Commun. 2024 Oct 23;15(1):9148. doi: 10.1038/s41467-024-53429-5. Nat Commun. 2024. PMID: 39443516 Free PMC article.
-
Single-Cell Transcriptome Analysis Identifies Ligand-Receptor Pairs Associated With BCP-ALL Prognosis.Front Oncol. 2021 Mar 10;11:639013. doi: 10.3389/fonc.2021.639013. eCollection 2021. Front Oncol. 2021. PMID: 33777800 Free PMC article.
-
Single cell heterogeneity in influenza A virus gene expression shapes the innate antiviral response to infection.PLoS Pathog. 2020 Jul 2;16(7):e1008671. doi: 10.1371/journal.ppat.1008671. eCollection 2020 Jul. PLoS Pathog. 2020. PMID: 32614923 Free PMC article.
-
Human Pluripotent Stem Cell-Derived Astrocyte Functionality Compares Favorably with Primary Rat Astrocytes.eNeuro. 2024 Sep 13;11(9):ENEURO.0148-24.2024. doi: 10.1523/ENEURO.0148-24.2024. Print 2024 Sep. eNeuro. 2024. PMID: 39227152 Free PMC article.
References
-
- Stegle O, Teichmann SA, Marioni JC. Computational and analytical challenges in single-cell transcriptomics. Nat Rev Genet. 2015; 16(January 2014):133–45. http://dx.doi.org/10.1038/nrg3833{%}5Cn. http://www.nature.com/nrg/journal/vaop/ncurrent/full/nrg3833.html{#}author-information. - PubMed
-
- The Tabula MurisConsortium. Single-cell transcriptomic characterization of 20 organs and tissues from individual mice creates a Tabula Muris. bioRxiv. 2018. https://www.biorxiv.org/content/early/2018/03/29/237446. Accessed 29 Mar 2018.
Publication types
MeSH terms
Grants and funding
LinkOut - more resources
Full Text Sources
Other Literature Sources
