. 2019 Nov 26:10:2779.
doi: 10.3389/fimmu.2019.02779. eCollection 2019.

Monocytes and Monocyte-Derived Antigen-Presenting Cells Have Distinct Gene Signatures in Experimental Model of Multiple Sclerosis

Affiliations

Monocytes and Monocyte-Derived Antigen-Presenting Cells Have Distinct Gene Signatures in Experimental Model of Multiple Sclerosis

Kelly L Monaghan et al. Front Immunol. .

Abstract

Multiple sclerosis (MS) is a chronic inflammatory disease mediated by a complex interaction between the autoreactive lymphocytes and the effector myeloid cells within the central nervous system (CNS). In a murine model of MS, experimental autoimmune encephalomyelitis (EAE), Ly6Chi monocytes migrate into the CNS and further differentiate into antigen-presenting cells (APCs) during disease progression. Currently, there is no information about gene signatures that can distinguish between monocytes and the monocyte-derived APCs. We developed a surface marker-based strategy to distinguish between these two cell types during the stage of EAE when the clinical symptoms were most severe, and performed transcriptome analysis to compare their gene expression. We report here that the inflammatory CNS environment substantially alters gene expression of monocytes, compared to the monocyte differentiation process within CNS. Monocytes in the CNS express genes that encode proinflammatory cytokines and chemokines, and their expression is mostly maintained when the cells differentiate. Moreover, monocyte-derived APCs express surface markers associated with both dendritic cells and macrophages, and have a significant up-regulation of genes that are critical for antigen presentation. Furthermore, we found that Ccl17, Ccl22, and Ccr7 are expressed in monocyte-derived APCs but not the Ly6Chi monocytes. These findings may shed light on identifying molecular signals that control monocyte differentiation and functions during EAE.

Keywords: RNA-Seq; antigen-presenting cells; experimental autoimmune encephalomyelitis; monocytes; multiple sclerosis.


Figures

Figure 1
Figure 1
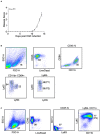
Identification of monocytes and the monocyte-derived APCs during EAE. (A) EAE was induced in female mice in C57BL/6J background by active immunization. Disease severity, as determined by physical disability of the mice, was measured. Shown is a combine of three independent experiments with n = 11. (B) At the peak of EAE (days 14–15), spinal cords were removed from the mice. Spinal cord monocytes (CD45+ CD11b+ CD64+ Ly6Chi Ly6G, P1) andmonocyte-derived APCs (CD45+ CD11b+ CD64+ Ly6Clow/− Ly6G, P2) were purified by sorting. Shown are representative plots from three independent experiments, with a total of 18 mice. (C) At the peak of EAE (days 14–15), bone marrow cells were isolated from the femurs and tibias from the mice. Bone marrow monocytes (CD45+ CD11b+ Ly6Chi Ly6G CD11c, P3) were purified by sorting. Shown are representative plots from two independent experiments, with bone marrow cells from 13 mice were combined.
Figure 2
Figure 2
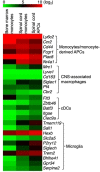
Monocytes and monocyte-derived cells express signature genes that are not overlapped by CNS-associated macrophages and cDCs. Heatmap showing the expression of signature genes in monocyte/monocyte-derived APCs, CNS-associated macrophages, cDCs, and microglia. Signature genes for each cell type were identified based on previous studies. Colors on the heatmap represent log2 values of TPM.
Figure 3
Figure 3
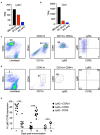
The expression of Ly6C and CCR2 in monocytes is reduced during differentiation in the CNS. (A,B) The gene expression level of Ly6c1 (A) and Ccr2 (B) in monocytes isolated from the bone marrow (BM-Mono) or spinal cords (SC-Mono), and the monocyte-derived APCs isolated from the spinal cords (SC-APC) at days 14–15 following EAE induction. Shown are TPM values from RNA-Seq analysis. (C–E) Spinal cord cells were isolated at days 14–15 (C) or day 7 (D) following EAE induction. The expression of Ly6C and CCR2 in the CD45hi CD11bhi CD64+ Ly6G cells was determined. Shown are representative plots from three independent experiments, with a total of 10–11 animals in each time point. (E) Percentage of cells expressing Ly6C and CCR2 from individual animals is shown. ***P < 0.001.
Figure 4
Figure 4
Monocyte-derived APCs expressed gene signatures for both dendritic cells and macrophages. (A–F) The gene expression level of Itgax (A), H2-Ab1 (B), H2-Aa (C), Cd68 (D), Mertk (E), and Cd74 (F) in monocytes isolated from the bone marrow (BM-Mono) or spinal cords (SC-Mono), and the monocyte-derived APCs isolated from the spinal cords (SC-APC) at days 14–15 following EAE induction. Shown are TPM values from RNA-Seq analysis. (G–J) Spinal cord cells were isolated at days 14–15 (G) or day 7 (H) following EAE induction. The expression of surface markers for dendritic cells (CD11c, MHC II) and macrophages (MerTK, CD24) in the CD45hi CD11bhi CD64+ Ly6G cells or the CD45hi CD11bhi CD64 Ly6G cells was determined. Shown are representative plots from three independent experiments, with a total of 10–11 animals in each time point. (I) Percentage of cells expressing MerTK and CD24 within the CD11c/MHCII subpopulations from individual animals is shown. (J) Percentage of cells expressing CD11c and MHCII within the CD64hi or CD64lo/− populations from individual animals is shown. *P < 0.05; **P < 0.01; ***P < 0.001. NS, not statistically different.
Figure 5
Figure 5
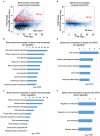
The inflammatory CNS environment substantially induces monocyte activation. (A–C) Comparison of the gene expression profile of the monocytes isolated from the bone marrow and the spinal cords at the peak of EAE by RNA-Seq analysis. (A) MA-plot of differentially expressed genes in bone marrow monocytes vs. spinal cord monocytes, with fold change ≥2 and FDR < 0.05. (B,C) DAVID gene ontology enrichment analysis on biological processes for genes that were up-regulated (B) or down-regulated (C) in the spinal cord monocytes compared to the bone marrow monocytes, using DAVID bioinformatics resource. (D–F) Comparison of the gene expression profile of the monocytes and monocyte-derived APCs isolated from the spinal cords at the peak of EAE by RNA-Seq analysis. (D) MA-plot of differentially expressed genes in spinal cord monocytes vs. spinal cord monocyte-derived APCs, with fold change ≥2 and FDR < 0.05. (E,F) DAVID gene ontology enrichment analysis on biological processes for genes that were up-regulated (E) or down-regulated (F) in the spinal cord monocyte-derived APCs compared to the spinal cord monocytes, using DAVID bioinformatics resource.
Figure 6
Figure 6
Monocytes do not differentiate in the bone marrow and the blood during the peak of EAE. (A,B) At the peak of EAE (days 14–15), cells from the bone marrow (A) and the blood (B) were isolated. The expression of CD11c, MHC II, and MerTK was determined in the CD45hi CD11bhi CD64+ cells. Shown are representative plots from three independent experiments, with a total of 10–11 animals in each time point.
Figure 7
Figure 7
The expression of Ccl17, Ccl22, and Ccr7 distinguishes monocytes from monocyte-derived APCs. (A–D) Heatmaps showing the differential expression of genes that encode cytokines (A), cytokine receptors (B), chemokines (C), and chemokine receptors (D) from bone marrow monocytes relative to the spinal cord monocytes, and/or spinal cord monocytes relative to the spinal cord monocyte-derived APCs. Colors on the heatmap represent log2 values of TPM. (E–G) Gene expression level of Ccl17 (E), Ccl22 (F), Ccr7 (G) in monocytes isolated from the bone marrow (BM-Mono) or spinal cords (SC-Mono), and the monocyte-derived APCs isolated from the spinal cords (SC-APC) at days 14–15 following EAE induction. Shown are TPM values from RNA-Seq analysis.
Figure 8
Figure 8
Genes encoding tetraspanins are regulated during monocyte differentiation in the CNS. (A) Heatmap showing the differential expression of genes that encode a selected group of immunomodulatory molecules from bone marrow monocytes relative to the spinal cord monocytes, and/or spinal cord monocytes relative to the spinal cord monocyte-derived APCs. Colors on the heatmap represent log2 values of TPM. (B–D) Gene expression level of Cd9 (B), Cd63 (C), Cd81 (D) in monocytes isolated from the bone marrow (BM-Mono) or spinal cords (SC-Mono), and the monocyte-derived APCs isolated from the spinal cords (SC-APC) at days 14–15 following EAE induction. Shown are TPM values from RNA-Seq analysis.
Figure 9
Figure 9
Atf3 is induced in CNS-infiltrated monocytes during EAE. Graph shows the differential expression of genes that encode transcription factors, which are differentially expressed in monocytes relative to the monocyte-derived APCs isolated from the spinal cords at days 14–15 following EAE induction. Shown are TPM values from RNA-Seq analysis.

Similar articles

Cited by

References

    1. Ransohoff RM, Hafler DA, Lucchinetti CF. Multiple sclerosis-a quiet revolution. Nat Rev Neurol. (2015) 11:134–42. 10.1038/nrneurol.2015.14 - DOI - PMC - PubMed
    1. Wagner CA, Goverman JM. Novel insights and therapeutics in multiple sclerosis. F1000Res. (2015) 4:517. 10.12688/f1000research.6378.1 - DOI - PMC - PubMed
    1. De Groot CJ, Bergers E, Kamphorst W, Ravid R, Polman CH, Barkhof F, et al. . Post-mortem MRI-guided sampling of multiple sclerosis brain lesions: increased yield of active demyelinating and (p)reactive lesions. Brain. (2001) 124:1635–45. 10.1093/brain/124.8.1635 - DOI - PubMed
    1. Segal B.M. Modulation of the innate immune system: a future approach to the treatment of neurological disease. Clin Immunol. (2018) 189:1–3. 10.1016/j.clim.2018.03.003 - DOI - PubMed
    1. Mishra MK, Yong VW. Myeloid cells - targets of medication in multiple sclerosis. Nat Rev Neurol. (2016) 12:539–51. 10.1038/nrneurol.2016.110 - DOI - PubMed

Publication types