Clinical Trial
. 2020 Feb 3;130(2):673-685.
doi: 10.1172/JCI130144.

CD19-targeting CAR T cell immunotherapy outcomes correlate with genomic modification by vector integration

Affiliations
Clinical Trial

CD19-targeting CAR T cell immunotherapy outcomes correlate with genomic modification by vector integration

Christopher L Nobles et al. J Clin Invest. .

Abstract

Chimeric antigen receptor-engineered T cells targeting CD19 (CART19) provide an effective treatment for pediatric acute lymphoblastic leukemia but are less effective for chronic lymphocytic leukemia (CLL), focusing attention on improving efficacy. CART19 harbor an engineered receptor, which is delivered through lentiviral vector integration, thereby marking cell lineages and modifying the cellular genome by insertional mutagenesis. We recently reported that vector integration within the host TET2 gene was associated with CLL remission. Here, we investigated clonal population structure and therapeutic outcomes in another 39 patients by high-throughput sequencing of vector-integration sites. Genes at integration sites enriched in responders were commonly found in cell-signaling and chromatin modification pathways, suggesting that insertional mutagenesis in these genes promoted therapeutic T cell proliferation. We also developed a multivariate model based on integration-site distributions and found that data from preinfusion products forecasted response in CLL successfully in discovery and validation cohorts and, in day 28 samples, reported responders to CLL therapy with high accuracy. These data clarify how insertional mutagenesis can modulate cell proliferation in CART19 therapy and how data on integration-site distributions can be linked to treatment outcomes.

Keywords: Immunotherapy; Microbiology.


Conflict of interest statement

Conflict of interest: CLN, JAF, DLP, SIG, BLL, CHJ, SFL, JJM, and FDB hold patent applications (US 20180258149, US 20180140602, US 20150283178) related to CAR T cell therapy. JAF, SIG, CHJ, SFL, JJM, and FDB receive research funding from Novartis. JAF, SIG, and SFL also receive research funding from Tmunity Therapeutics. JJM obtains additional research support from Incyte Corporation. SIG is a cofounder of Carisma Therapeutics and discloses consultancy. BLL and CHJ are cofounders and equity holders in Tmunity Therapeutics. BLL is a consultant for Novartis as well as CRC Oncology and is a member of the scientific advisory boards of Avectas, Brammer Bio, Cure Genetics, and Incysus. JJM is a consultant for Shanghai Unicar-Therapy Bio-medicine Technology Co. Ltd, Simcere of America Inc., IASO Biotherapeutics, and Poseida Therapeutics and is a member of the scientific advisory board of IASO Biotherapeutics.

Figures

Figure 1
Figure 1. VCN analyzed by qPCR longitudinally, comparing CR/PRtd with PR/NR.
Peak expansion was assessed as maximal VCN 10–21 days after infusion. The difference in medians was tested using Wilcoxon’s rank-sum test.
Figure 2
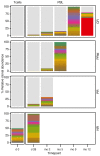
Figure 2. Examples of longitudinal analysis of integration-site distributions for CR, PRtd, PR, and NR patients.
Day 0 indicates the preinfusion T cell product. Later samples from patients were from PBLs. Each color indicates a different clone; the height of the bar indicates the relative abundance. No clones were shared among patients. Light gray indicates low-abundance clones; white indicates no samples available. The abundant clone in the CR patient (red) is in the gene ZNF573.
Figure 3
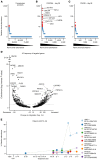
Figure 3. Clonal behavior of CART19 assessed by tracking sites of integrated vectors.
(AC) Rank-abundance plots summarizing clonal abundance for the transduction products (A); CR/PRtd assayed on day 28 (B); and PR/NR assayed on day 28 (C). Cell clones (identified by identical integration sites) were ordered by most abundant (left) to least abundant (right) as assessed by SonicAbundance (41). Highly abundant clones (red) were scored as the top 1% of all expanded clones, corresponding to at least 9 cells representing each clone. The top 10 most-abundant clones for CR/PRtd on day 28 are labeled with gene symbols. A Venn diagram showing overlap among the top 30 most-expanded clones in AC appears in Supplemental Figure 2. (D) Volcano plot showing genes where integration frequency was enriched or depleted during growth in patients. The total number of integration sites in each transcription unit was quantified for the preinfusion and posttransplant samples and normalized within each group. The 2 values were subtracted to obtain a normalized percent change (x axis). Fisher’s exact test (corrected for multiple comparisons using the Benjamini-Hochberg method) was used to assess enrichment or depletion (y axis). The x axis shows the percent change in frequency; the y axis shows the inverse log of the P value. (E) Example of a longitudinal expanded clone, from patient p03712-06. The x axis shows the time points sampled; the y axis shows the percent relative abundance of each clone determined by SonicAbundance. The nearest gene and the chromosomal location of each integration site (mapped on hg38) are indicated for the 10 most-abundant clones. The asterisk indicates integrated within the indicated transcription unit. TDN, transduction.
Figure 4
Figure 4. Levels of CAR expression do not distinguish the patient response groups.
(A) CAR expression on CD8+ T cells, measured as MFI (y axis) compared by response group. No significant difference was detected among groups (1-way ANOVA). Red shows patient 10, who harbored the TET2 expansion. (B) As in A, but measured on bulk CAR+ T cells. Again no significant difference was detected (1-way ANOVA).
Figure 5
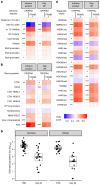
Figure 5. Frequency of integration near chromosomal features is associated with outcome.
(A) Genomic features, (B) chromosome-bound proteins, and (C) epigenetic marks associated with vector-integration frequency are shown for transduction products and day 28 peripheral blood samples. CR/PRtd and PR/NR are compared (columns) to mapped chromosomal features (rows). Associations were calculated by an ROC area method (41, 45). Values of the ROC area can vary between 0 (negatively associated) and 1 (positively associated), with 0.5 indicating no association. All epigenetic features were assessed within a 10 kb window. Asterisks beside the heatmap indicate comparisons between clinical response groups; separate analyses were conducted for transduction product on left and day 28 samples on right. P values were calculated using Wald’s test with a χ2 distribution; no correction for multiple comparisons was applied. (D) Right: box plot representation of Chao1 estimated population sizes for responders (CR and PRtd), comparing the transduction product and day 28 samples (PR and NR). Left: box plot representations of Chao1 estimated population sizes for nonresponders, comparing the transduction products and day 28 samples (CR/PRtd-TDN ~ PR/NR-TDN: P = 0.033, CR/PRtd-TDN ~ CR/PRtd-day 28: P < 0.001, PR/NR-TDN ~ PR/NR-day 28: P < 0.001, calculated using Wilcoxon’s test with a Benjamini-Hochberg correction for multiple comparisons) (, –72). *P < 0.05, **P < 0.01, ***P < 0.001. TU, transcription unit; TDN, transduction.
Figure 6
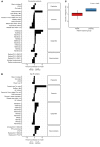
Figure 6. Predicting clinical outcome from integration-site data.
A total of 91 features spanning population metrics, genomic features, and epigenetic features from 29 patients were used in LASSO logistic regression to build a classification model. Results are from leave-one-out cross-validation of models based on /preinfusion products (A) and day 28 peripheral blood samples (B). Bar plots indicate the contribution of different features to classification in each model. Positive values indicate correlation with a positive clinical outcome, while negative contributions indicate a correlation with negative clinical outcomes. (C) Vector integration in the CR/PRtd sample is favored in transcription units preferentially active in the T cells from CR/PRtd. RNA-Seq data were analyzed to identify the top 500 genes that were preferentially active in preinfusion products from CR/PRtd versus PR/NR. The frequency of integration in these genes (y axis) was then compared among integration sites from CR/PRtd versus PR/NR (x axis). Median values were compared using the Mann–Whitney U test.

Similar articles

Cited by

References

    1. Maude SL, et al. Chimeric antigen receptor T cells for sustained remissions in leukemia. N Engl J Med. 2014;371(16):1507–1517. doi: 10.1056/NEJMoa1407222. - DOI - PMC - PubMed
    1. Davila ML, et al. Efficacy and toxicity management of 19-28z CAR T cell therapy in B cell acute lymphoblastic leukemia. Sci Transl Med. 2014;6(224):224ra25. doi: 10.1126/scitranslmed.3008226. - DOI - PMC - PubMed
    1. Lee DW, et al. T cells expressing CD19 chimeric antigen receptors for acute lymphoblastic leukaemia in children and young adults: a phase 1 dose-escalation trial. Lancet. 2015;385(9967):517–528. doi: 10.1016/S0140-6736(14)61403-3. - DOI - PMC - PubMed
    1. Porter DL, et al. Chimeric antigen receptor T cells persist and induce sustained remissions in relapsed refractory chronic lymphocytic leukemia. Sci Transl Med. 2015;7(303):303ra139. doi: 10.1126/scitranslmed.aac5415. - DOI - PMC - PubMed
    1. Fraietta JA, et al. Determinants of response and resistance to CD19 chimeric antigen receptor (CAR) T cell therapy of chronic lymphocytic leukemia. Nat Med. 2018;24(5):563–571. doi: 10.1038/s41591-018-0010-1. - DOI - PMC - PubMed

Publication types

MeSH terms